Financial Performance & Investment Appraisal: J Sainsbury plc Analysis
VerifiedAdded on 2023/06/17
|20
|5997
|292
Report
AI Summary
This report provides a comprehensive financial analysis of J Sainsbury plc, a leading supermarket chain in the United Kingdom. It begins with a brief history of the company, detailing its origins, growth, and evolution. The analysis then delves into Sainsbury's financial performance over the last five years, calculating and interpreting key profitability, liquidity, gearing, and efficiency ratios, with a comparison to competitor Morrisons. Furthermore, the report evaluates two investment projects using techniques like payback period, accounting rate of return, and net present value, providing critical analysis and recommendations. It also discusses the advantages and shortcomings of different investment appraisal methods. The report aims to provide a thorough understanding of Sainsbury's financial standing and investment decision-making processes. Desklib offers a wide range of solved assignments and past papers for students.

Financial
Management
Management
Paraphrase This Document
Need a fresh take? Get an instant paraphrase of this document with our AI Paraphraser
Table of Contents
INTRODUCTION ..........................................................................................................................3
PART A ..........................................................................................................................................3
A Brief history of J Sainsbury................................................................................................3
PART B ...........................................................................................................................................4
Sainsbury's Financial Performance........................................................................................4
Calculation of last five years financial ratios ...............................................................4
PART C .........................................................................................................................................13
Usage of Investment Appraisal technique............................................................................13
Calculation of Payback period, Accounting rate of return and net present value with critical
analysis of the results following recommendations....................................................13
Advantages and Shortcomings of the different techniques of Investment appraisal. .16
CONCLUSION .............................................................................................................................17
REFERENCES..............................................................................................................................19
INTRODUCTION
Financial management is the management theory and practices which focuses on strategically
planning, organising, directing and controlling of different financial issues and requirements of
an organisation. In simple words, it is a practice of handling finances of a company while
focusing on the organisation's success. Planning, budgeting, managing and assessing risks related
to finance is the main scope of financial management (Heo, Lee, and Rabbani, 2021). In this
report the main focus is given to the financial information of a plc. The company taken for this
report is J. Sainsbury plc. It is a retail food supermarket in the United Kingdom. This report is
divided into three parts. Part A highlights a brief history of J. Sainsbury, all about the company,
its business model and major competitors. Part B shows a detailed analysis of the different type
of ratios of J Sainsbury for the last five years and a detailed comparison with a major competitor.
The comeptitor chosen for this report is Morrisons. Morrisons is Part C shows a investment
appraisal techniques and evaluates the two projects provided.
PART A
A Brief history of J Sainsbury
J. Sainsbury is one the leading supermarket chain in the United Kingdom. It currently
holds market share of 16% in the the supermarket sector. It was founded in the year 1869 by
John J Sainsbury. He started the business as partnership between him and his wife Mary Ann
with a one store in Drury Lane, London. They began trading of ready to eat foods with the
freshness and later expanded into packaged consumable items and grocery items like sugar, tea,
chips (Cheak-Zamora, Teti, Peters, and Maurer-Batjer, 2017). The mission of the business in the
19th century was Quality perfect, Prices lower. The business grew stronger and wider. The
management offered extra convenience to the public to hold the competitive edge in the market
and it was in the year 1922 that the business was commenced as a private establishment and
became one of the largest grocery group of UK. In the year 1928, there were 128 shops and
James Sainsbury was replaced by his firstborn son John Benjamin Sainsbury, after his death.
From the year 1930s till 1940s, the company was run by his eldest son and the company
continued to produce quality products and maintained its leadership in the market. In the year
1938, the founder's grandson, Alan Sainsbury, became the managing director of the business.
Eruption of World War II were the crucial and difficult years for the business as most of the
⊘ This is a preview!⊘
Do you want full access?
Subscribe today to unlock all pages.
Trusted by 1+ million students worldwide
places where the company was trading were bombed. Male employees were now replaced by
women as the men were asked for National Service.
In the year 1950s-1960s, the company introduced the self – service food market in UK,
when Alan Sainsbury became the chairman after his father's death. The first self-service branch
which was opened in Croydon, in the year 1950. The company was altogether closely-held by
the family of Sainsbury until the organisation went public in 1973. A million of shares were kept
for the staff which raised the prices of shares in the market when the employees started buying.
The application were closed within a minute and £495 million were offered already for the
available shares (Osoolian, Hoseyni Esfidavajani, and Bagheri, 2019). The family still retained
the 85% of the shares as they did not want to dilute the ownership and management as they were
benefiting largely from the management by the family. The company is now managed by the
fourth generation of the originative family. John Davan Sainsbury, from the fourth generation,
took over the position of chairmanship from his Sir Robert Sainsbury in 1969 after the two years
of retirement of Alan Sainsbury. The company now started changing its supermarkets into all
self service supermarkets with varied services like valet parking, and larger space for parking
and delivering items, either in outskirts location or town center. The policy of the company was
to invest in well designed stores with the vision of good food, costs less. The company started
diversification of its product line. The company offers the groceries like fruits and vegetables,
meat and fish, dairy and bakery products health and beauty and household products. And
Sainsbury Bank. Bank offers savings accounts, credit cards, insurance products etc. The major
competitors of Sainsbury are, Tesco, Morrisons, ASDA. Lord Sainsbury is the current president
of the business.
PART B
Sainsbury's Financial Performance
Calculation of last five years financial ratios
Profitability Ratios
These are the ratios which are calculated to ascertain the ability of the business to generate
earnings in regards to its revenue and other costs (Tey, and et.al., 2021). Following are the
profitability ratios calculated for Sainsbury.
Paraphrase This Document
Need a fresh take? Get an instant paraphrase of this document with our AI Paraphraser
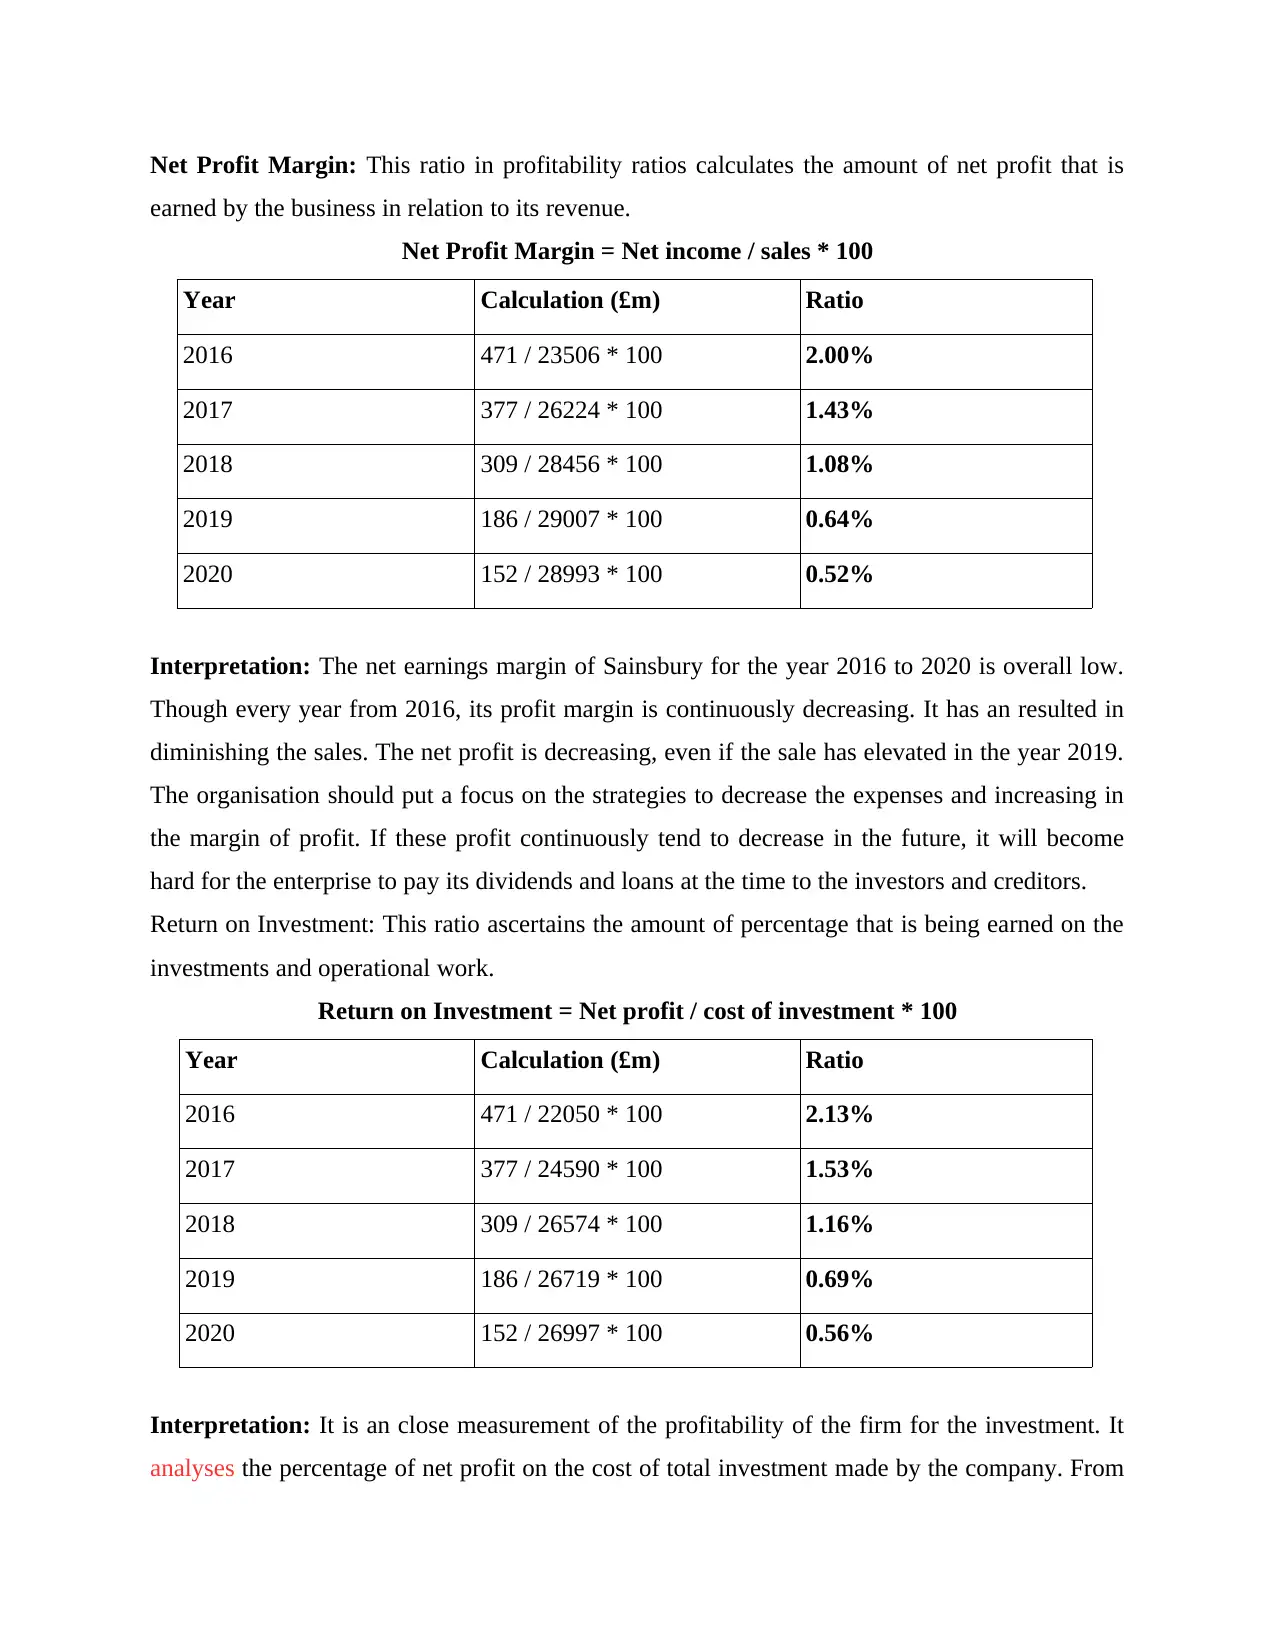
Net Profit Margin: This ratio in profitability ratios calculates the amount of net profit that is
earned by the business in relation to its revenue.
Net Profit Margin = Net income / sales * 100
Year Calculation (£m) Ratio
2016 471 / 23506 * 100 2.00%
2017 377 / 26224 * 100 1.43%
2018 309 / 28456 * 100 1.08%
2019 186 / 29007 * 100 0.64%
2020 152 / 28993 * 100 0.52%
Interpretation: The net earnings margin of Sainsbury for the year 2016 to 2020 is overall low.
Though every year from 2016, its profit margin is continuously decreasing. It has an resulted in
diminishing the sales. The net profit is decreasing, even if the sale has elevated in the year 2019.
The organisation should put a focus on the strategies to decrease the expenses and increasing in
the margin of profit. If these profit continuously tend to decrease in the future, it will become
hard for the enterprise to pay its dividends and loans at the time to the investors and creditors.
Return on Investment: This ratio ascertains the amount of percentage that is being earned on the
investments and operational work.
Return on Investment = Net profit / cost of investment * 100
Year Calculation (£m) Ratio
2016 471 / 22050 * 100 2.13%
2017 377 / 24590 * 100 1.53%
2018 309 / 26574 * 100 1.16%
2019 186 / 26719 * 100 0.69%
2020 152 / 26997 * 100 0.56%
Interpretation: It is an close measurement of the profitability of the firm for the investment. It
analyses the percentage of net profit on the cost of total investment made by the company. From
the above calculation, it can be interpreted that the returns on investment is positive but are every
less. But the return on investment of Sainsbury is decreasing every year with the decreasing in
profit and increase in investment expenses.
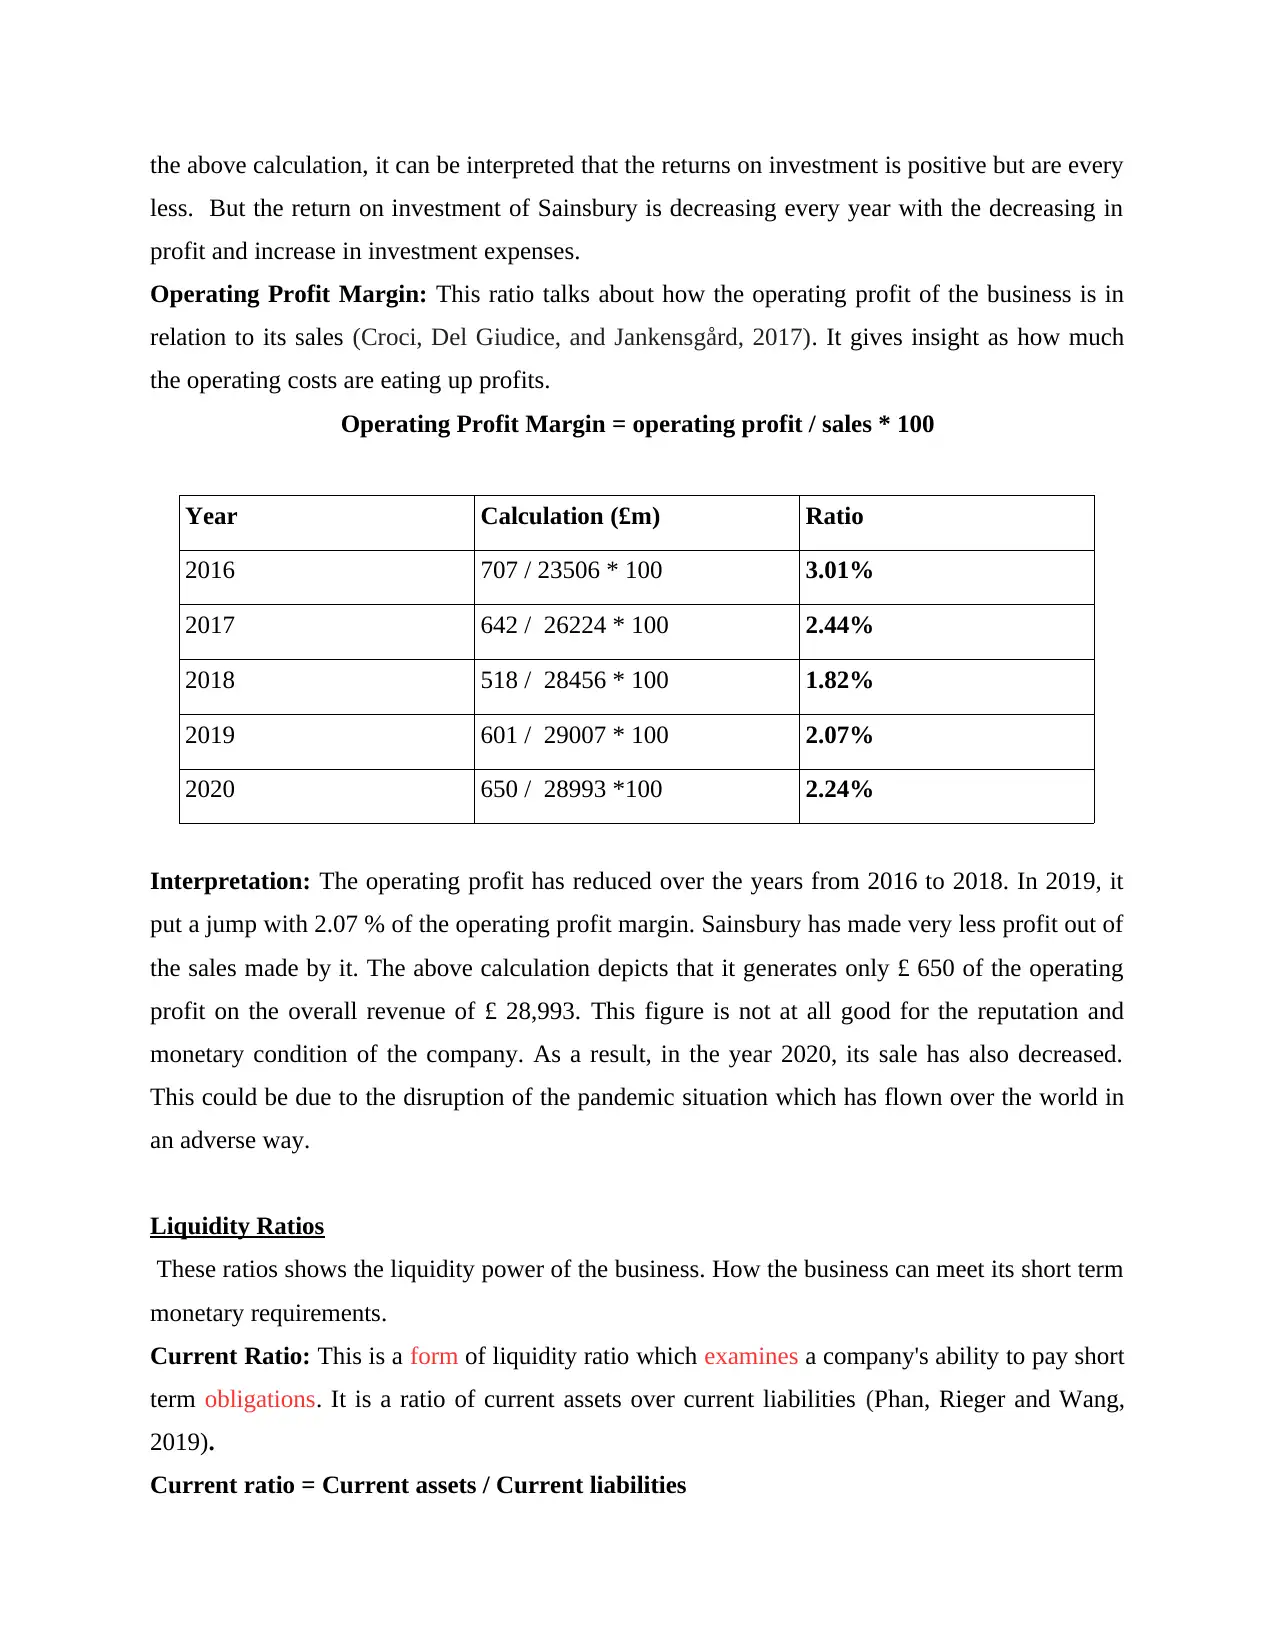
Operating Profit Margin: This ratio talks about how the operating profit of the business is in
relation to its sales (Croci, Del Giudice, and Jankensgård, 2017). It gives insight as how much
the operating costs are eating up profits.
Operating Profit Margin = operating profit / sales * 100
Year Calculation (£m) Ratio
2016 707 / 23506 * 100 3.01%
2017 642 / 26224 * 100 2.44%
2018 518 / 28456 * 100 1.82%
2019 601 / 29007 * 100 2.07%
2020 650 / 28993 *100 2.24%
Interpretation: The operating profit has reduced over the years from 2016 to 2018. In 2019, it
put a jump with 2.07 % of the operating profit margin. Sainsbury has made very less profit out of
the sales made by it. The above calculation depicts that it generates only £ 650 of the operating
profit on the overall revenue of £ 28,993. This figure is not at all good for the reputation and
monetary condition of the company. As a result, in the year 2020, its sale has also decreased.
This could be due to the disruption of the pandemic situation which has flown over the world in
an adverse way.
Liquidity Ratios
These ratios shows the liquidity power of the business. How the business can meet its short term
monetary requirements.
Current Ratio: This is a form of liquidity ratio which examines a company's ability to pay short
term obligations. It is a ratio of current assets over current liabilities (Phan, Rieger and Wang,
2019).
Current ratio = Current assets / Current liabilities
less. But the return on investment of Sainsbury is decreasing every year with the decreasing in
profit and increase in investment expenses.
Operating Profit Margin: This ratio talks about how the operating profit of the business is in
relation to its sales (Croci, Del Giudice, and Jankensgård, 2017). It gives insight as how much
the operating costs are eating up profits.
Operating Profit Margin = operating profit / sales * 100
Year Calculation (£m) Ratio
2016 707 / 23506 * 100 3.01%
2017 642 / 26224 * 100 2.44%
2018 518 / 28456 * 100 1.82%
2019 601 / 29007 * 100 2.07%
2020 650 / 28993 *100 2.24%
Interpretation: The operating profit has reduced over the years from 2016 to 2018. In 2019, it
put a jump with 2.07 % of the operating profit margin. Sainsbury has made very less profit out of
the sales made by it. The above calculation depicts that it generates only £ 650 of the operating
profit on the overall revenue of £ 28,993. This figure is not at all good for the reputation and
monetary condition of the company. As a result, in the year 2020, its sale has also decreased.
This could be due to the disruption of the pandemic situation which has flown over the world in
an adverse way.
Liquidity Ratios
These ratios shows the liquidity power of the business. How the business can meet its short term
monetary requirements.
Current Ratio: This is a form of liquidity ratio which examines a company's ability to pay short
term obligations. It is a ratio of current assets over current liabilities (Phan, Rieger and Wang,
2019).
Current ratio = Current assets / Current liabilities
⊘ This is a preview!⊘
Do you want full access?
Subscribe today to unlock all pages.
Trusted by 1+ million students worldwide
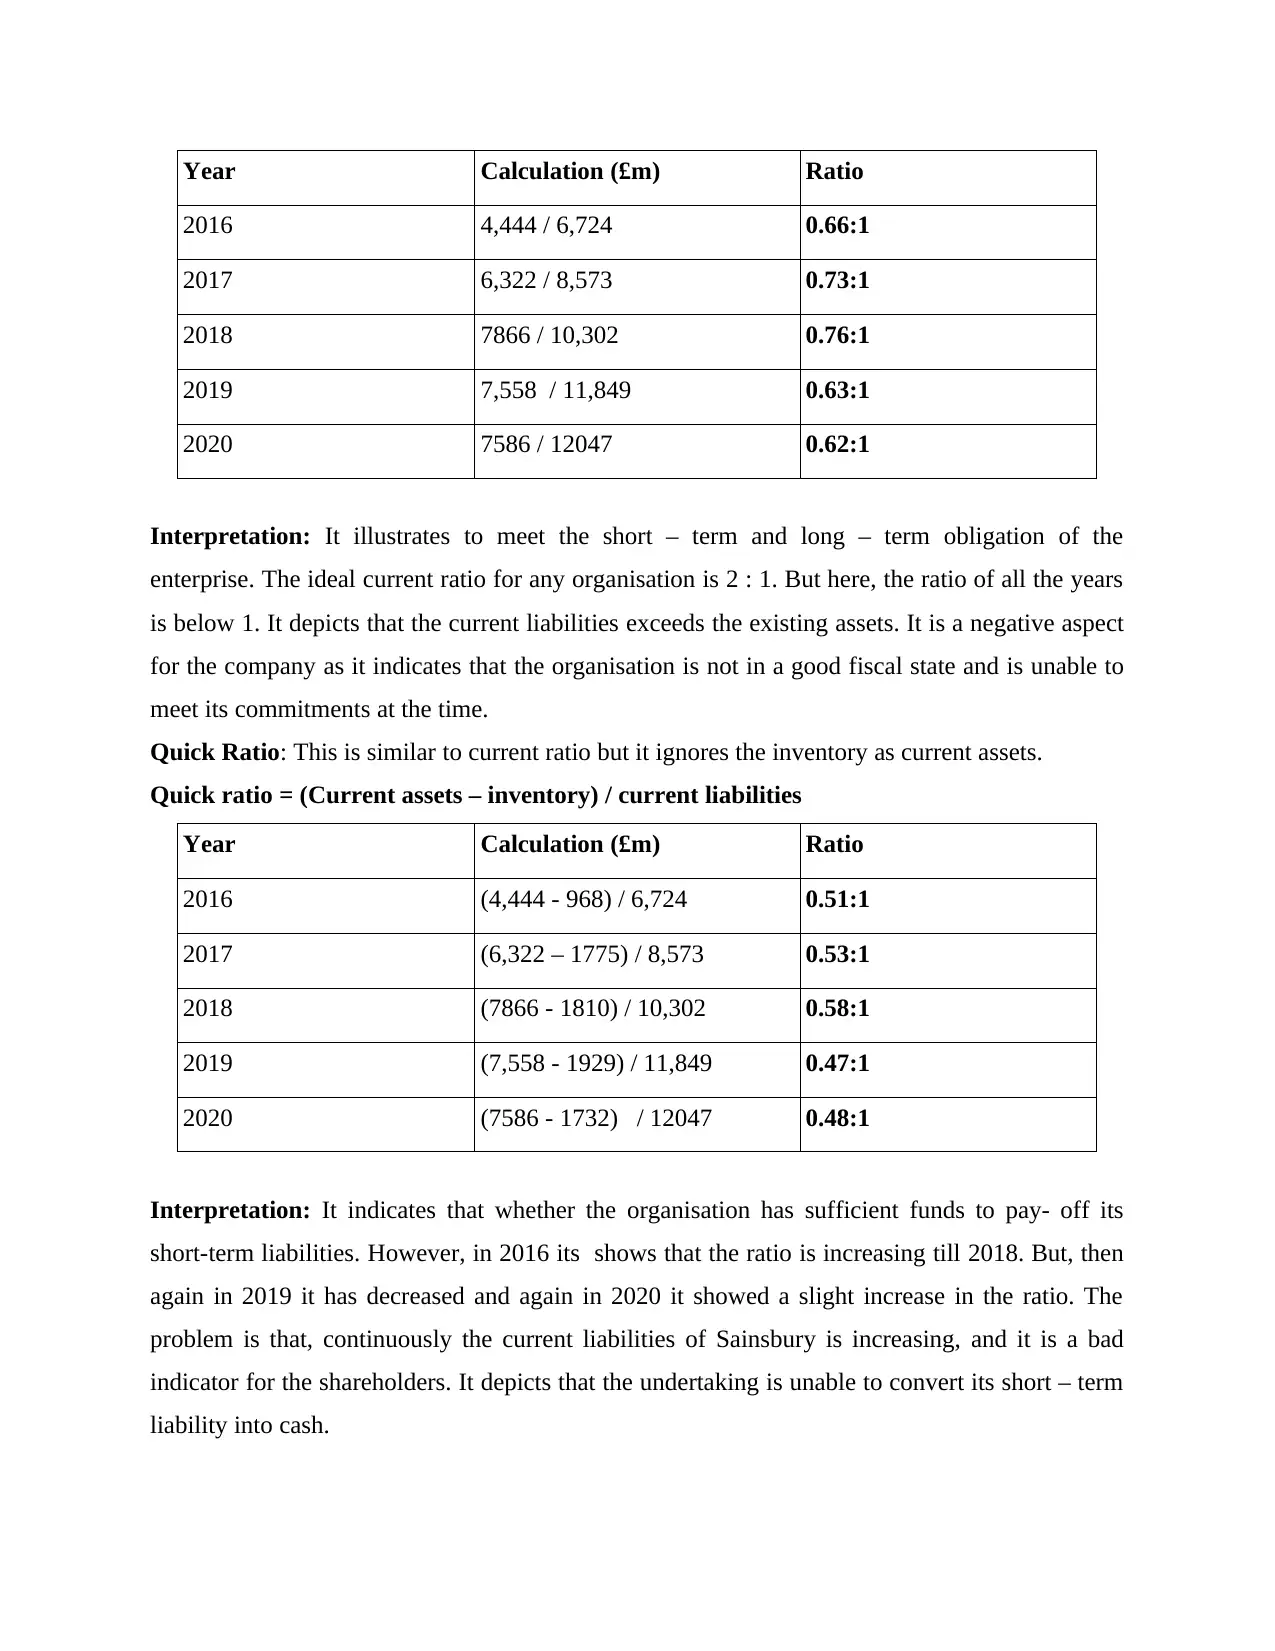
Year Calculation (£m) Ratio
2016 4,444 / 6,724 0.66:1
2017 6,322 / 8,573 0.73:1
2018 7866 / 10,302 0.76:1
2019 7,558 / 11,849 0.63:1
2020 7586 / 12047 0.62:1
Interpretation: It illustrates to meet the short – term and long – term obligation of the
enterprise. The ideal current ratio for any organisation is 2 : 1. But here, the ratio of all the years
is below 1. It depicts that the current liabilities exceeds the existing assets. It is a negative aspect
for the company as it indicates that the organisation is not in a good fiscal state and is unable to
meet its commitments at the time.
Quick Ratio: This is similar to current ratio but it ignores the inventory as current assets.
Quick ratio = (Current assets – inventory) / current liabilities
Year Calculation (£m) Ratio
2016 (4,444 - 968) / 6,724 0.51:1
2017 (6,322 – 1775) / 8,573 0.53:1
2018 (7866 - 1810) / 10,302 0.58:1
2019 (7,558 - 1929) / 11,849 0.47:1
2020 (7586 - 1732) / 12047 0.48:1
Interpretation: It indicates that whether the organisation has sufficient funds to pay- off its
short-term liabilities. However, in 2016 its shows that the ratio is increasing till 2018. But, then
again in 2019 it has decreased and again in 2020 it showed a slight increase in the ratio. The
problem is that, continuously the current liabilities of Sainsbury is increasing, and it is a bad
indicator for the shareholders. It depicts that the undertaking is unable to convert its short – term
liability into cash.
Paraphrase This Document
Need a fresh take? Get an instant paraphrase of this document with our AI Paraphraser
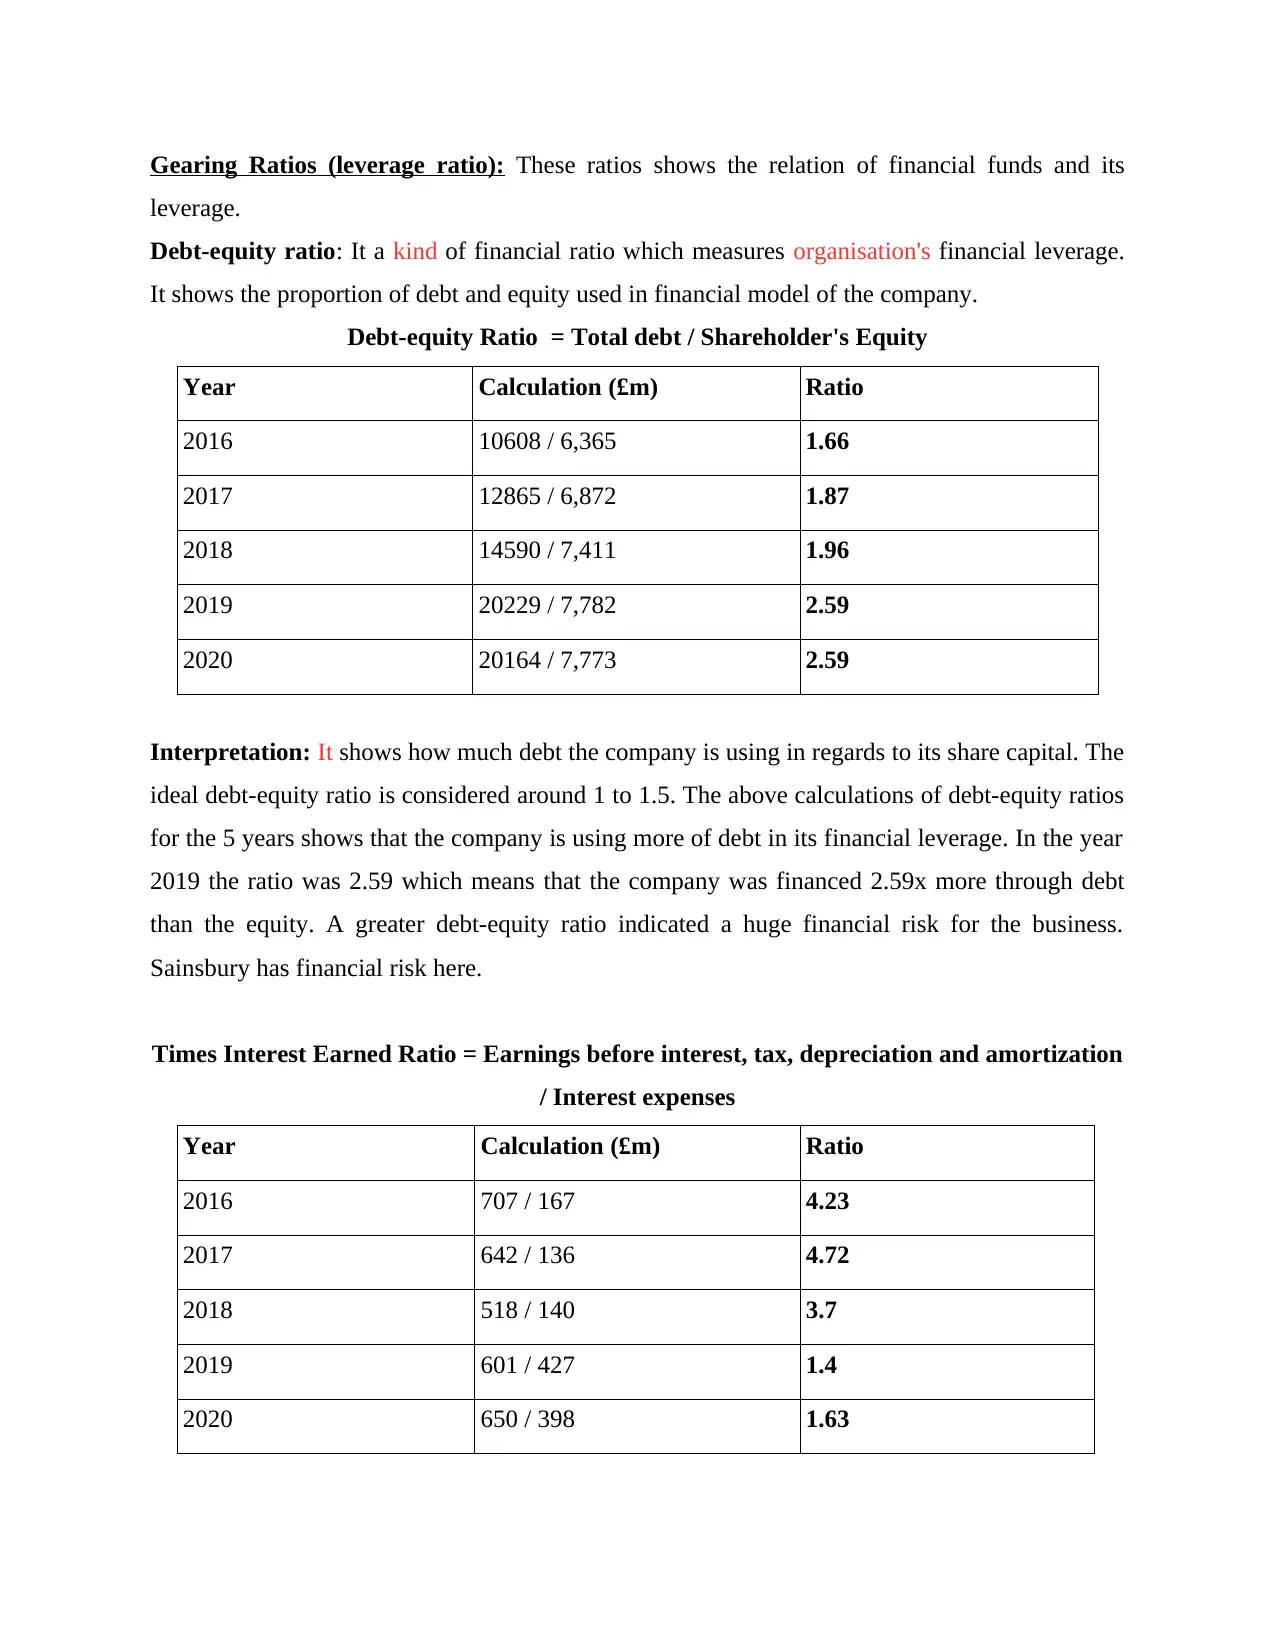
Gearing Ratios (leverage ratio): These ratios shows the relation of financial funds and its
leverage.
Debt-equity ratio: It a kind of financial ratio which measures organisation's financial leverage.
It shows the proportion of debt and equity used in financial model of the company.
Debt-equity Ratio = Total debt / Shareholder's Equity
Year Calculation (£m) Ratio
2016 10608 / 6,365 1.66
2017 12865 / 6,872 1.87
2018 14590 / 7,411 1.96
2019 20229 / 7,782 2.59
2020 20164 / 7,773 2.59
Interpretation: It shows how much debt the company is using in regards to its share capital. The
ideal debt-equity ratio is considered around 1 to 1.5. The above calculations of debt-equity ratios
for the 5 years shows that the company is using more of debt in its financial leverage. In the year
2019 the ratio was 2.59 which means that the company was financed 2.59x more through debt
than the equity. A greater debt-equity ratio indicated a huge financial risk for the business.
Sainsbury has financial risk here.
Times Interest Earned Ratio = Earnings before interest, tax, depreciation and amortization
/ Interest expenses
Year Calculation (£m) Ratio
2016 707 / 167 4.23
2017 642 / 136 4.72
2018 518 / 140 3.7
2019 601 / 427 1.4
2020 650 / 398 1.63
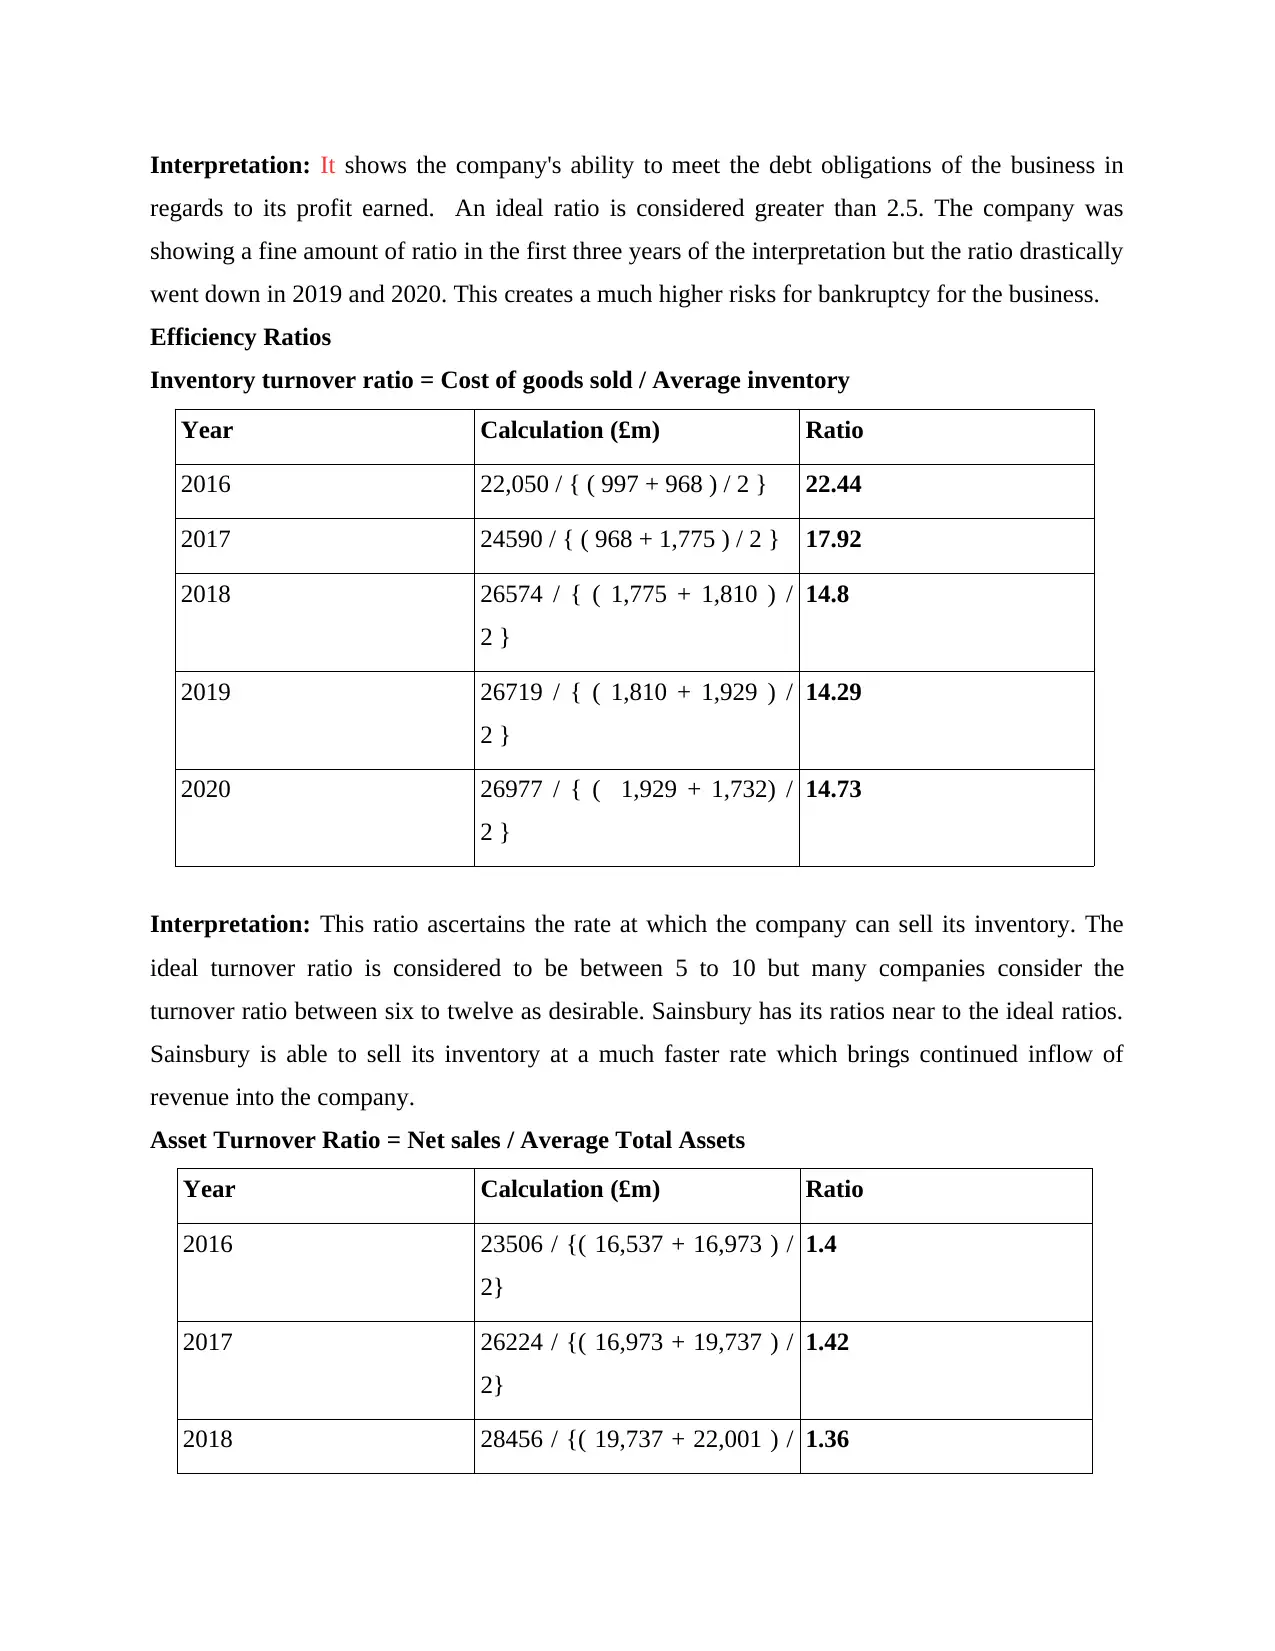
Interpretation: It shows the company's ability to meet the debt obligations of the business in
regards to its profit earned. An ideal ratio is considered greater than 2.5. The company was
showing a fine amount of ratio in the first three years of the interpretation but the ratio drastically
went down in 2019 and 2020. This creates a much higher risks for bankruptcy for the business.
Efficiency Ratios
Inventory turnover ratio = Cost of goods sold / Average inventory
Year Calculation (£m) Ratio
2016 22,050 / { ( 997 + 968 ) / 2 } 22.44
2017 24590 / { ( 968 + 1,775 ) / 2 } 17.92
2018 26574 / { ( 1,775 + 1,810 ) /
2 }
14.8
2019 26719 / { ( 1,810 + 1,929 ) /
2 }
14.29
2020 26977 / { ( 1,929 + 1,732) /
2 }
14.73
Interpretation: This ratio ascertains the rate at which the company can sell its inventory. The
ideal turnover ratio is considered to be between 5 to 10 but many companies consider the
turnover ratio between six to twelve as desirable. Sainsbury has its ratios near to the ideal ratios.
Sainsbury is able to sell its inventory at a much faster rate which brings continued inflow of
revenue into the company.
Asset Turnover Ratio = Net sales / Average Total Assets
Year Calculation (£m) Ratio
2016 23506 / {( 16,537 + 16,973 ) /
2}
1.4
2017 26224 / {( 16,973 + 19,737 ) /
2}
1.42
2018 28456 / {( 19,737 + 22,001 ) / 1.36
⊘ This is a preview!⊘
Do you want full access?
Subscribe today to unlock all pages.
Trusted by 1+ million students worldwide
2}
2019 29007 / {( 22,001 + 28,011 ) /
2}
1.16
2020 28993 / {( 28,011 + 27,937 ) /
2}
1.03
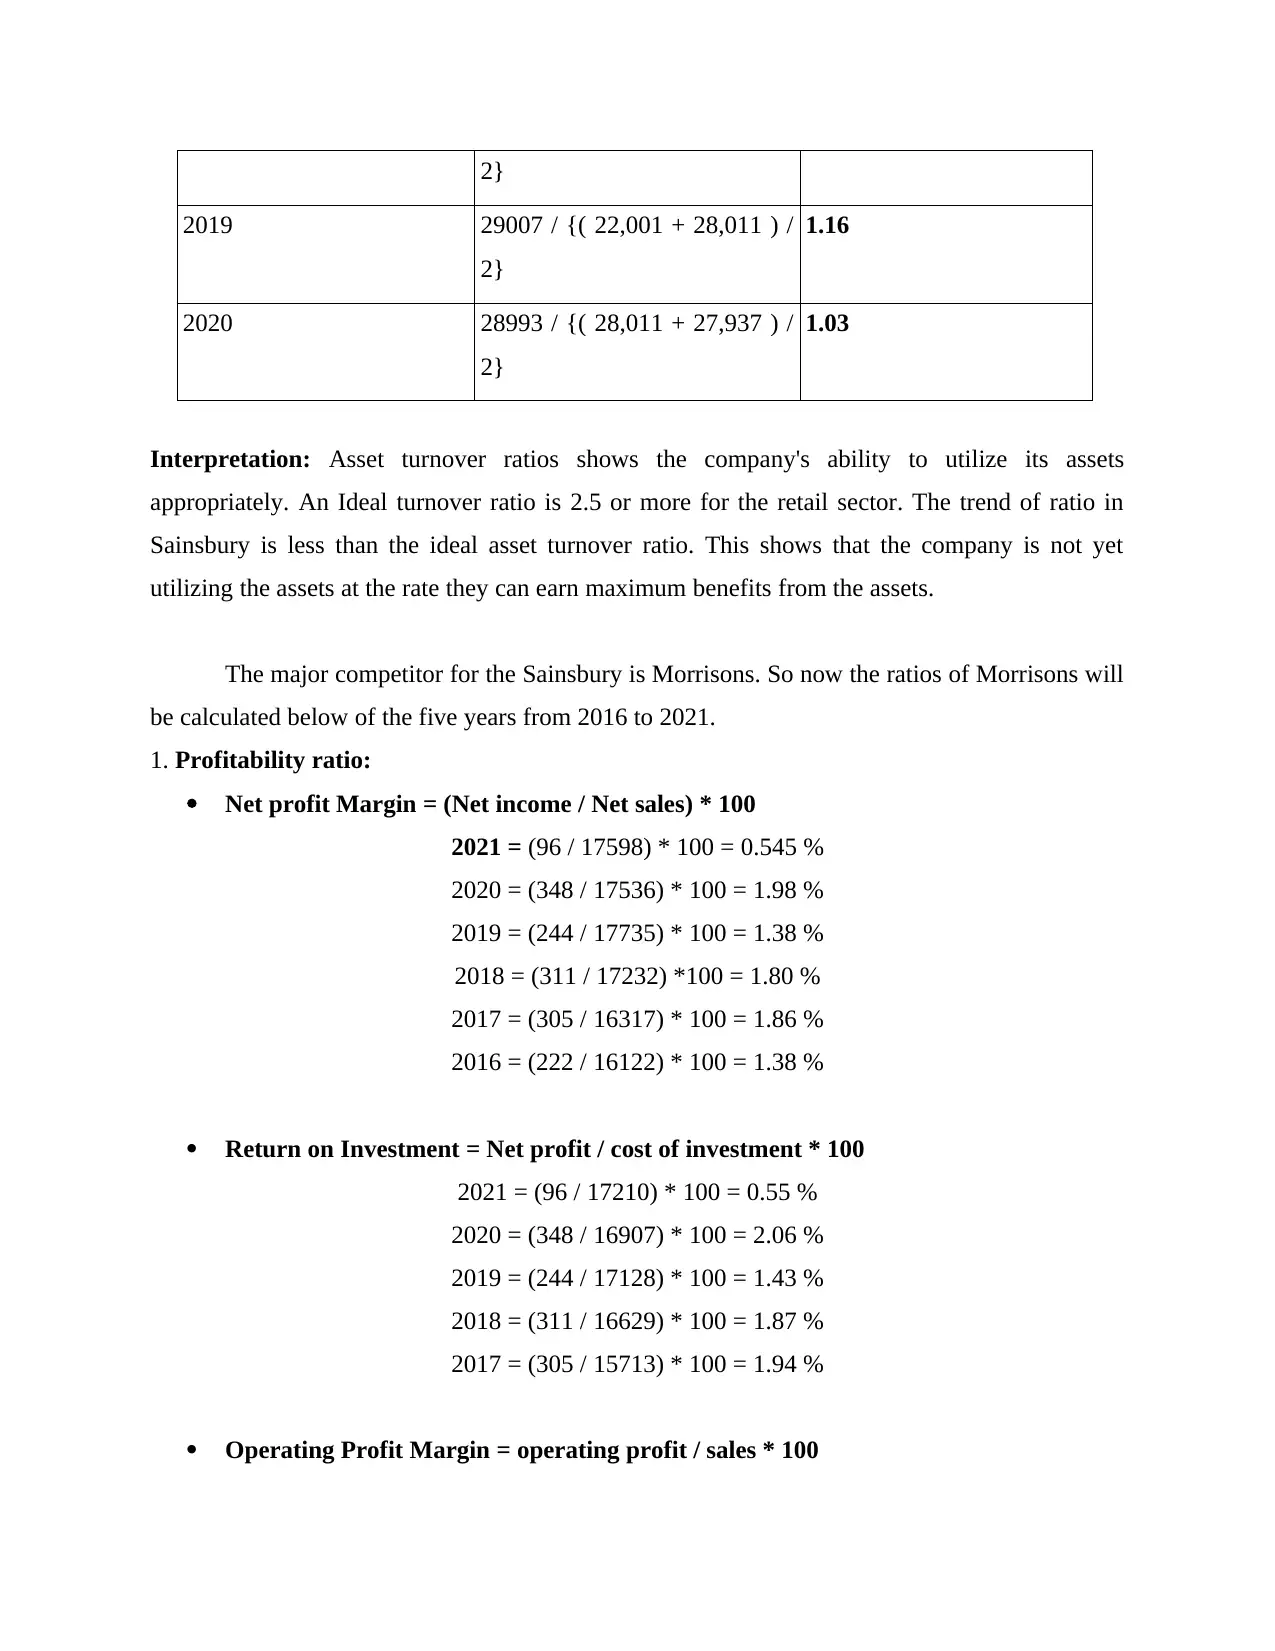
Interpretation: Asset turnover ratios shows the company's ability to utilize its assets
appropriately. An Ideal turnover ratio is 2.5 or more for the retail sector. The trend of ratio in
Sainsbury is less than the ideal asset turnover ratio. This shows that the company is not yet
utilizing the assets at the rate they can earn maximum benefits from the assets.
The major competitor for the Sainsbury is Morrisons. So now the ratios of Morrisons will
be calculated below of the five years from 2016 to 2021.
1. Profitability ratio:
Net profit Margin = (Net income / Net sales) * 100
2021 = (96 / 17598) * 100 = 0.545 %
2020 = (348 / 17536) * 100 = 1.98 %
2019 = (244 / 17735) * 100 = 1.38 %
2018 = (311 / 17232) *100 = 1.80 %
2017 = (305 / 16317) * 100 = 1.86 %
2016 = (222 / 16122) * 100 = 1.38 %
Return on Investment = Net profit / cost of investment * 100
2021 = (96 / 17210) * 100 = 0.55 %
2020 = (348 / 16907) * 100 = 2.06 %
2019 = (244 / 17128) * 100 = 1.43 %
2018 = (311 / 16629) * 100 = 1.87 %
2017 = (305 / 15713) * 100 = 1.94 %
Operating Profit Margin = operating profit / sales * 100
2019 29007 / {( 22,001 + 28,011 ) /
2}
1.16
2020 28993 / {( 28,011 + 27,937 ) /
2}
1.03
Interpretation: Asset turnover ratios shows the company's ability to utilize its assets
appropriately. An Ideal turnover ratio is 2.5 or more for the retail sector. The trend of ratio in
Sainsbury is less than the ideal asset turnover ratio. This shows that the company is not yet
utilizing the assets at the rate they can earn maximum benefits from the assets.
The major competitor for the Sainsbury is Morrisons. So now the ratios of Morrisons will
be calculated below of the five years from 2016 to 2021.
1. Profitability ratio:
Net profit Margin = (Net income / Net sales) * 100
2021 = (96 / 17598) * 100 = 0.545 %
2020 = (348 / 17536) * 100 = 1.98 %
2019 = (244 / 17735) * 100 = 1.38 %
2018 = (311 / 17232) *100 = 1.80 %
2017 = (305 / 16317) * 100 = 1.86 %
2016 = (222 / 16122) * 100 = 1.38 %
Return on Investment = Net profit / cost of investment * 100
2021 = (96 / 17210) * 100 = 0.55 %
2020 = (348 / 16907) * 100 = 2.06 %
2019 = (244 / 17128) * 100 = 1.43 %
2018 = (311 / 16629) * 100 = 1.87 %
2017 = (305 / 15713) * 100 = 1.94 %
Operating Profit Margin = operating profit / sales * 100
Paraphrase This Document
Need a fresh take? Get an instant paraphrase of this document with our AI Paraphraser
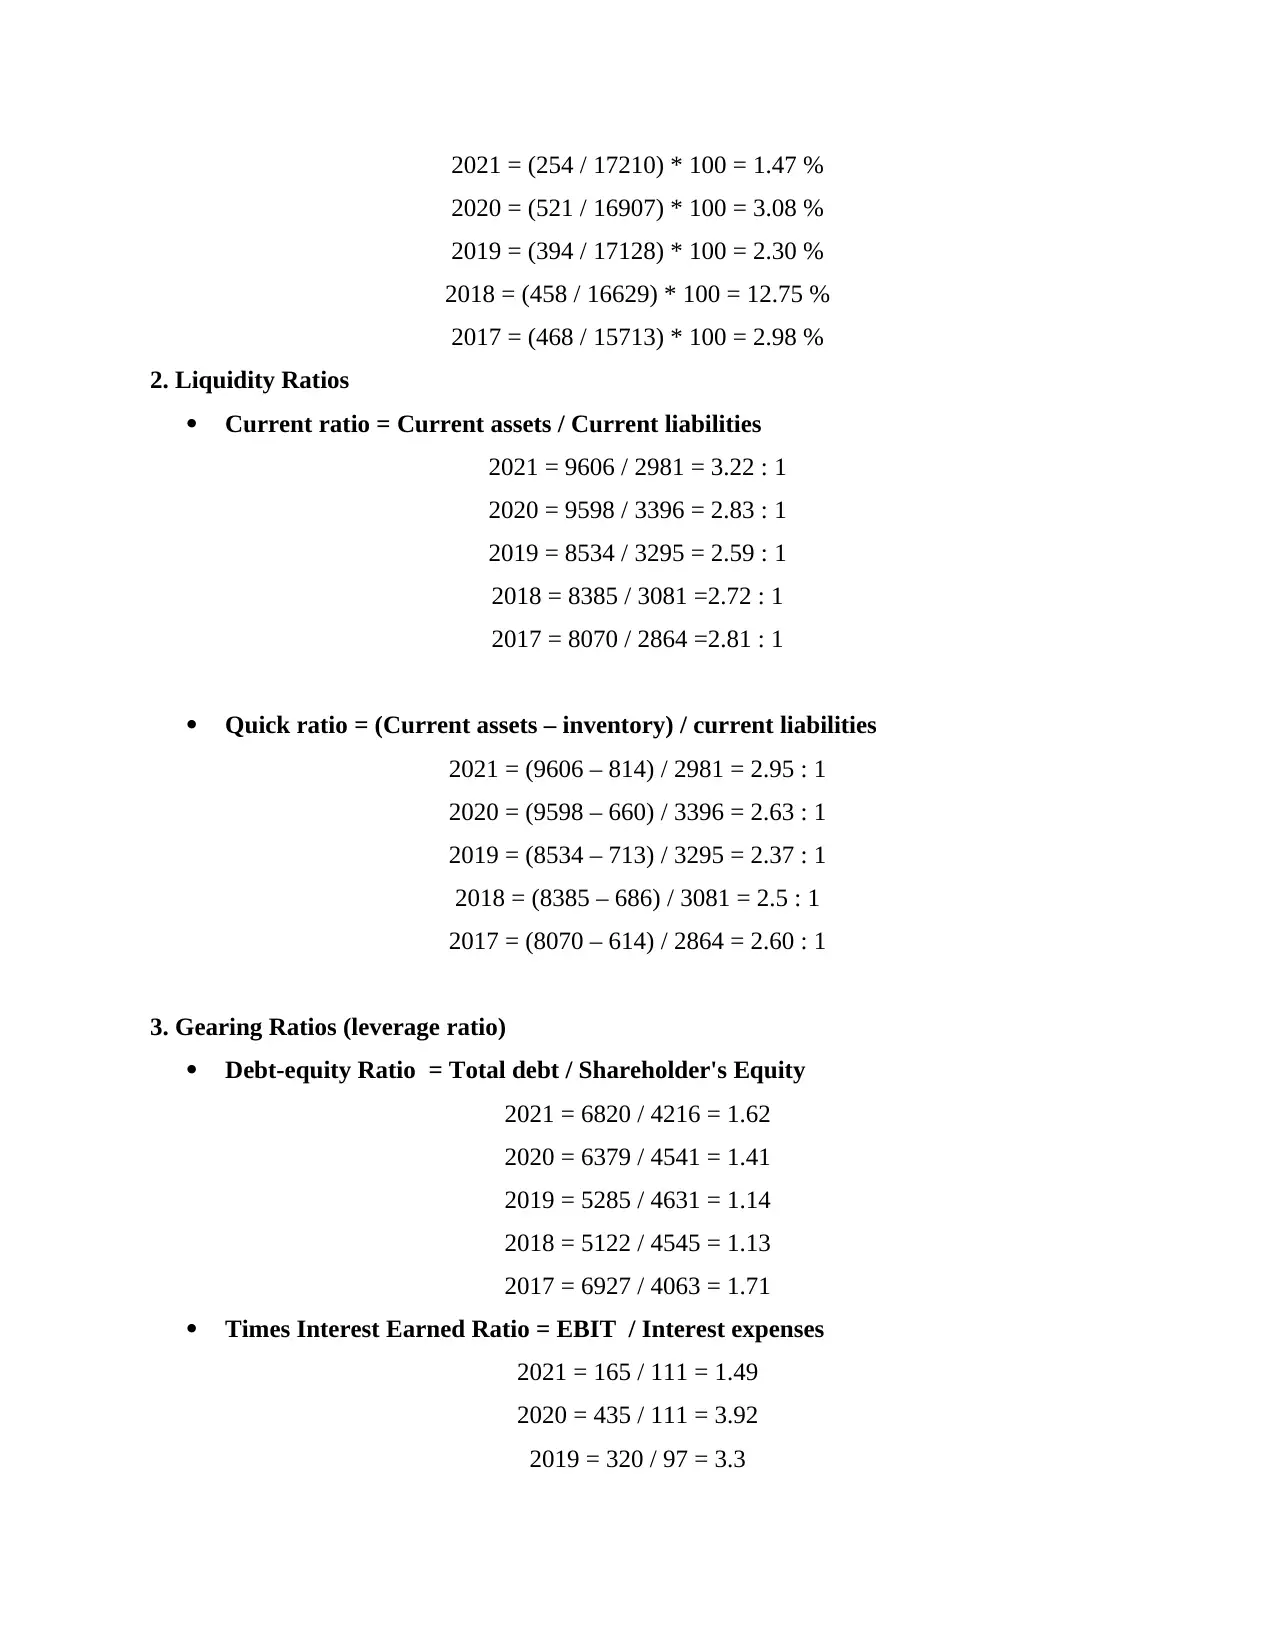
2021 = (254 / 17210) * 100 = 1.47 %
2020 = (521 / 16907) * 100 = 3.08 %
2019 = (394 / 17128) * 100 = 2.30 %
2018 = (458 / 16629) * 100 = 12.75 %
2017 = (468 / 15713) * 100 = 2.98 %
2. Liquidity Ratios
Current ratio = Current assets / Current liabilities
2021 = 9606 / 2981 = 3.22 : 1
2020 = 9598 / 3396 = 2.83 : 1
2019 = 8534 / 3295 = 2.59 : 1
2018 = 8385 / 3081 =2.72 : 1
2017 = 8070 / 2864 =2.81 : 1
Quick ratio = (Current assets – inventory) / current liabilities
2021 = (9606 – 814) / 2981 = 2.95 : 1
2020 = (9598 – 660) / 3396 = 2.63 : 1
2019 = (8534 – 713) / 3295 = 2.37 : 1
2018 = (8385 – 686) / 3081 = 2.5 : 1
2017 = (8070 – 614) / 2864 = 2.60 : 1
3. Gearing Ratios (leverage ratio)
Debt-equity Ratio = Total debt / Shareholder's Equity
2021 = 6820 / 4216 = 1.62
2020 = 6379 / 4541 = 1.41
2019 = 5285 / 4631 = 1.14
2018 = 5122 / 4545 = 1.13
2017 = 6927 / 4063 = 1.71
Times Interest Earned Ratio = EBIT / Interest expenses
2021 = 165 / 111 = 1.49
2020 = 435 / 111 = 3.92
2019 = 320 / 97 = 3.3
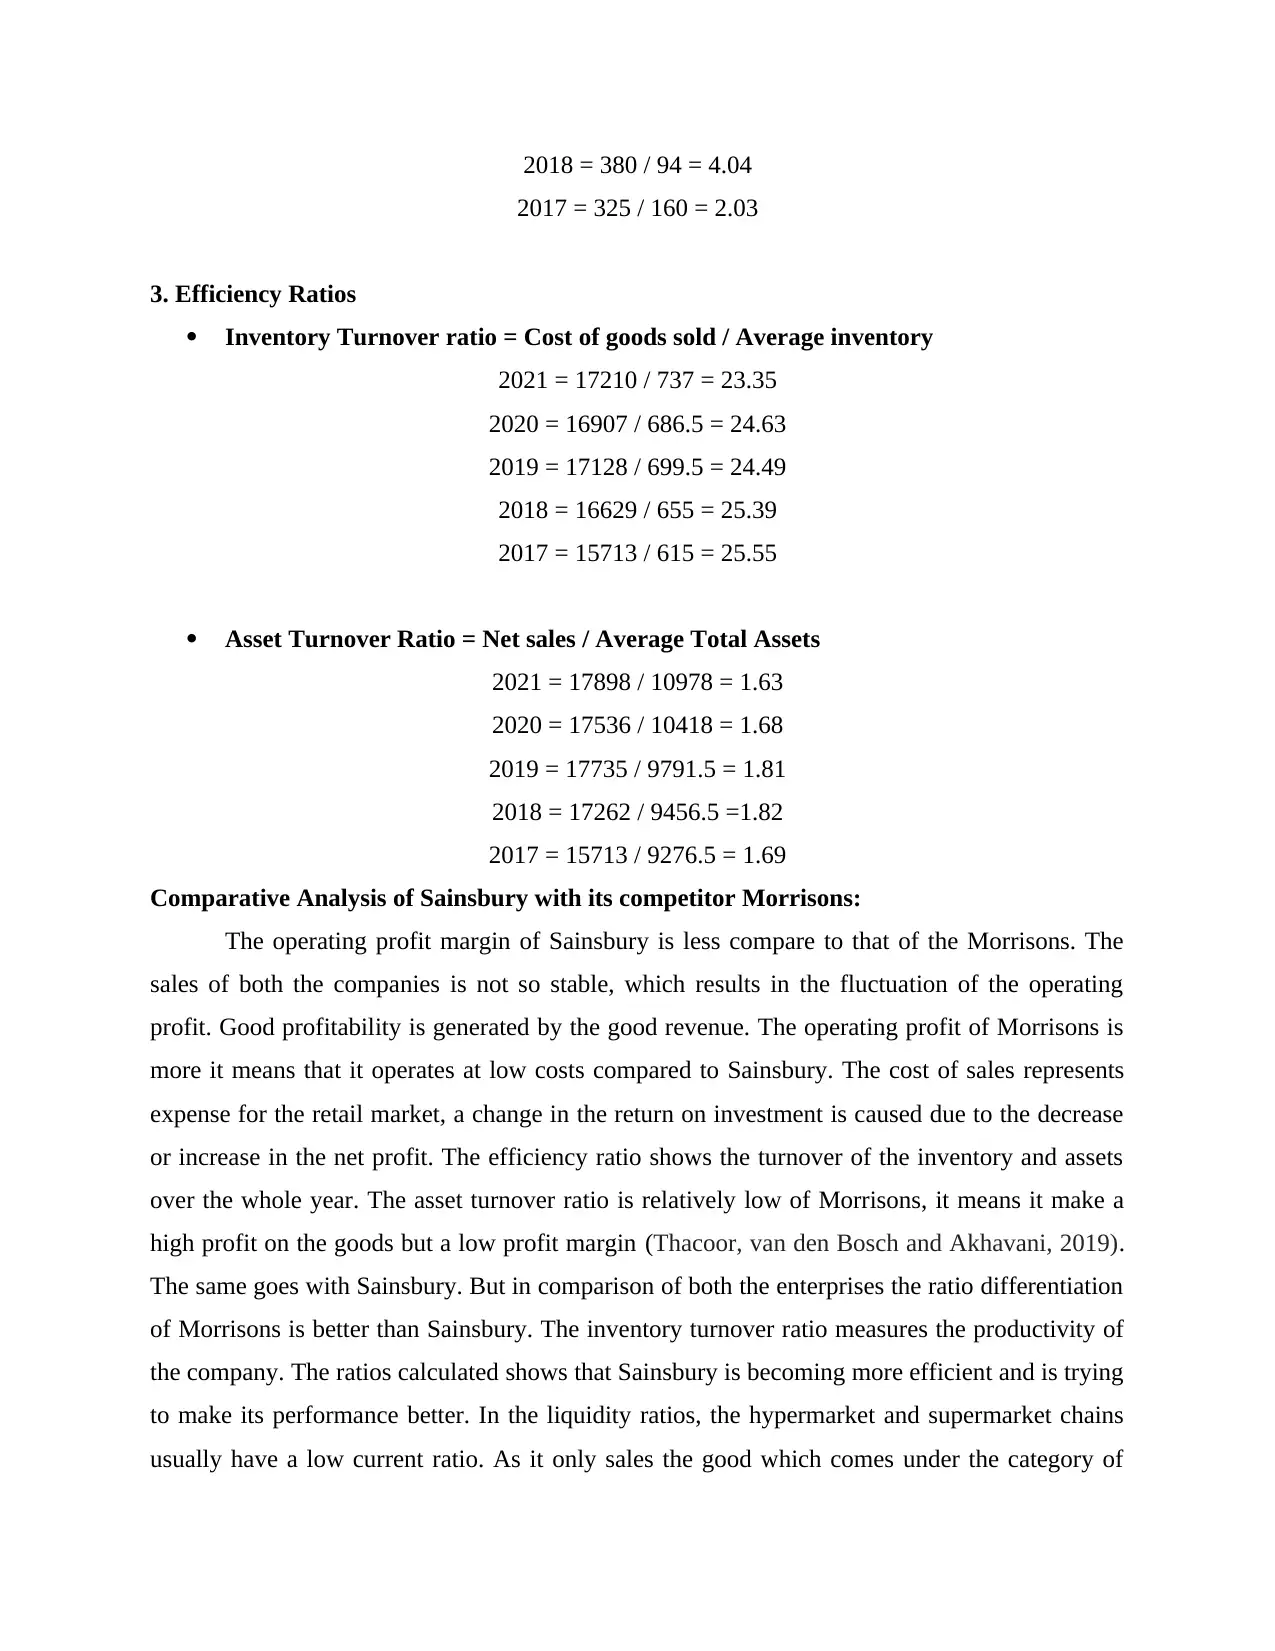
2018 = 380 / 94 = 4.04
2017 = 325 / 160 = 2.03
3. Efficiency Ratios
Inventory Turnover ratio = Cost of goods sold / Average inventory
2021 = 17210 / 737 = 23.35
2020 = 16907 / 686.5 = 24.63
2019 = 17128 / 699.5 = 24.49
2018 = 16629 / 655 = 25.39
2017 = 15713 / 615 = 25.55
Asset Turnover Ratio = Net sales / Average Total Assets
2021 = 17898 / 10978 = 1.63
2020 = 17536 / 10418 = 1.68
2019 = 17735 / 9791.5 = 1.81
2018 = 17262 / 9456.5 =1.82
2017 = 15713 / 9276.5 = 1.69
Comparative Analysis of Sainsbury with its competitor Morrisons:
The operating profit margin of Sainsbury is less compare to that of the Morrisons. The
sales of both the companies is not so stable, which results in the fluctuation of the operating
profit. Good profitability is generated by the good revenue. The operating profit of Morrisons is
more it means that it operates at low costs compared to Sainsbury. The cost of sales represents
expense for the retail market, a change in the return on investment is caused due to the decrease
or increase in the net profit. The efficiency ratio shows the turnover of the inventory and assets
over the whole year. The asset turnover ratio is relatively low of Morrisons, it means it make a
high profit on the goods but a low profit margin (Thacoor, van den Bosch and Akhavani, 2019).
The same goes with Sainsbury. But in comparison of both the enterprises the ratio differentiation
of Morrisons is better than Sainsbury. The inventory turnover ratio measures the productivity of
the company. The ratios calculated shows that Sainsbury is becoming more efficient and is trying
to make its performance better. In the liquidity ratios, the hypermarket and supermarket chains
usually have a low current ratio. As it only sales the good which comes under the category of
⊘ This is a preview!⊘
Do you want full access?
Subscribe today to unlock all pages.
Trusted by 1+ million students worldwide
1 out of 20
Related Documents


Your All-in-One AI-Powered Toolkit for Academic Success.
+13062052269
info@desklib.com
Available 24*7 on WhatsApp / Email
![[object Object]](/_next/static/media/star-bottom.7253800d.svg)
Unlock your academic potential
Copyright © 2020–2026 A2Z Services. All Rights Reserved. Developed and managed by ZUCOL.