Financial Analysis Report: Sainsbury's and Tesco's Performance
VerifiedAdded on 2021/02/21
|27
|4274
|57
Report
AI Summary
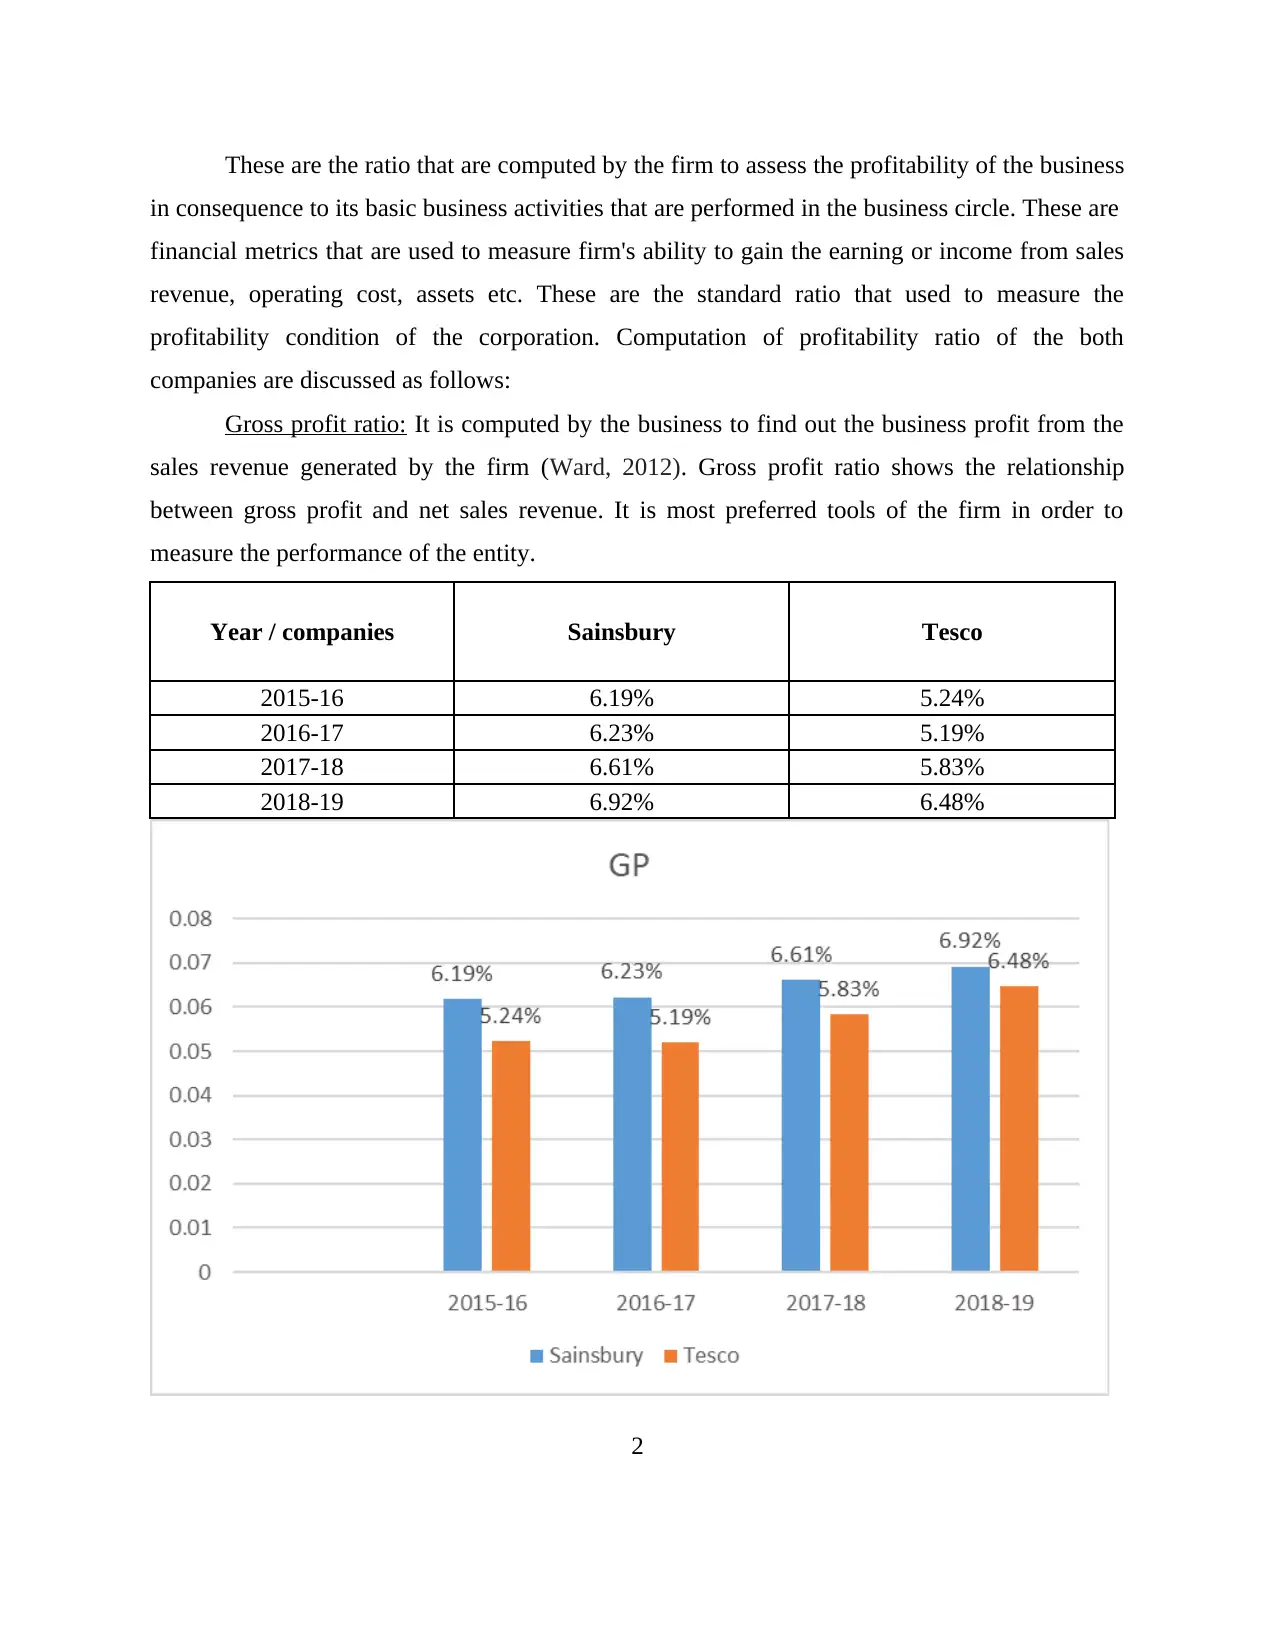
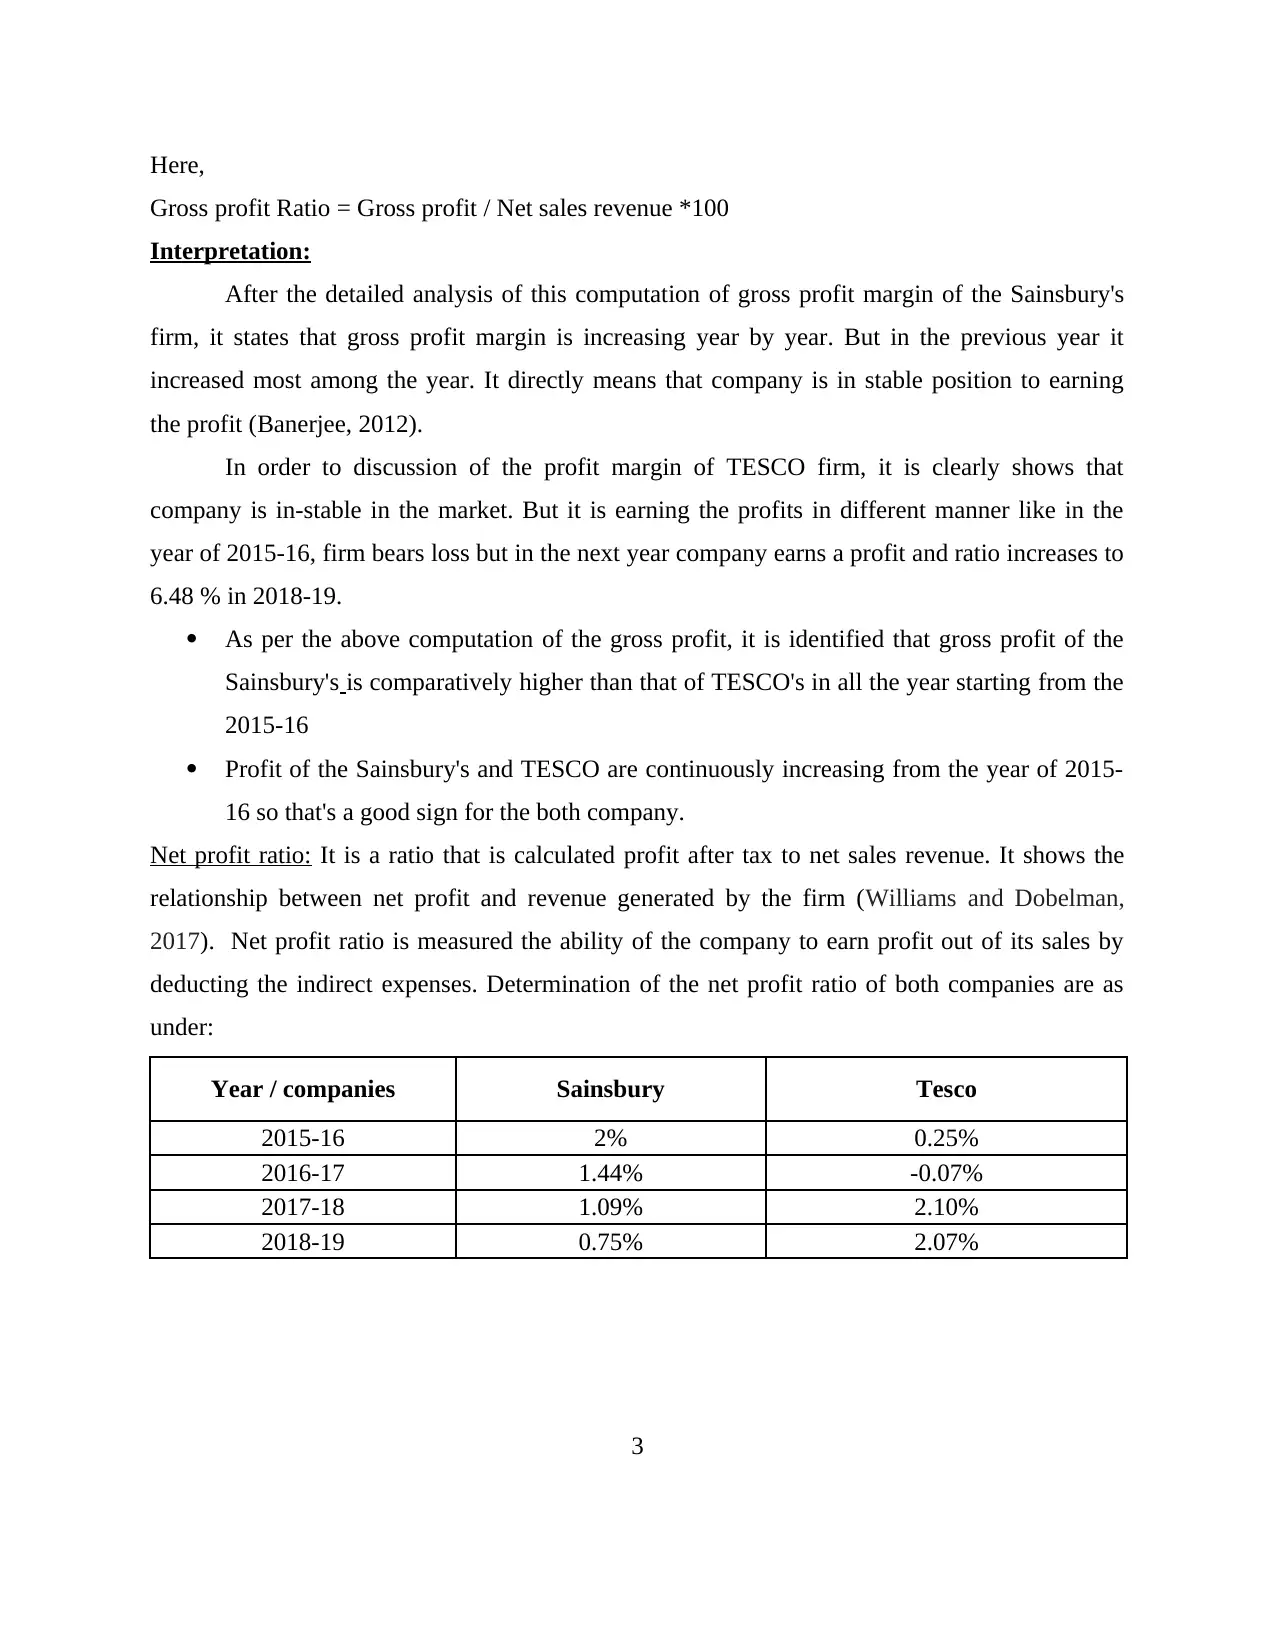
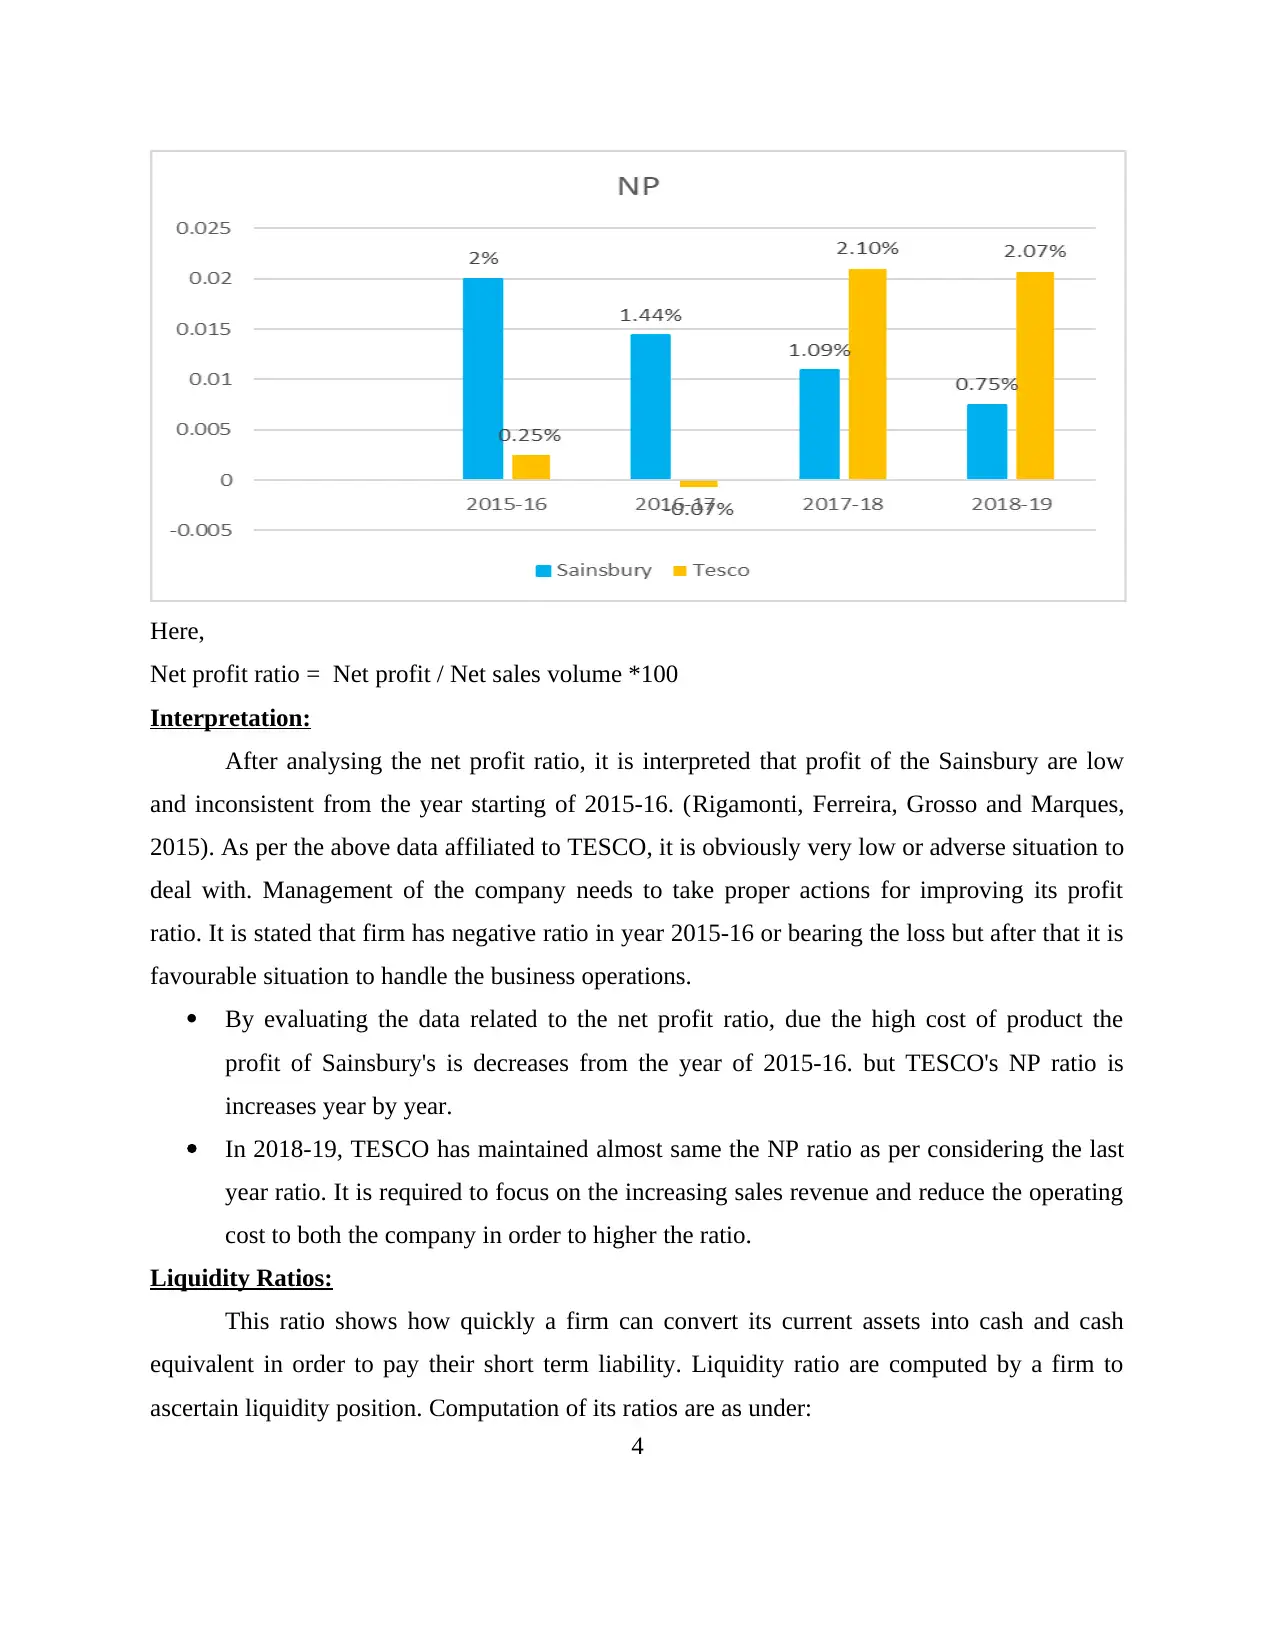
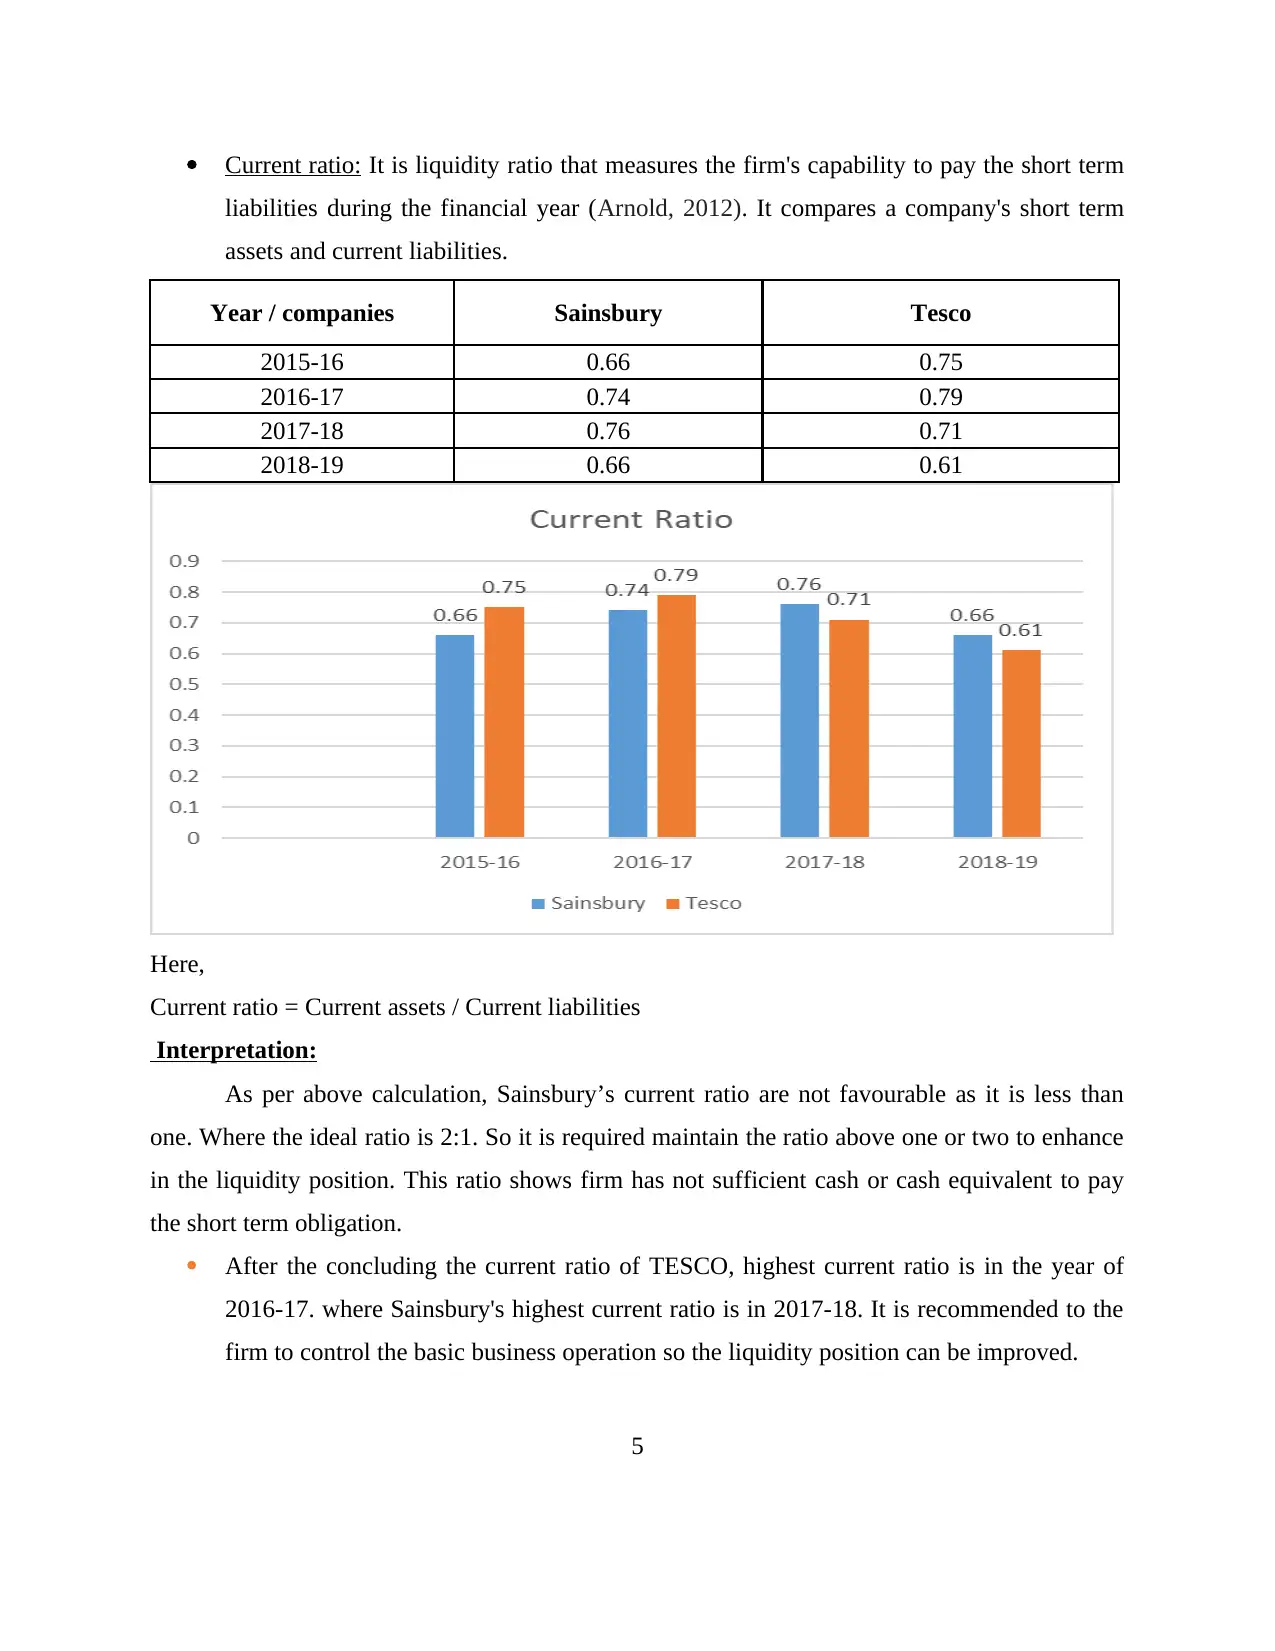
This report presents a comprehensive financial analysis of two major retail firms, Sainsbury's and Tesco. It begins with an introduction to financial analysis, emphasizing the use of tools and techniques to interpret financial statements. The main body of the report delves into detailed ratio analysis, comparing the profitability, liquidity, and solvency of both companies over several years. Profitability ratios, including gross profit and net profit margins, are calculated and interpreted to assess each firm's earning capacity. Liquidity ratios, such as current and quick ratios, are examined to evaluate their ability to meet short-term obligations. Solvency ratios, like the debt-equity ratio, are analyzed to assess their long-term financial stability. Additionally, the report includes an analysis of working capital management and cash flow, providing a holistic view of their financial health. The report concludes with a summary of the key findings, comparing the financial performance of Sainsbury's and Tesco, and highlighting areas of strength and weakness for each company. This analysis aims to provide insights into the financial strategies and performance of these two prominent players in the retail sector.
1 out of 27
Related Documents


Your All-in-One AI-Powered Toolkit for Academic Success.
+13062052269
info@desklib.com
Available 24*7 on WhatsApp / Email
![[object Object]](/_next/static/media/star-bottom.7253800d.svg)
Copyright © 2020–2026 A2Z Services. All Rights Reserved. Developed and managed by ZUCOL.