Comparative Financial Analysis Report: Sainsbury's and Tesco

Verified

Added on  2021/02/20

|21
|3864
|132
Report
AI Summary
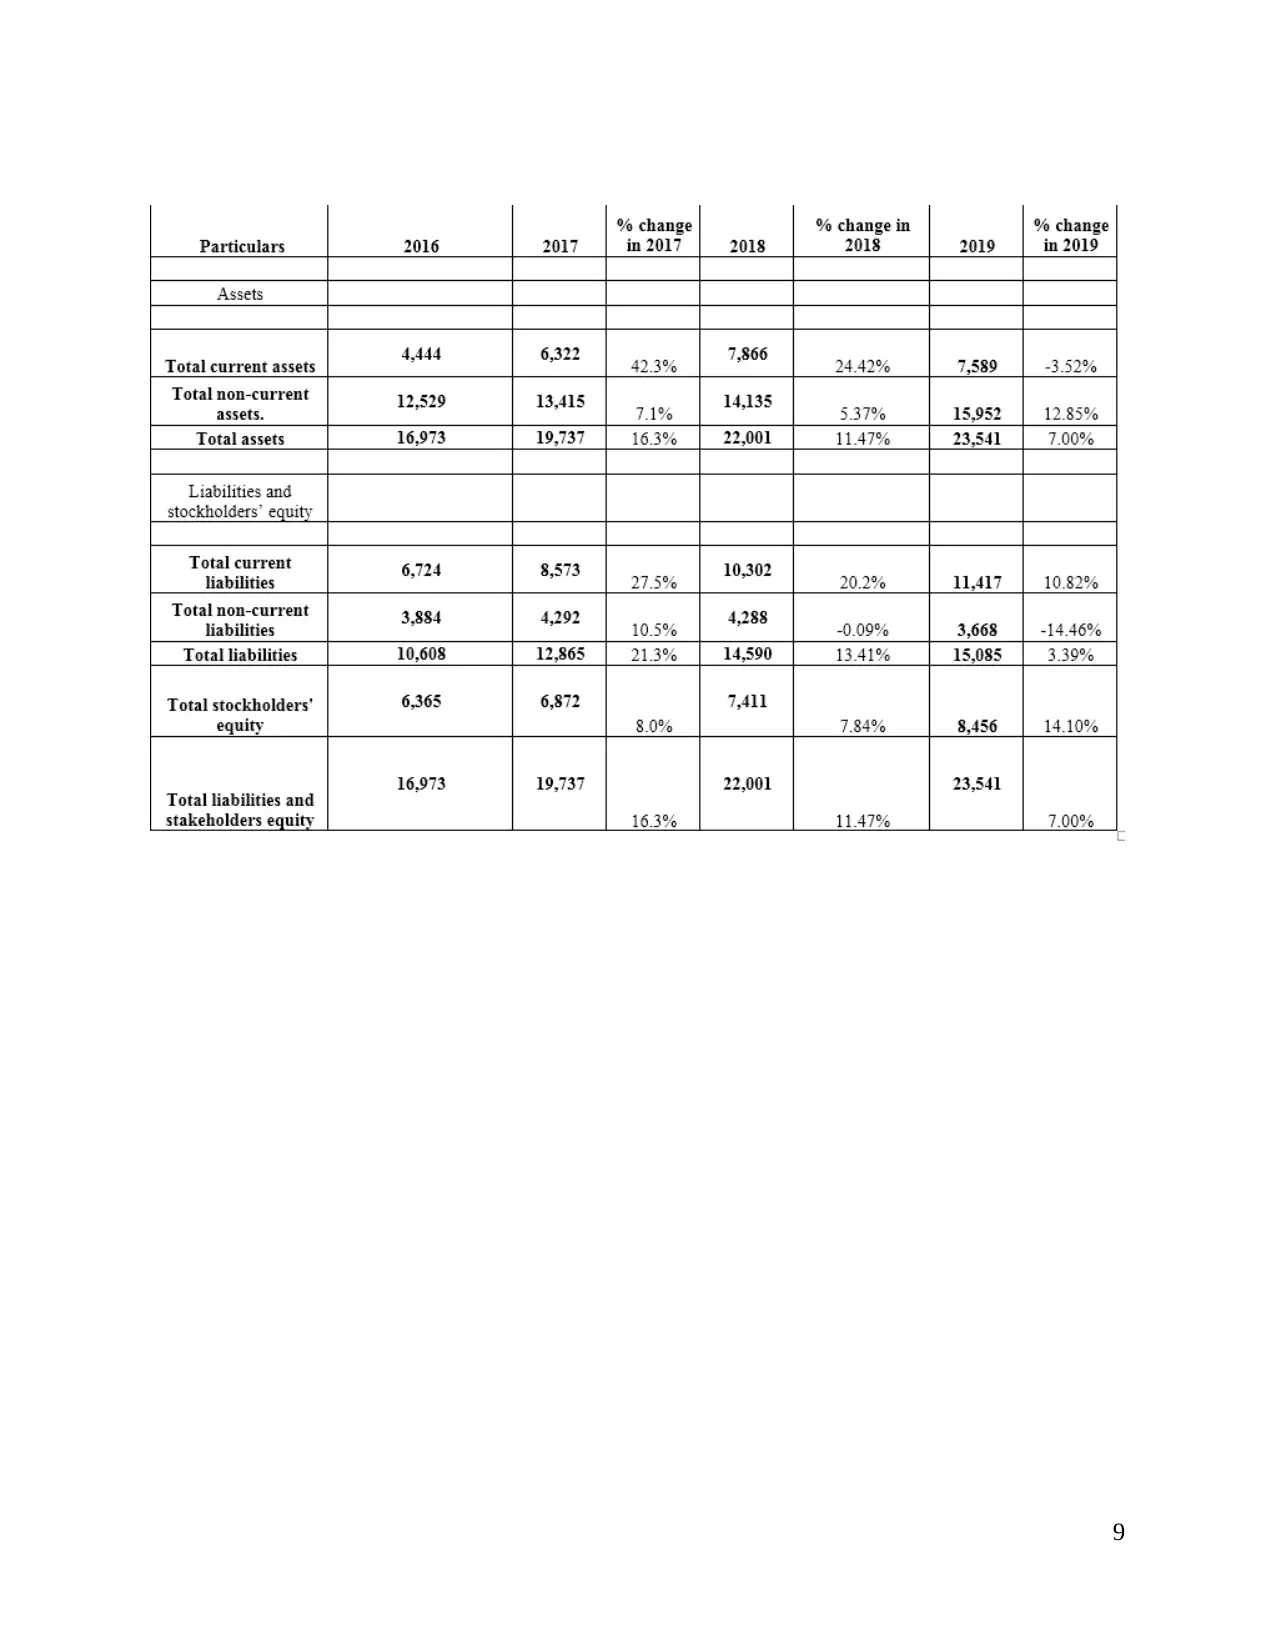
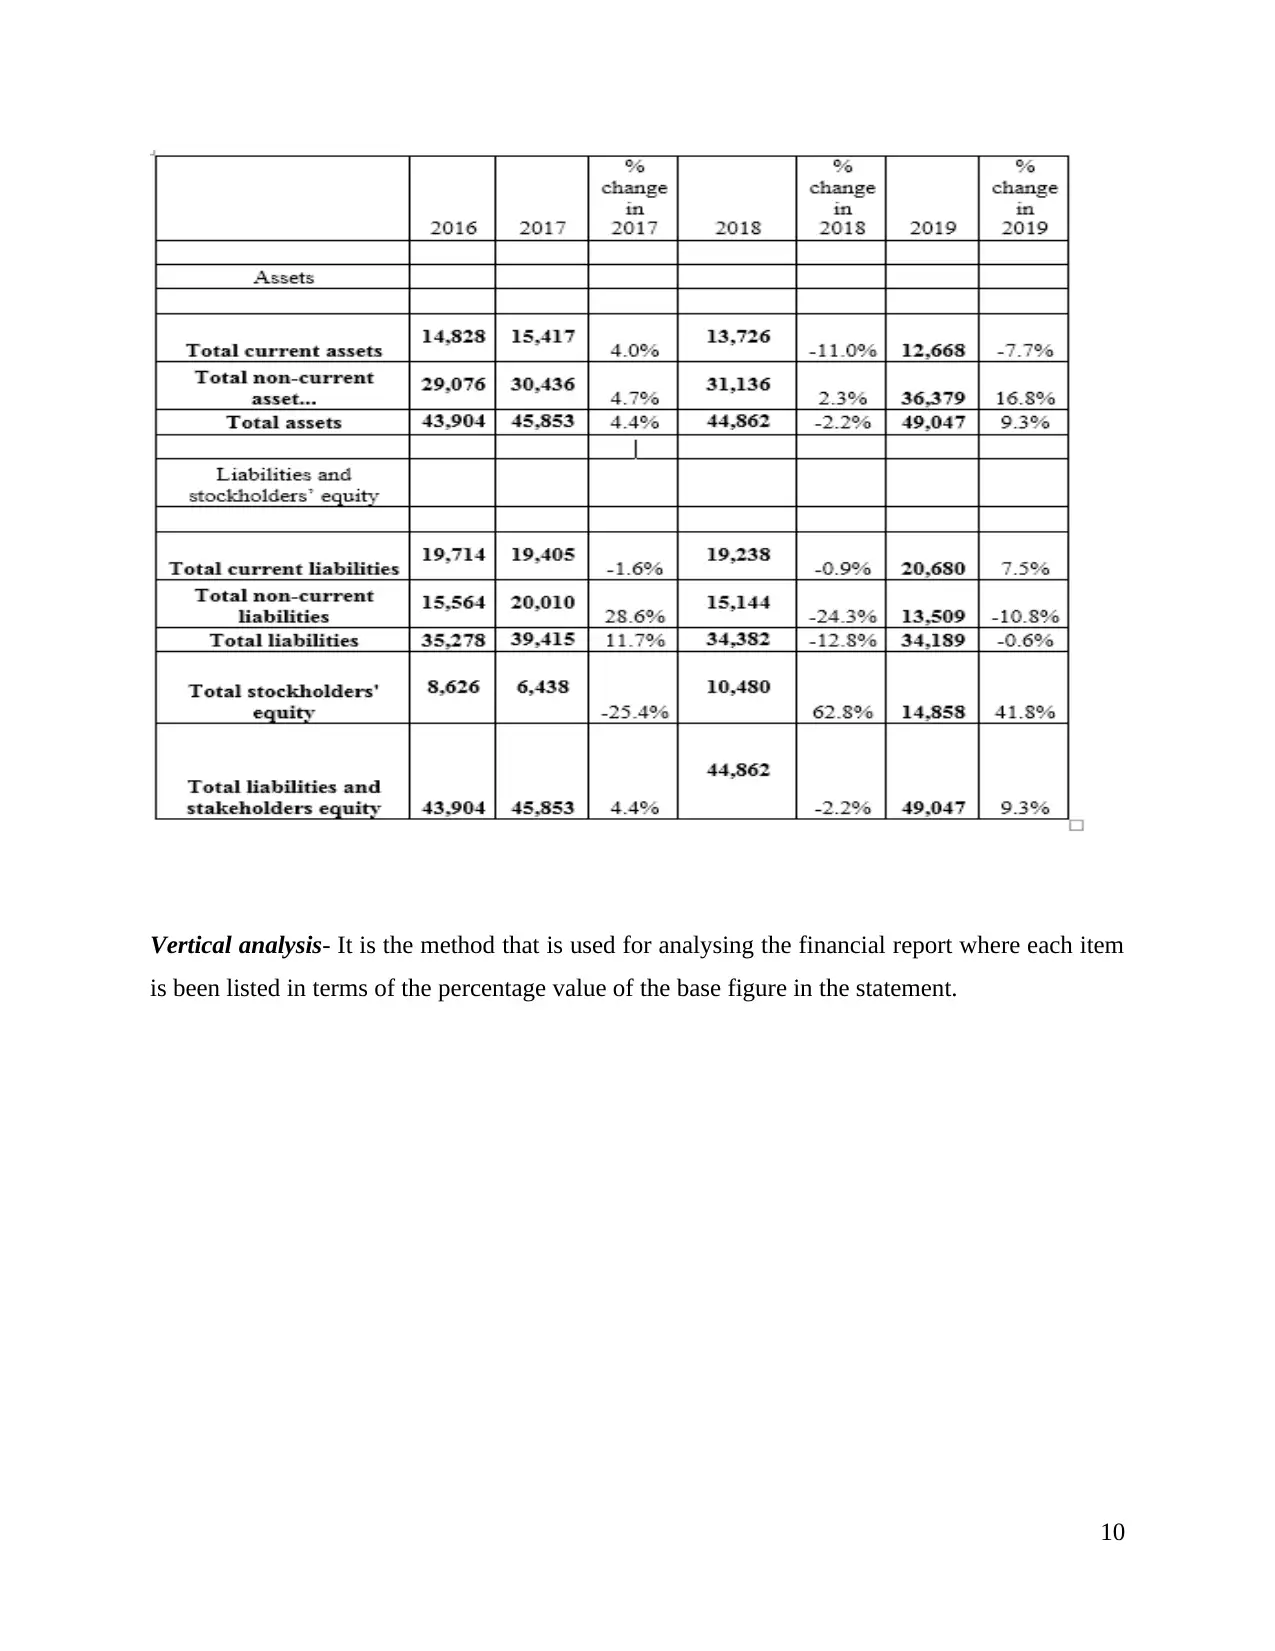
This report presents a comprehensive financial analysis of Sainsbury's and Tesco, two major retail companies. It begins with an introduction to financial analysis and its importance in evaluating a company's financial position and performance. The report then delves into detailed analyses of various financial ratios, including profitability, liquidity, solvency, and efficiency ratios, comparing the performance of both companies over a four-year period. It examines the significance of working capital management and evaluates the cash flow statements of both Sainsbury's and Tesco. The analysis includes horizontal and vertical statement analyses to predict financial statements and aid in decision-making, providing valuable insights into the financial health and operational efficiency of these companies. The report offers a comparative perspective, highlighting the strengths and weaknesses of each company based on the financial data and ratios analyzed.
Document Page
Fame
tabler-icon-diamond-filled.svg

Paraphrase This Document

Need a fresh take? Get an instant paraphrase of this document with our AI Paraphraser
Document Page
TABLE OF CONTENTS
INTRODUCTION...........................................................................................................................1
1. financial analysis.....................................................................................................................1
........................................................................................................................................................12
........................................................................................................................................................12
........................................................................................................................................................13
2. Importance of working capital in the organization...............................................................13
3. Evaluation of cash flow of last 2 year of the Sainsbury and Tesco company.......................15
Sainsbury's.....................................................................................................................................18
CONCLUSION..............................................................................................................................18
REFERENCES..............................................................................................................................20
Document Page
INTRODUCTION
Financial analysis helps in predicting the financial statements of the company in a viable and
reliable manner in order to assess the profitability and financial position of the company.
This study will evaluate the financial performance of the company which in turn results
in evaluating the financial position of the company. This study will analyse the financial ratios of
the Sainsbury and Tesco which in turn helps in examining the performance of the company. This
study will also detailed analysis of vertical and horizontal statement in order to predict the
financial statement and helps in taking necessary decision. This study will further outline the
importance of working capital in order to make necessary decision making. Lastly, this report
will critically analyse the cash flow statements of Sainsbury and Tesco.
Sainsbury company is one of the largest retail company which was established in the year
1869 by John James Sainsbury. This company deals in various products and services such as
groceries, forecourt shop, food products, etc.
Tesco plc. Was founded in the year 1919 by Jack Cohen. This company deals in various
products and services such as furniture, software, telecom services, groceries, petrol, electronics,
financial services, etc.
1. financial analysis
Profitability ratios
Gross profit ratio- It refers to the profitability ratio that depicts the relationship in
between the gross profit and the total sales revenue. This ratio is the most powerful tool that
helps in evaluating performance in relation to operational efficiency of an entity. It is been
calculated by dividing the gross profit with that of sales.
1
Document Page
Interpretation- From the table it has been analysed that the gross profit ratio of
Sainsbury's is greater than Tesco over the last 4 years. This means that Sainsbury's operations are
efficiently functioning in comparison with the Tesco and the resulting profits after the cost of
the sales is higher of the Sainsbury's. However, the ratio of the Tesco is showing an increasing
trend over the years which means that its performance is improving as the year passes.
Net profit ratio- It is the ratio that reveals the profits earned by the company after
deducting all the cost relating to production, financing and the administration which are been
subtracted from the income tax and the sales. It is the measure that is commonly plotted on the
trend line in order to judge the performance of the business over the time period. It is computed
by dividing the resulted net profit with that of net sales.
Interpretation- The above table depicts that the net profit ratio of Sainsbury's in the year
2016 and 2017 is higher than Tesco which means that after making payment of all its interest
expenses and the tax liability the former company is earnings higher profits. However, Tesco
resulted negative results or net loss in the year 2017, which reflects that its expenses and the
finance cost were more than its revenue. On the other state, in the year 2018&19, the resulted net
income of Tesco, resulted higher than Sainsbury's which clearly indicates that Tesco has taken
corrective measures for increasing its sales and the profit margins.
Liquidity ratios
2
tabler-icon-diamond-filled.svg

Paraphrase This Document

Need a fresh take? Get an instant paraphrase of this document with our AI Paraphraser
Document Page
Current ratio- It is the type of the liquidity ratio that reflects the ability of the company
in paying off its current obligations. It tells the ways that the company can uses for maximizing
its current assets for satisfying their current debts or the other payables. It is been evaluated by
subtracting the current liabilities from the current assets.
Quick ratio- This ratio indicates the current liquidity position of an organization and the
capability of an enterprise in meeting its short term liabilities by using its assets that are most
liquid. This ratio is been designed for producing the instant results. It is been computed by
dividing the quick assets with the current liabilities. Under which, the quick assets is resulted by
deducting stock and prepaid expenses if any from the current assets.
Interpretation- The table shows that for the year 2016&17, the current ratio of the Tesco
is higher than Sainsbury's but in the year 2018&19, the ratio of Sainsbury's is greater than Tesco.
This means that presently, Sainsbury's is having a better liquidity position which in turn means
that it has sufficient cash to pay off its current liabilities as compared to Tesco. Ita lso reflects
that Sainsbury's has the ability to meet its short-term obligations adequately.
3
Document Page
Interpretation- The above evaluation is been stating that as per the quick ratio, the
immediate liquid position of Tesco is better than Sainsbury's over the years as its resultant ratios
are higher when it is been compared to Sainsbury's. This indicates that Tesco has the ability to
meet its obligations by using its immediate cash.
Solvency ratios
Debt-equity ratio- It means the solvency ratio that measures the relationship in between
capital contributed by shareholders and the creditors. It depicts the extent of the shareholders
equities through which the company can fulfil its obligations towards its creditors in case of
liquidation. It is computed by dividing the long term debts with that of the shareholders funds.
Interpretation- By interpreting the above ratio it has been highlighted that lower the
ratio, better the solvency position of the enterprise. Therefore, as the debt-to-equity ratio of
Sainsbury's is resulting as lower than Tesco, this reflects that it is having adequate owners funds
from which it non-current debts can be met easily over its rivalry that is Tesco. However, ratio of
Tesco is higher which the means that the proportion of its debts are similar to that of its equities.
Efficiency ratios
4
Document Page
Stock turnover ratio- It refers to the efficiency ratio which shows that how effectively the
organization can managed its inventory in comparison with the cost of sales along with the
average stock for the specific period. It is calculated by dividing the cost of goods sold with that
of the average inventory.
Interpretation- From the above table, it has been determined that only in the year 2016,
the inventory turnover ratio of Sainsbury's is greater than Tesco else in all the other years, the
ratio of Tesco is greater than Sainsbury's. This means that Tesco has taken appropriate measures
for making efficient use and proper management of its inventory. The ratio states that Tesco has
made appropriate use of its stock in order to generate the higher sales which in turn helped it in
attaining increased profits.
Total assets turnover ratio- It measures the ability of the Tesco and the Sainsbury's in
generating the sales by using the assets and comparing the net sales with that of the average sum
of the total assets. It reflects that how efficiently the company can make use of its assets for
generating sales.
Interpretation- The computation of the ratios depicts that Sainsbury's is efficiently using
its assets in order to generate sales because it total asset turnover ratio is higher than Tesco over
the years. However, in the current year, Tesco has made effective use its assets for the purpose of
earning higher revenue by meeting the sales target.
5
tabler-icon-diamond-filled.svg

Paraphrase This Document

Need a fresh take? Get an instant paraphrase of this document with our AI Paraphraser
Document Page
Fixed asset turnover ratio- It refers to the ratio that measures the return gained by the
corporation by making the investment in the fixed assets like plant, machinery and the
equipment. It shows the efficiency of the company in producing the sales through its equipment.
Higher the ratio, the more efficient a company is in utilizing its fixed assets for generating
revenue. It is evaluated by dividing the net sales with that of the average value of the fixed
assets.
Interpretation- From the above table it has been concluded that the fixed asset turnover
ratio of Sainsbury's is greater than Tesco which clearly states that its fixed assets are more
efficient than Tesco and by making use of its fixed assets higher sales are been generated.
However, in comparison with the Sainsbury's, Tesco is not making efficient use of its assets in
order to generate the sales.
Investment ratios
Earning per share- It is the financial measure that indicates company's profitability. It is
been computed by dividing net income of the company with that its sum of the outstanding
shares. Commonly, for the company to report the earning per share is been adjusted towards the
6
Document Page
extraordinary items and the potential dilution of the shares. The greater the ratio of the EPS for
the enterprise, the firm is considered as more profitable.
Interpretation- By summing up the above table it has been interpreted that in the year
2016 and 2017, earning per share of Sainsbury's is higher than its rivalry and also Tesco resulted
negative value of earning per share as it resulted a net loss in the year 2017. This means that
Sainsbury's was earning good amount of profits per share as compared to its competitor.
Moreover, during the year 2018&19 , Tesco attained higher EPS against Sainsbury's which
means that its profit margins get better in these years.
Dividend per share- It refers to the total of the declared dividends that is been issued by
an enterprise towards each and every ordinary outstanding shares. It is computed by dividing
total dividends that are paid out of the business with inclusion of the interim dividends over the
time period by number of the outstanding shares issued. Higher ratio indicates that an entity is
paying more part of the profits to its shareholders.
Interpretation- From the ratio evaluated in the above table, it has been analysed that
dividend per share has been distributed by Sainsbury's to its shareholders in 2016 and 2017 but
as Tesco was not having profits so it doesn't distributed any dividend to its shareholder in these
years. While, for the year 2018 and 19, the amount of dividend per share that is been distributed
by Tesco was more than Sainsbury's as profits ascertained are higher.
Horizontal analysis- This technique is been used for making the analysis of the financial
statement for the purpose of comparing the historical data like ratios, line items for the
accounting periods.
7
Document Page
8
tabler-icon-diamond-filled.svg

Paraphrase This Document

Need a fresh take? Get an instant paraphrase of this document with our AI Paraphraser
Document Page
9
Document Page
Vertical analysis- It is the method that is used for analysing the financial report where each item
is been listed in terms of the percentage value of the base figure in the statement.
10
chevron_up_icon
1 out of 21
circle_padding
hide_on_mobile
zoom_out_icon
[object Object]