Financial Performance Comparison: Sainsbury's vs Tesco Analysis Report
VerifiedAdded on 2021/02/21
|15
|3807
|286
Report
AI Summary
This report offers a comparative financial analysis of Sainsbury's and Tesco, two major supermarket chains in the UK. It begins with background information on each company, including their history, market share, and objectives. The report then delves into a detailed financial analysis, examining key ratios across profitability, liquidity, solvency, efficiency, and investment metrics from 2017 to 2019. The analysis includes Gross Profit Ratio, Net Profit Ratio, Current Ratio, Quick Ratio, Debt-Equity Ratio, Inventory Turnover Ratio, Total Assets Turnover Ratio, Fixed Assets Turnover Ratio, and Earnings Per Share. The interpretation of these ratios provides insights into the financial health, performance, and management effectiveness of each company, highlighting their strengths and weaknesses over the three-year period. The report concludes with a summary of findings and a comparison of the two companies' financial positions.
Accounting and Finance
Paraphrase This Document
Need a fresh take? Get an instant paraphrase of this document with our AI Paraphraser
TABLE OF CONTENTS
INTRODUCTION...........................................................................................................................1
Company background ................................................................................................................1
Competitor's company profile-....................................................................................................2
Financial analysis of Sainsbury's and Tesco...............................................................................3
Working note:-............................................................................................................................8
CONCLUSION..............................................................................................................................11
REFERENCES..............................................................................................................................12
INTRODUCTION
Accounting and finance, both contains different meanings as accounting refers to the art
of reporting and recording the business transactions that are in monetary terms while Finance is
considered as the science in managing the funds of the business. The present study is based on
Sainsbury's, largest retailer in supermarket, in the UK. Furthermore, comparative analysis has
been made in between Sainsbury's and its competitor that is Tesco.
Company background
Sainsbury's is a second leading chain in terms of the supermarkets within the entire UK,
with having a market share of 15.3% of supermarket segment (Sainsbury's Wikipedia, 2019). It
was founded in the year 1869, by the John James. Sainsbury having the shop in the Drury Lane,
situated in London. It became the largest organization in terms of the grocery retailer during the
year 1922. This company was counted as an early adopter in context of the self-service retailing
in overall UK. The operating income of the Sainsbury' s in the year 2018 resulted as £518
million and the revenue gained from its sales was £28.45 billion (Kozubíková, Homolka and
Kristalas, 2017). It has its shop in around 1415 locations where it runs its business. The no. of
employees that are working with the company are stated as 186,900 during the year 2018. The
company deals in the Hypermarket, supermarket, superstore and the convenience shop.
The objectives, opportunities and the problems that are been faced by the firms could be
assessed through its SWOT analysis. One of the main objective of the Sainsbury's is to survive in
the competitive world by meeting the desire of all its customers so that it could achieve the
competitive edge against its competitors called as Tesco. The other objective of an entity is to
achieve increased profits by making the reinvestment of the profits into the growing sector for
becoming a best or leading marketer in supermarket segment. It also aims at providing the
sustainable and good financial returns to its shareholders (Ryan and Deci, 2017). Providing great
services with the outstanding quality to the customers is also one of the major objective of the
business. The company aims for exceeding the expectations of the customers and setting up the
promotional campaigns in order to create positioning in minds of the new as well as the existing
customers.
The strengths of the Sainsbury's helped it in reaching to its objectives effectively and
efficiently. It has automation of its activities which enables the firm in bringing out the
1
⊘ This is a preview!⊘
Do you want full access?
Subscribe today to unlock all pages.
Trusted by 1+ million students worldwide
consistency in terms of the quality within its products which in turn enhances the demand of its
product in the market (Steiss, 2019). The workforce of the company is highly skilled because it
provides proper training and the learning programs to its employees by developing the
motivation among them in achieving more. The major weaknesses or the problems that are faced
by the enterprise is attained limited success from its core business in the outside market and
requires to do more investment in the research and development projects with technological
advancements (SWOT Analysis, 2019). The company also faces problem in forecasting its
product's demand as it has missed many of the opportunities in comparison to its rivalry. The
opportunities that the entity can grab includes the new trends within the behaviour of the
consumers could be a great opportunity for Sainsbury's in respect of opening up of the new
market so that it could diversify its revenue streams by producing the new products (Gürel and
Tat, 2017). Online platform is also a larger opportunity for the company as it could attract large
customers and new channels for increasing the sales can be achieved.
Competitor's company profile-
Tesco, a multinational British groceries company, called as the retailer in the general
merchandise items, headquartered in the city called as Welwyn Garden, Hertfordshire, England,
UK. It operates as the third biggest retailer within the world in terms of its gross revenues and
ranked as the ninth largest firm in respect of its revenues. It has its outlets or shops in around 7
countries across the Asia and the Europe. It is also a market leader in dealing with the grocery
items as like Sainsbury's in entire UK (Abuhamdeh, Csikszentmihalyi and Jalal, 2015). It is
founded in the year 1919 by the founder named as Jack Cohen. The operating income of the
company in the year 2018 resulted as £ 2206 million and the net income gained amounting to £
1320 million. The total no. of employees in the company resulted as 450000 and has around
6800 shops at different locations. The revenue attained by the enterprise from its sales equated
to £ 63,911 million presently. The key people who runs and manages the company are John
Allan as Non-executive chairman and Dave Lewis as the CEO group.
The main objective of the Tesco is to become a leading retailer in the supermarket. He
other objectives of the company includes maximising the sales in order to gain larger profits and
developing a large online platform (Phadermrod, Crowder and Wills, 2019). Providing the job
to the local community and introducing the healthy and the quality products with wide range to
its customers at affordable prices. Tesco has achieved strength in terms of winning numerous
2
Paraphrase This Document
Need a fresh take? Get an instant paraphrase of this document with our AI Paraphraser
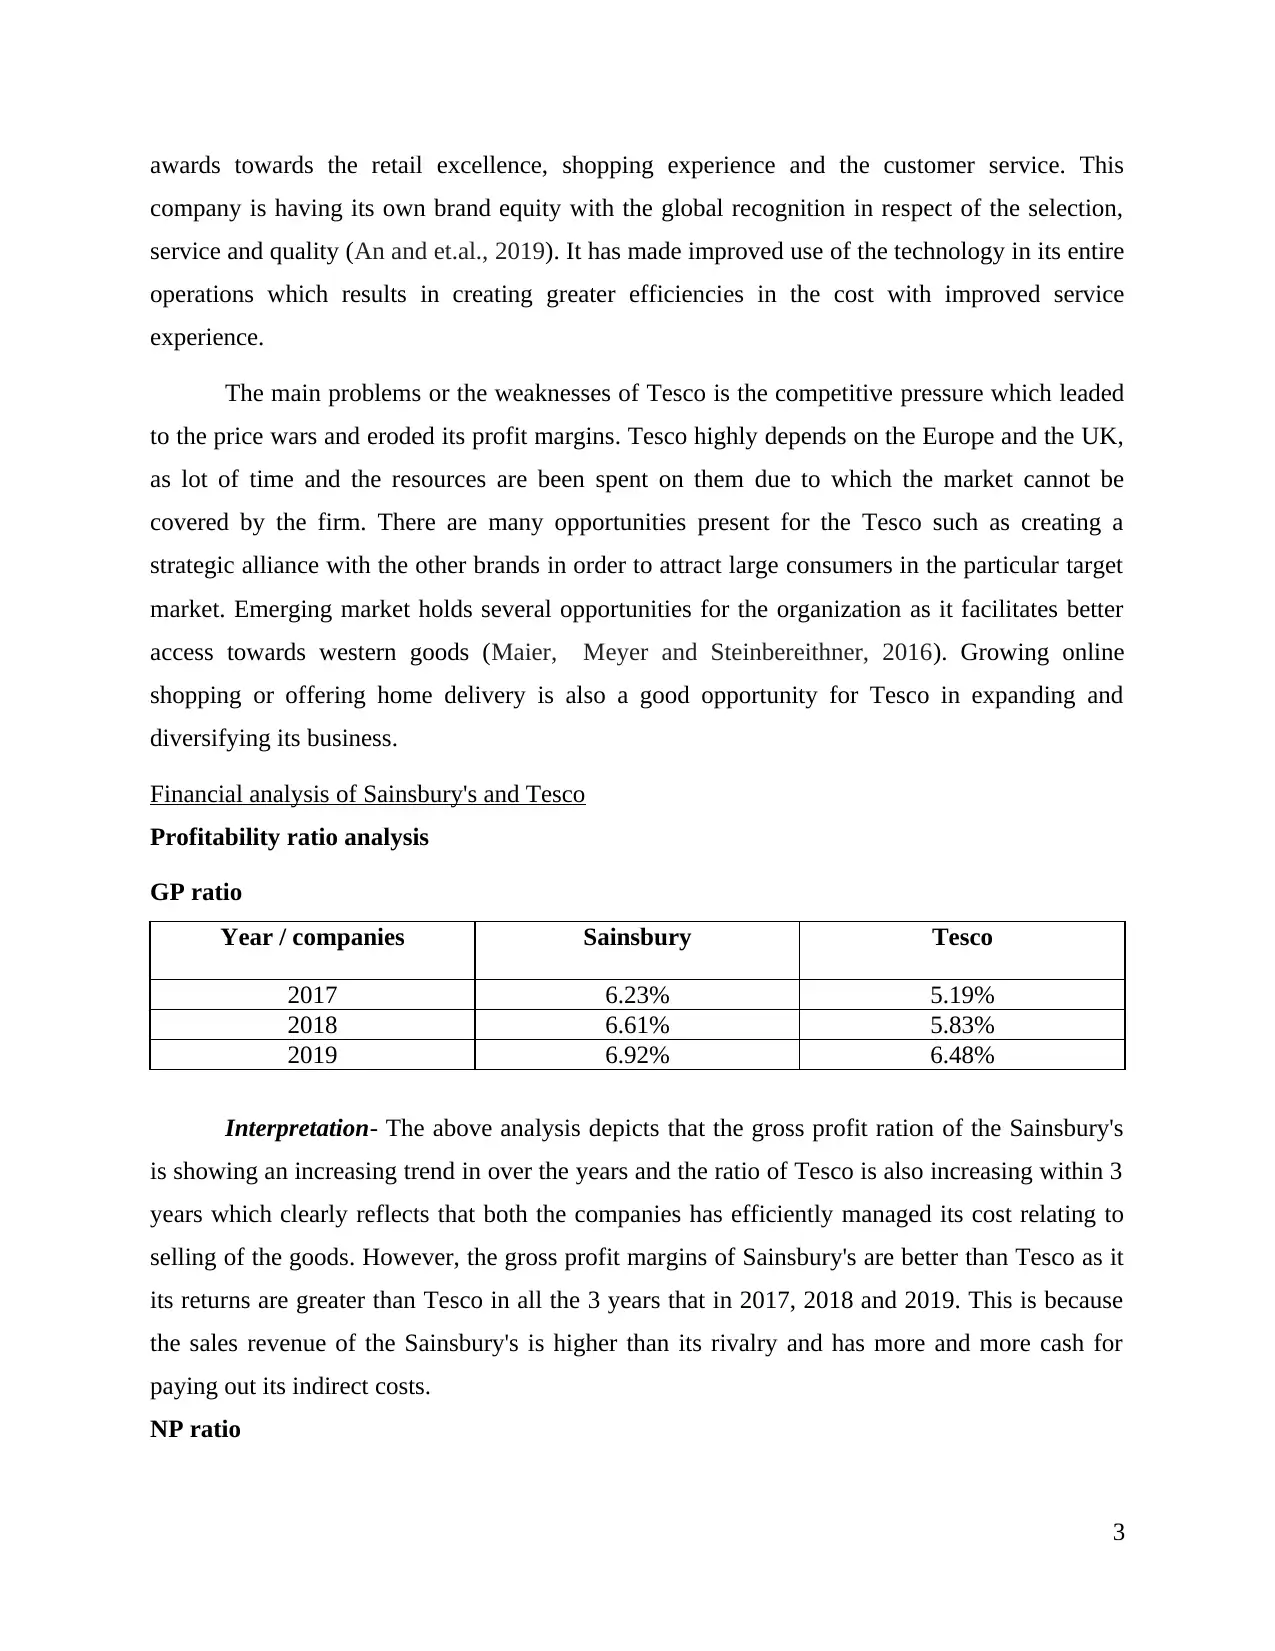
awards towards the retail excellence, shopping experience and the customer service. This
company is having its own brand equity with the global recognition in respect of the selection,
service and quality (An and et.al., 2019). It has made improved use of the technology in its entire
operations which results in creating greater efficiencies in the cost with improved service
experience.
The main problems or the weaknesses of Tesco is the competitive pressure which leaded
to the price wars and eroded its profit margins. Tesco highly depends on the Europe and the UK,
as lot of time and the resources are been spent on them due to which the market cannot be
covered by the firm. There are many opportunities present for the Tesco such as creating a
strategic alliance with the other brands in order to attract large consumers in the particular target
market. Emerging market holds several opportunities for the organization as it facilitates better
access towards western goods (Maier, Meyer and Steinbereithner, 2016). Growing online
shopping or offering home delivery is also a good opportunity for Tesco in expanding and
diversifying its business.
Financial analysis of Sainsbury's and Tesco
Profitability ratio analysis
GP ratio
Year / companies Sainsbury Tesco
2017 6.23% 5.19%
2018 6.61% 5.83%
2019 6.92% 6.48%
Interpretation- The above analysis depicts that the gross profit ration of the Sainsbury's
is showing an increasing trend in over the years and the ratio of Tesco is also increasing within 3
years which clearly reflects that both the companies has efficiently managed its cost relating to
selling of the goods. However, the gross profit margins of Sainsbury's are better than Tesco as it
its returns are greater than Tesco in all the 3 years that in 2017, 2018 and 2019. This is because
the sales revenue of the Sainsbury's is higher than its rivalry and has more and more cash for
paying out its indirect costs.
NP ratio
3
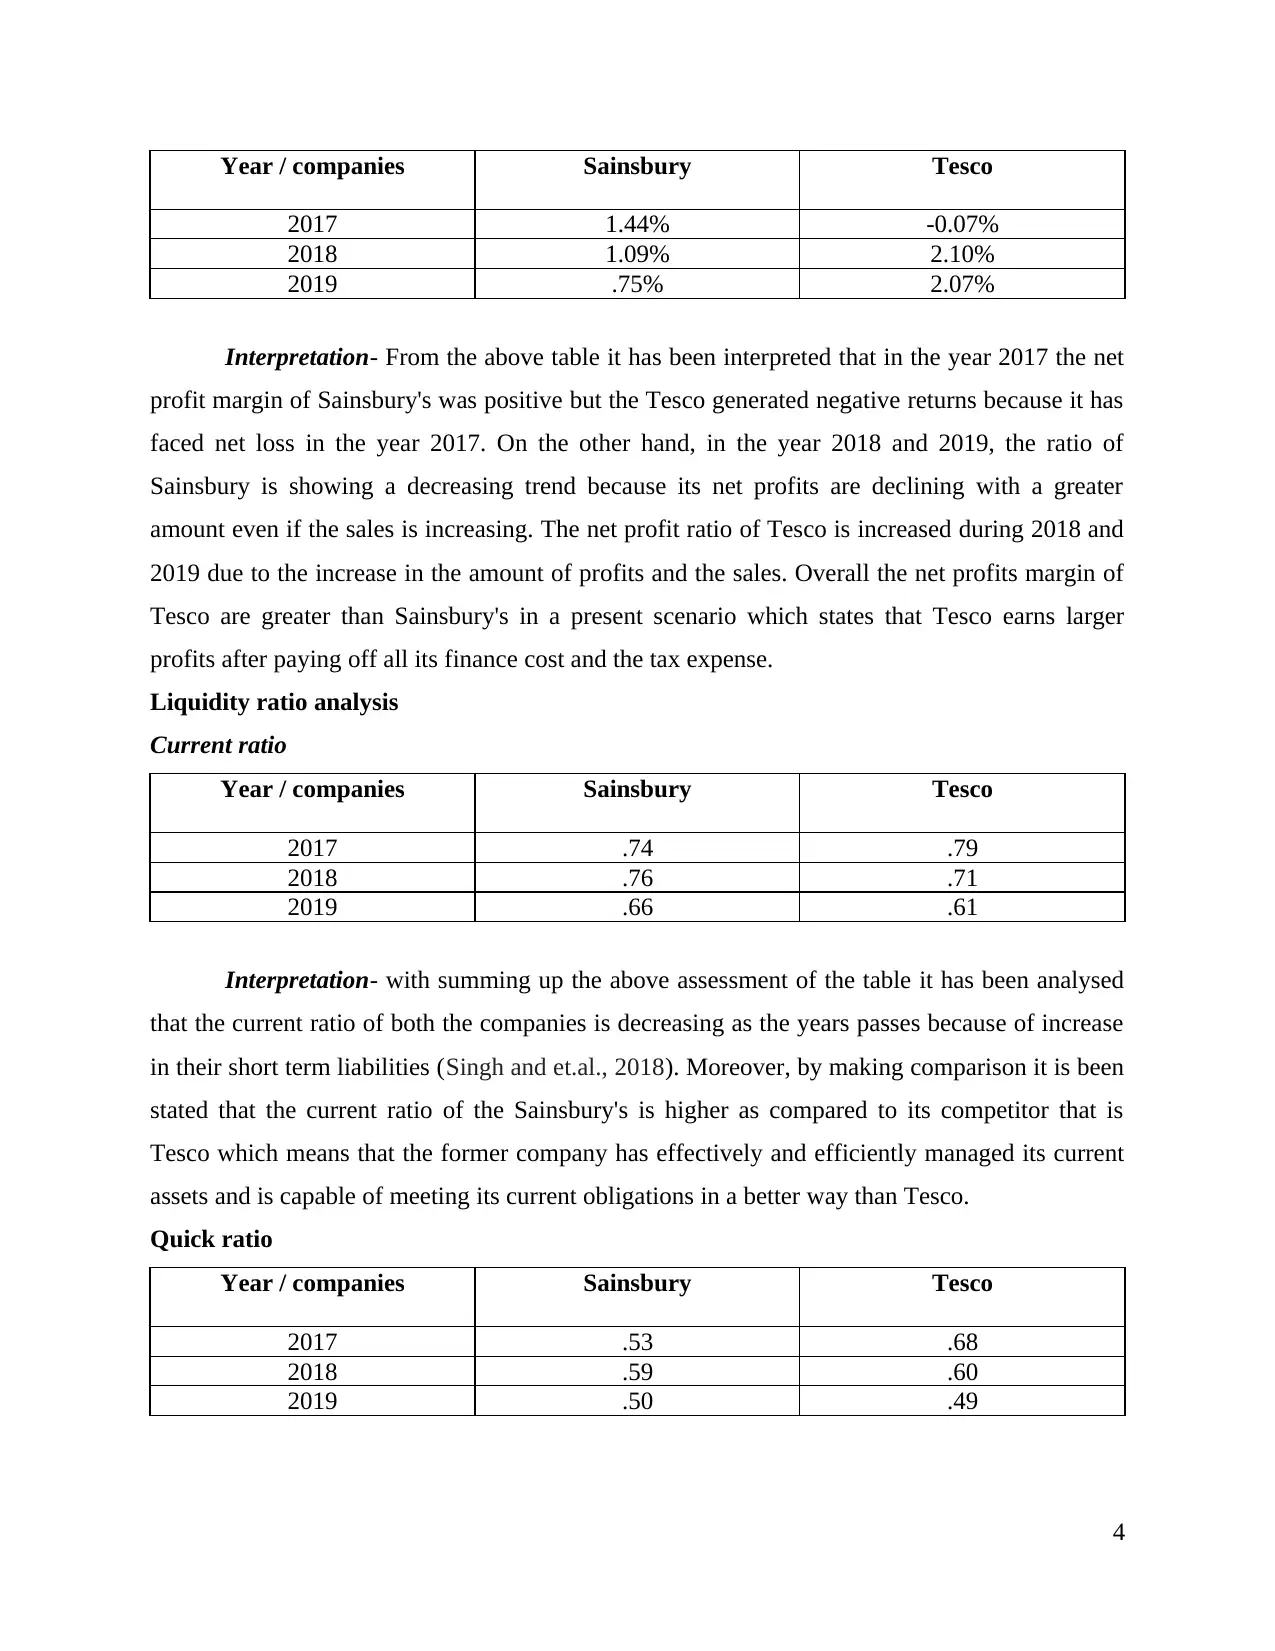
Year / companies Sainsbury Tesco
2017 1.44% -0.07%
2018 1.09% 2.10%
2019 .75% 2.07%
Interpretation- From the above table it has been interpreted that in the year 2017 the net
profit margin of Sainsbury's was positive but the Tesco generated negative returns because it has
faced net loss in the year 2017. On the other hand, in the year 2018 and 2019, the ratio of
Sainsbury is showing a decreasing trend because its net profits are declining with a greater
amount even if the sales is increasing. The net profit ratio of Tesco is increased during 2018 and
2019 due to the increase in the amount of profits and the sales. Overall the net profits margin of
Tesco are greater than Sainsbury's in a present scenario which states that Tesco earns larger
profits after paying off all its finance cost and the tax expense.
Liquidity ratio analysis
Current ratio
Year / companies Sainsbury Tesco
2017 .74 .79
2018 .76 .71
2019 .66 .61
Interpretation- with summing up the above assessment of the table it has been analysed
that the current ratio of both the companies is decreasing as the years passes because of increase
in their short term liabilities (Singh and et.al., 2018). Moreover, by making comparison it is been
stated that the current ratio of the Sainsbury's is higher as compared to its competitor that is
Tesco which means that the former company has effectively and efficiently managed its current
assets and is capable of meeting its current obligations in a better way than Tesco.
Quick ratio
Year / companies Sainsbury Tesco
2017 .53 .68
2018 .59 .60
2019 .50 .49
4
⊘ This is a preview!⊘
Do you want full access?
Subscribe today to unlock all pages.
Trusted by 1+ million students worldwide
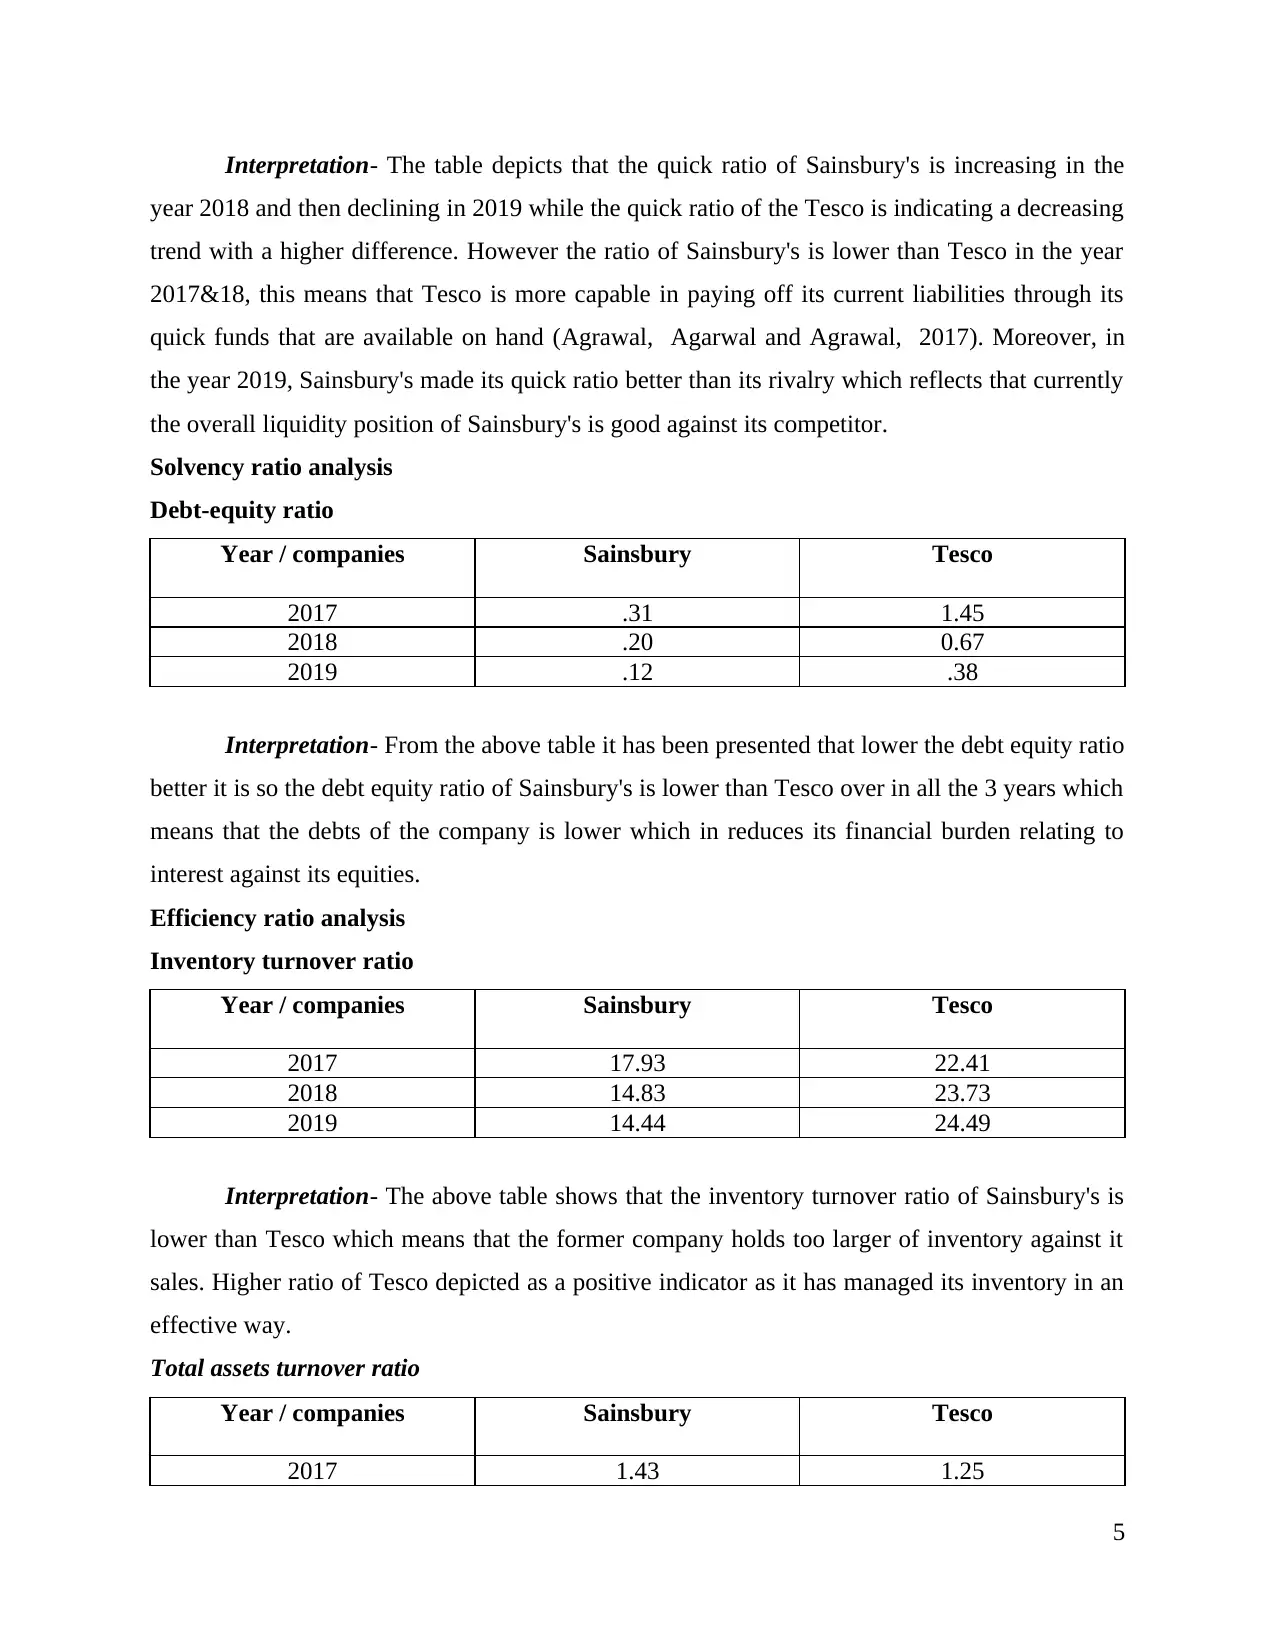
Interpretation- The table depicts that the quick ratio of Sainsbury's is increasing in the
year 2018 and then declining in 2019 while the quick ratio of the Tesco is indicating a decreasing
trend with a higher difference. However the ratio of Sainsbury's is lower than Tesco in the year
2017&18, this means that Tesco is more capable in paying off its current liabilities through its
quick funds that are available on hand (Agrawal, Agarwal and Agrawal, 2017). Moreover, in
the year 2019, Sainsbury's made its quick ratio better than its rivalry which reflects that currently
the overall liquidity position of Sainsbury's is good against its competitor.
Solvency ratio analysis
Debt-equity ratio
Year / companies Sainsbury Tesco
2017 .31 1.45
2018 .20 0.67
2019 .12 .38
Interpretation- From the above table it has been presented that lower the debt equity ratio
better it is so the debt equity ratio of Sainsbury's is lower than Tesco over in all the 3 years which
means that the debts of the company is lower which in reduces its financial burden relating to
interest against its equities.
Efficiency ratio analysis
Inventory turnover ratio
Year / companies Sainsbury Tesco
2017 17.93 22.41
2018 14.83 23.73
2019 14.44 24.49
Interpretation- The above table shows that the inventory turnover ratio of Sainsbury's is
lower than Tesco which means that the former company holds too larger of inventory against it
sales. Higher ratio of Tesco depicted as a positive indicator as it has managed its inventory in an
effective way.
Total assets turnover ratio
Year / companies Sainsbury Tesco
2017 1.43 1.25
5
Paraphrase This Document
Need a fresh take? Get an instant paraphrase of this document with our AI Paraphraser
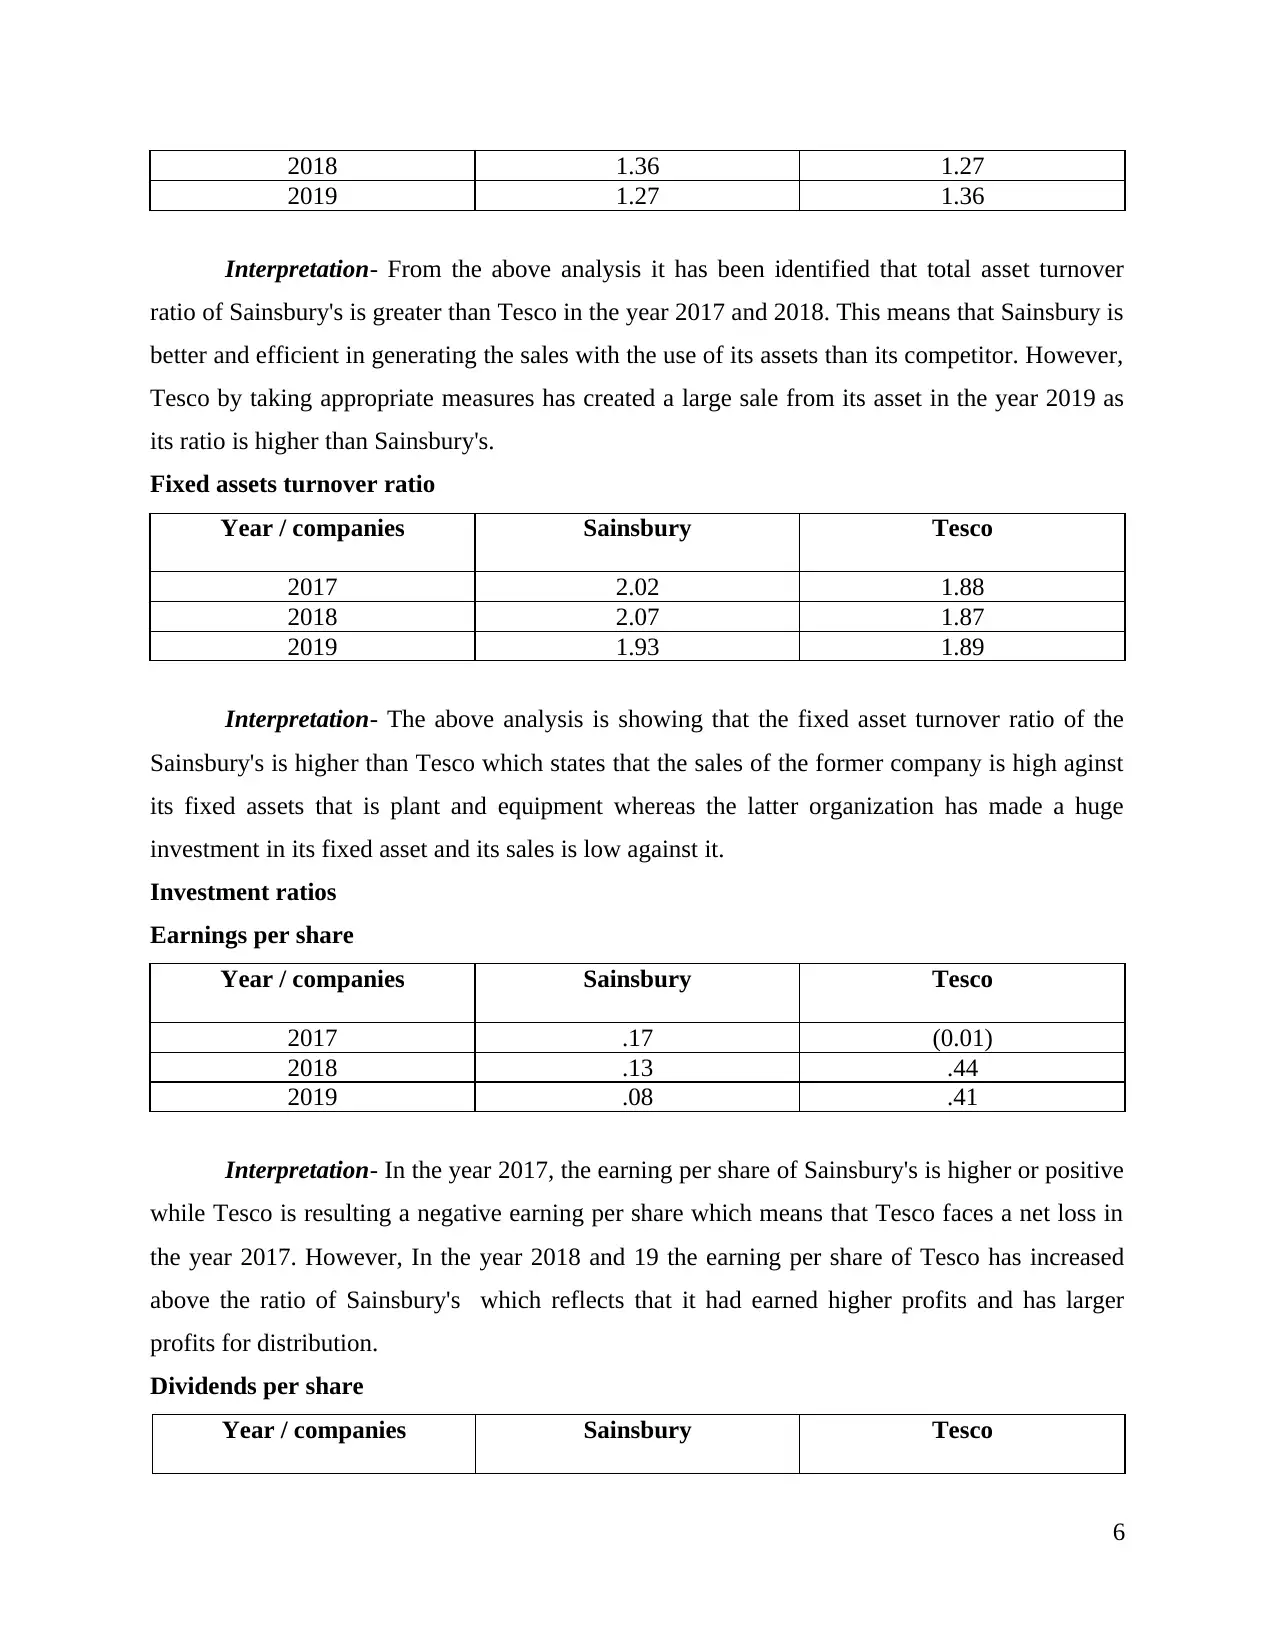
2018 1.36 1.27
2019 1.27 1.36
Interpretation- From the above analysis it has been identified that total asset turnover
ratio of Sainsbury's is greater than Tesco in the year 2017 and 2018. This means that Sainsbury is
better and efficient in generating the sales with the use of its assets than its competitor. However,
Tesco by taking appropriate measures has created a large sale from its asset in the year 2019 as
its ratio is higher than Sainsbury's.
Fixed assets turnover ratio
Year / companies Sainsbury Tesco
2017 2.02 1.88
2018 2.07 1.87
2019 1.93 1.89
Interpretation- The above analysis is showing that the fixed asset turnover ratio of the
Sainsbury's is higher than Tesco which states that the sales of the former company is high aginst
its fixed assets that is plant and equipment whereas the latter organization has made a huge
investment in its fixed asset and its sales is low against it.
Investment ratios
Earnings per share
Year / companies Sainsbury Tesco
2017 .17 (0.01)
2018 .13 .44
2019 .08 .41
Interpretation- In the year 2017, the earning per share of Sainsbury's is higher or positive
while Tesco is resulting a negative earning per share which means that Tesco faces a net loss in
the year 2017. However, In the year 2018 and 19 the earning per share of Tesco has increased
above the ratio of Sainsbury's which reflects that it had earned higher profits and has larger
profits for distribution.
Dividends per share
Year / companies Sainsbury Tesco
6
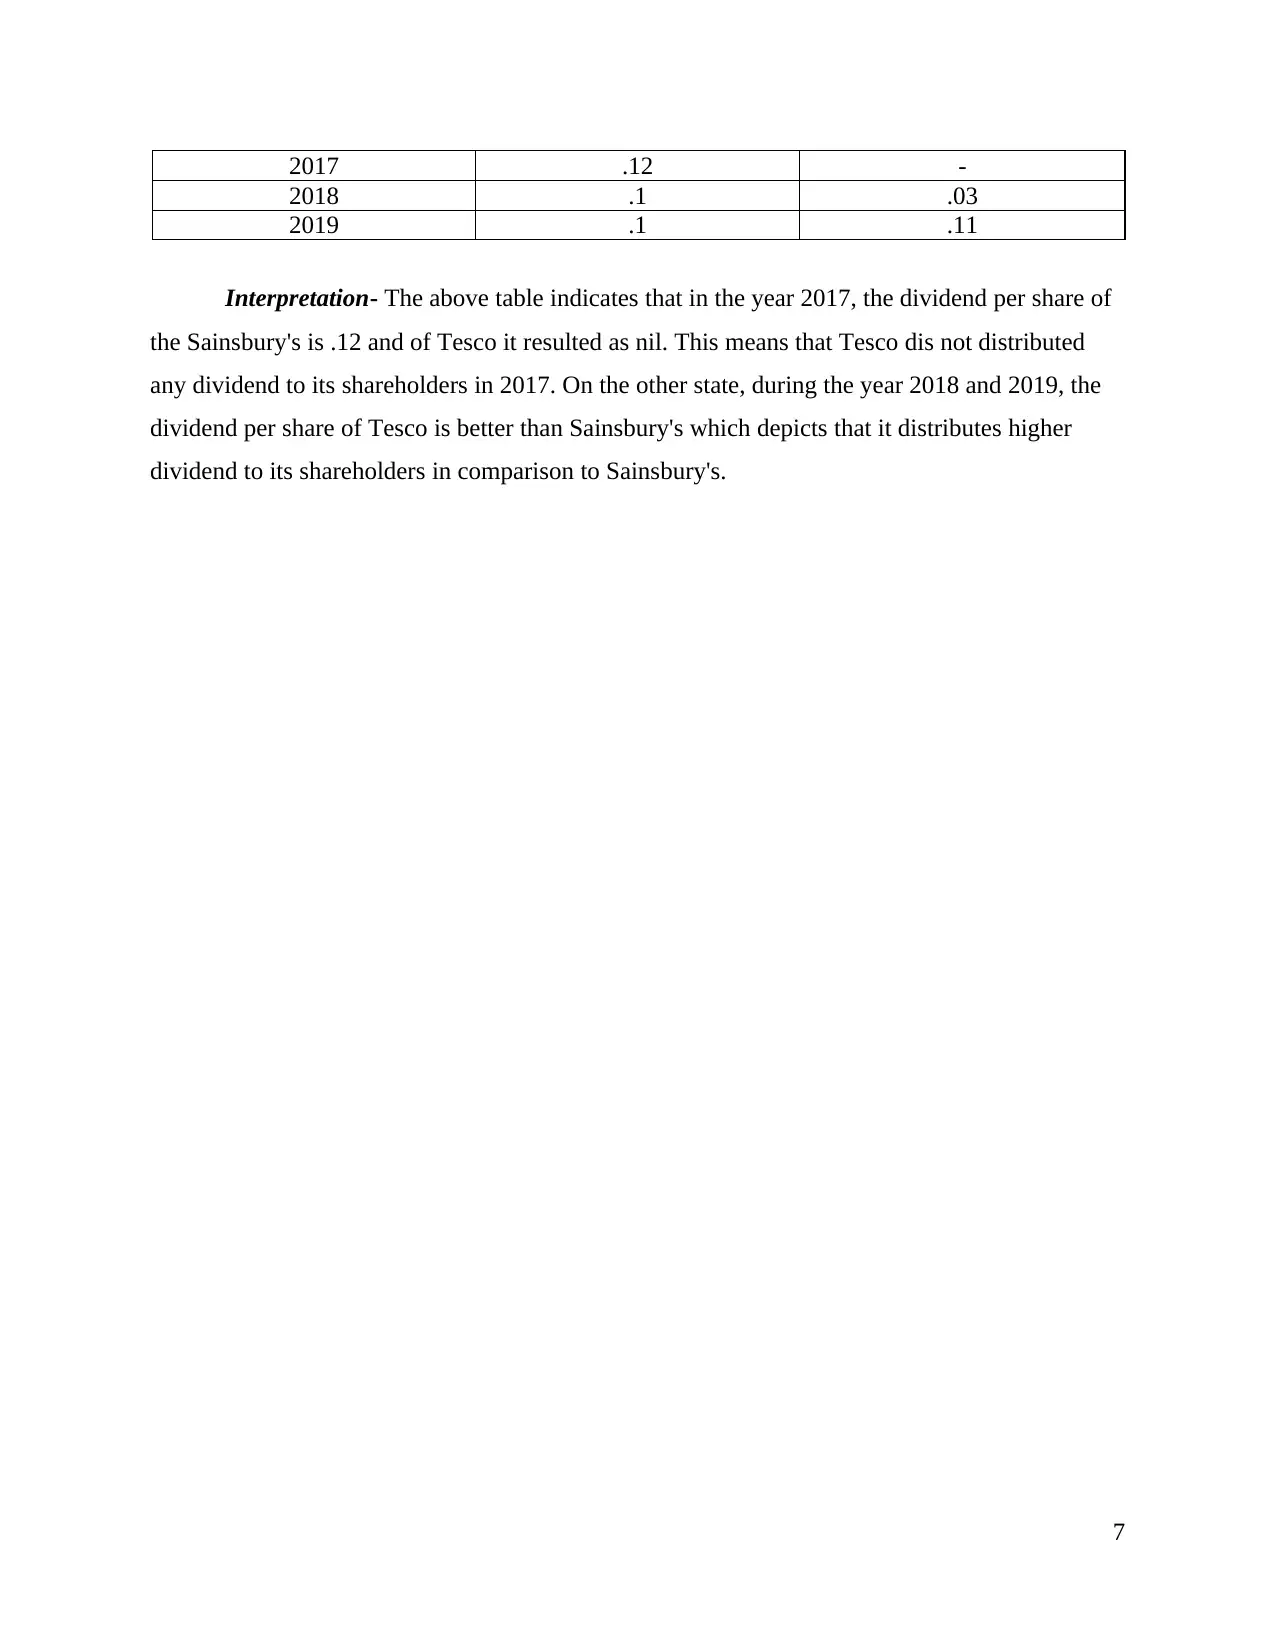
2017 .12 -
2018 .1 .03
2019 .1 .11
Interpretation- The above table indicates that in the year 2017, the dividend per share of
the Sainsbury's is .12 and of Tesco it resulted as nil. This means that Tesco dis not distributed
any dividend to its shareholders in 2017. On the other state, during the year 2018 and 2019, the
dividend per share of Tesco is better than Sainsbury's which depicts that it distributes higher
dividend to its shareholders in comparison to Sainsbury's.
7
⊘ This is a preview!⊘
Do you want full access?
Subscribe today to unlock all pages.
Trusted by 1+ million students worldwide
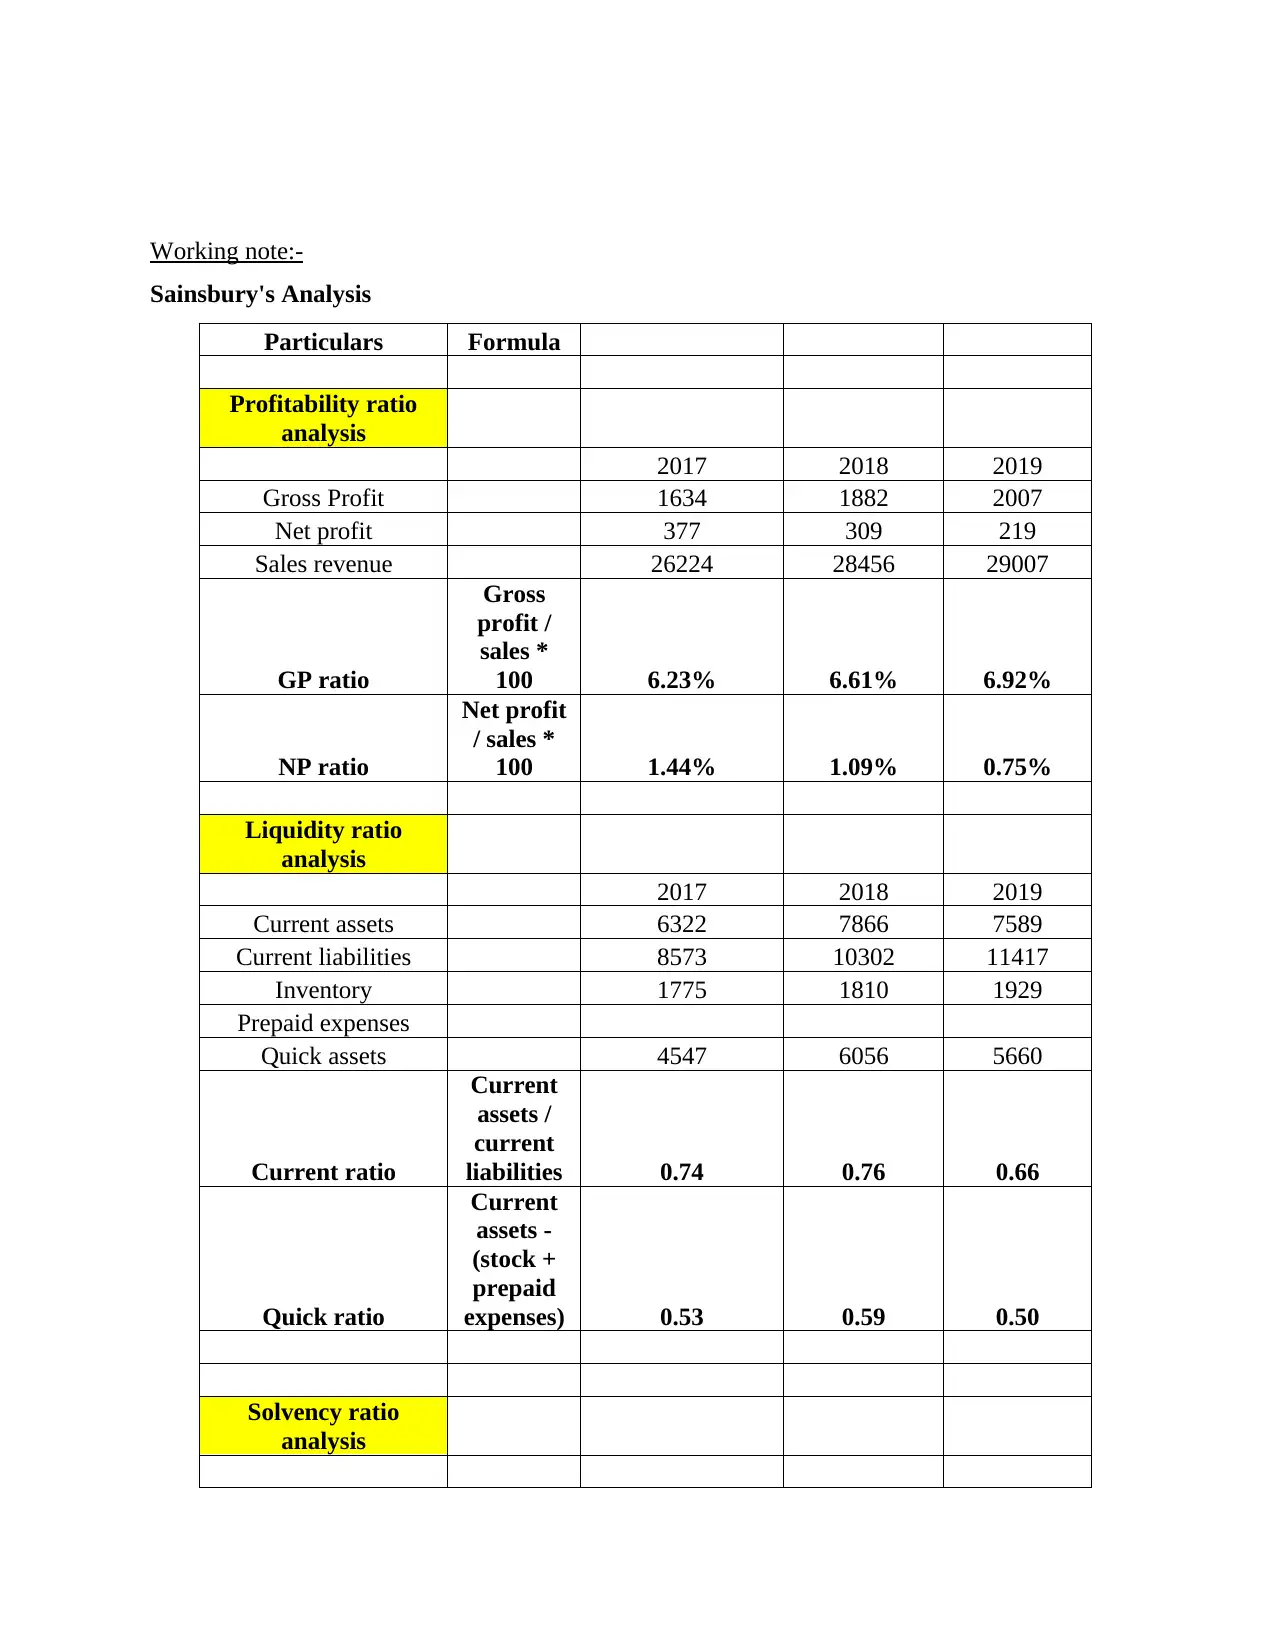
Working note:-
Sainsbury's Analysis
Particulars Formula
Profitability ratio
analysis
2017 2018 2019
Gross Profit 1634 1882 2007
Net profit 377 309 219
Sales revenue 26224 28456 29007
GP ratio
Gross
profit /
sales *
100 6.23% 6.61% 6.92%
NP ratio
Net profit
/ sales *
100 1.44% 1.09% 0.75%
Liquidity ratio
analysis
2017 2018 2019
Current assets 6322 7866 7589
Current liabilities 8573 10302 11417
Inventory 1775 1810 1929
Prepaid expenses
Quick assets 4547 6056 5660
Current ratio
Current
assets /
current
liabilities 0.74 0.76 0.66
Quick ratio
Current
assets -
(stock +
prepaid
expenses) 0.53 0.59 0.50
Solvency ratio
analysis
Paraphrase This Document
Need a fresh take? Get an instant paraphrase of this document with our AI Paraphraser
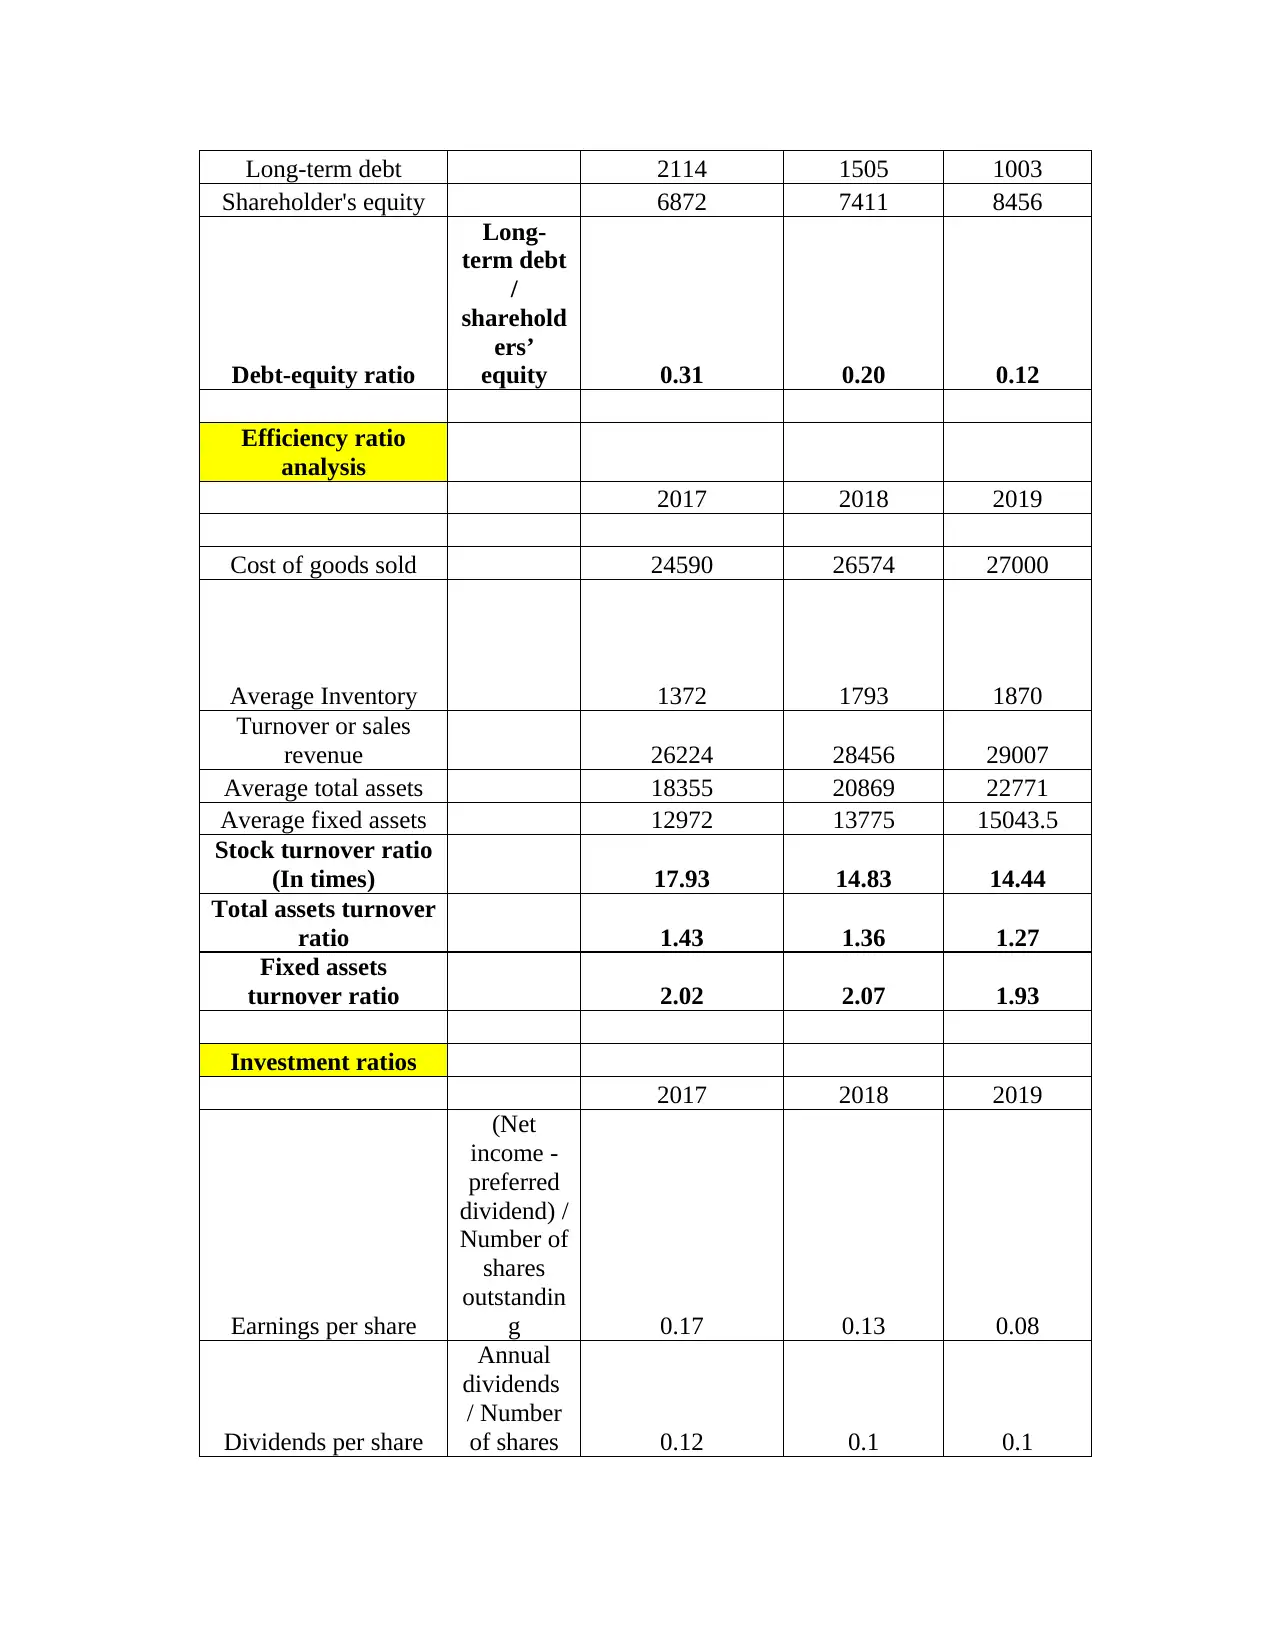
Long-term debt 2114 1505 1003
Shareholder's equity 6872 7411 8456
Debt-equity ratio
Long-
term debt
/
sharehold
ers’
equity 0.31 0.20 0.12
Efficiency ratio
analysis
2017 2018 2019
Cost of goods sold 24590 26574 27000
Average Inventory 1372 1793 1870
Turnover or sales
revenue 26224 28456 29007
Average total assets 18355 20869 22771
Average fixed assets 12972 13775 15043.5
Stock turnover ratio
(In times) 17.93 14.83 14.44
Total assets turnover
ratio 1.43 1.36 1.27
Fixed assets
turnover ratio 2.02 2.07 1.93
Investment ratios
2017 2018 2019
Earnings per share
(Net
income -
preferred
dividend) /
Number of
shares
outstandin
g 0.17 0.13 0.08
Dividends per share
Annual
dividends
/ Number
of shares 0.12 0.1 0.1
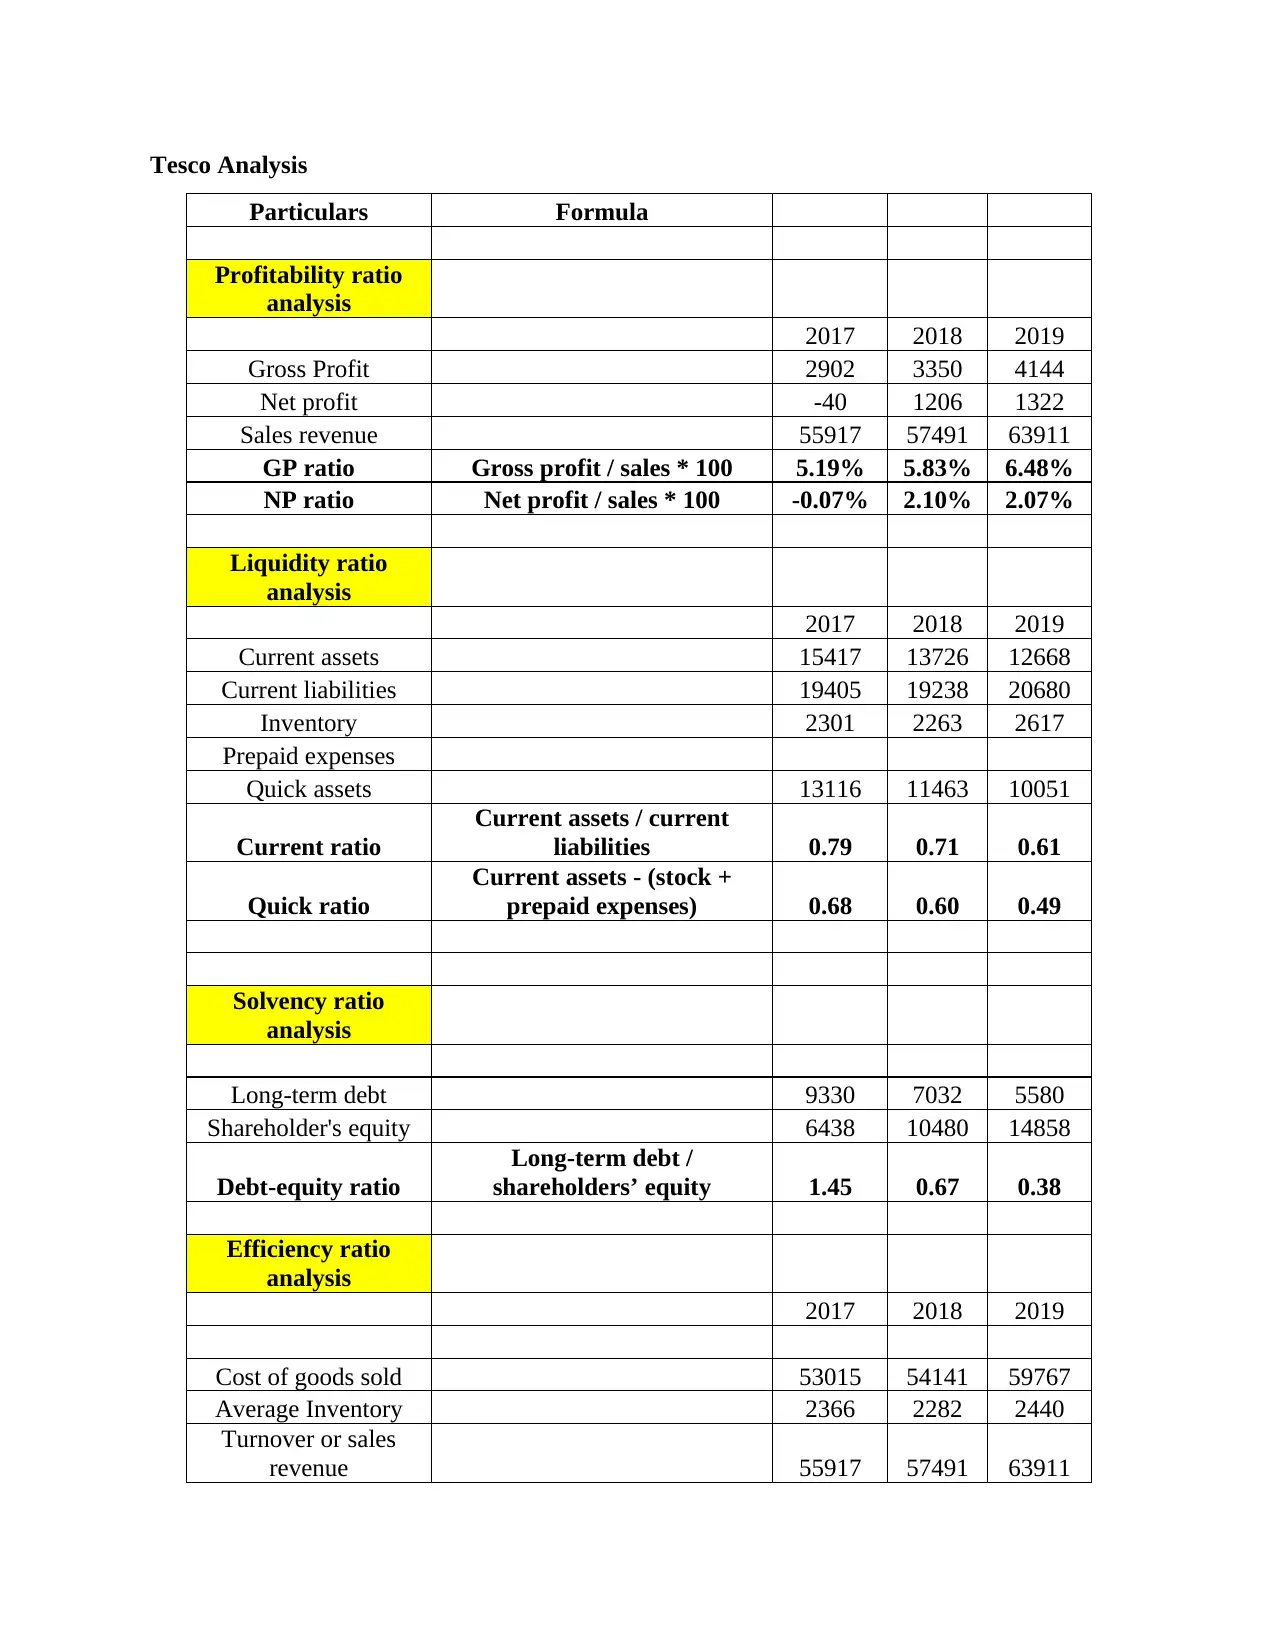
Tesco Analysis
Particulars Formula
Profitability ratio
analysis
2017 2018 2019
Gross Profit 2902 3350 4144
Net profit -40 1206 1322
Sales revenue 55917 57491 63911
GP ratio Gross profit / sales * 100 5.19% 5.83% 6.48%
NP ratio Net profit / sales * 100 -0.07% 2.10% 2.07%
Liquidity ratio
analysis
2017 2018 2019
Current assets 15417 13726 12668
Current liabilities 19405 19238 20680
Inventory 2301 2263 2617
Prepaid expenses
Quick assets 13116 11463 10051
Current ratio
Current assets / current
liabilities 0.79 0.71 0.61
Quick ratio
Current assets - (stock +
prepaid expenses) 0.68 0.60 0.49
Solvency ratio
analysis
Long-term debt 9330 7032 5580
Shareholder's equity 6438 10480 14858
Debt-equity ratio
Long-term debt /
shareholders’ equity 1.45 0.67 0.38
Efficiency ratio
analysis
2017 2018 2019
Cost of goods sold 53015 54141 59767
Average Inventory 2366 2282 2440
Turnover or sales
revenue 55917 57491 63911
⊘ This is a preview!⊘
Do you want full access?
Subscribe today to unlock all pages.
Trusted by 1+ million students worldwide
1 out of 15
Related Documents


Your All-in-One AI-Powered Toolkit for Academic Success.
+13062052269
info@desklib.com
Available 24*7 on WhatsApp / Email
![[object Object]](/_next/static/media/star-bottom.7253800d.svg)
Unlock your academic potential
Copyright © 2020–2026 A2Z Services. All Rights Reserved. Developed and managed by ZUCOL.