Managerial Finance Report: Ratio Analysis and Investment Appraisal
VerifiedAdded on 2022/12/30
|18
|3910
|1
Report
AI Summary
This managerial finance report delves into the financial performance of Sainsbury's and Tesco, two major UK supermarket competitors. It begins with an introduction to managerial finance, emphasizing its role in evaluating company financial health and investment potential. The report is divided into two portfolios. Portfolio 1 conducts a detailed financial analysis using various ratios (current, quick, net profit margin, gross profit margin, gearing, P/E ratio, return on capital employed, inventory turnover, and dividend payout) for both companies across two years, followed by an interpretation of the ratios, recommendations for poorly performing businesses, and a discussion of the limitations of financial ratios. Portfolio 2 focuses on capital investment appraisal, applying techniques like Net Present Value (NPV) to determine the best investment project. The report provides detailed calculations and analysis to guide managerial decision-making, making it a comprehensive resource for understanding financial analysis and investment strategies.

MANAGERIAL FINANCE
Paraphrase This Document
Need a fresh take? Get an instant paraphrase of this document with our AI Paraphraser
TABLE OF CONTENTS
INTRODUCTION...........................................................................................................................1
MAIN BODY...................................................................................................................................1
Portfolio 1:.......................................................................................................................................1
a. Ratios of Sainsbury's and Tesco ..............................................................................................1
b. Interpretation of ratios of Sainsbury's and Tesco:...................................................................4
c. Recommendations to poorly performing business for improving performance and financial
position.........................................................................................................................................6
d. Limitations of financial ratios in determining company's performance..................................7
Portfolio 2: ......................................................................................................................................8
Capital Investment Appraisal.......................................................................................................8
CONCLUSION..............................................................................................................................13
REFERENCES..............................................................................................................................14
Books and Journals....................................................................................................................14
Online.........................................................................................................................................15
INTRODUCTION
Managerial finance is the most important subject of finance which include various financial
functions performed by the management of the company in carrying out their financial manager's
role. Finance is considered to be the blood of every and the decision regarding the same require a
high level of managerial expertise (De Souza and Lunkes, 20160. The present report includes
various financial techniques of usually incorporated in the course of evaluating financial position
and performance of the companies. The first portfolio of this report is all about financial analysis
by the potential investors in order to analyse performance, financial position and investment
potentiality of Tesco and Sainsbury's with the help of various financial ratios. Both the
companies are competitors of each other in the UK' supermarket industry. The second part is all
about investment in capital assets which require clear suggestions and recommendations to
managers and for this they resort to some investment appraisal techniques. These techniques
provide them with clear guidance about various available alternatives in terms of their future
profitability.
MAIN BODY
Portfolio 1:
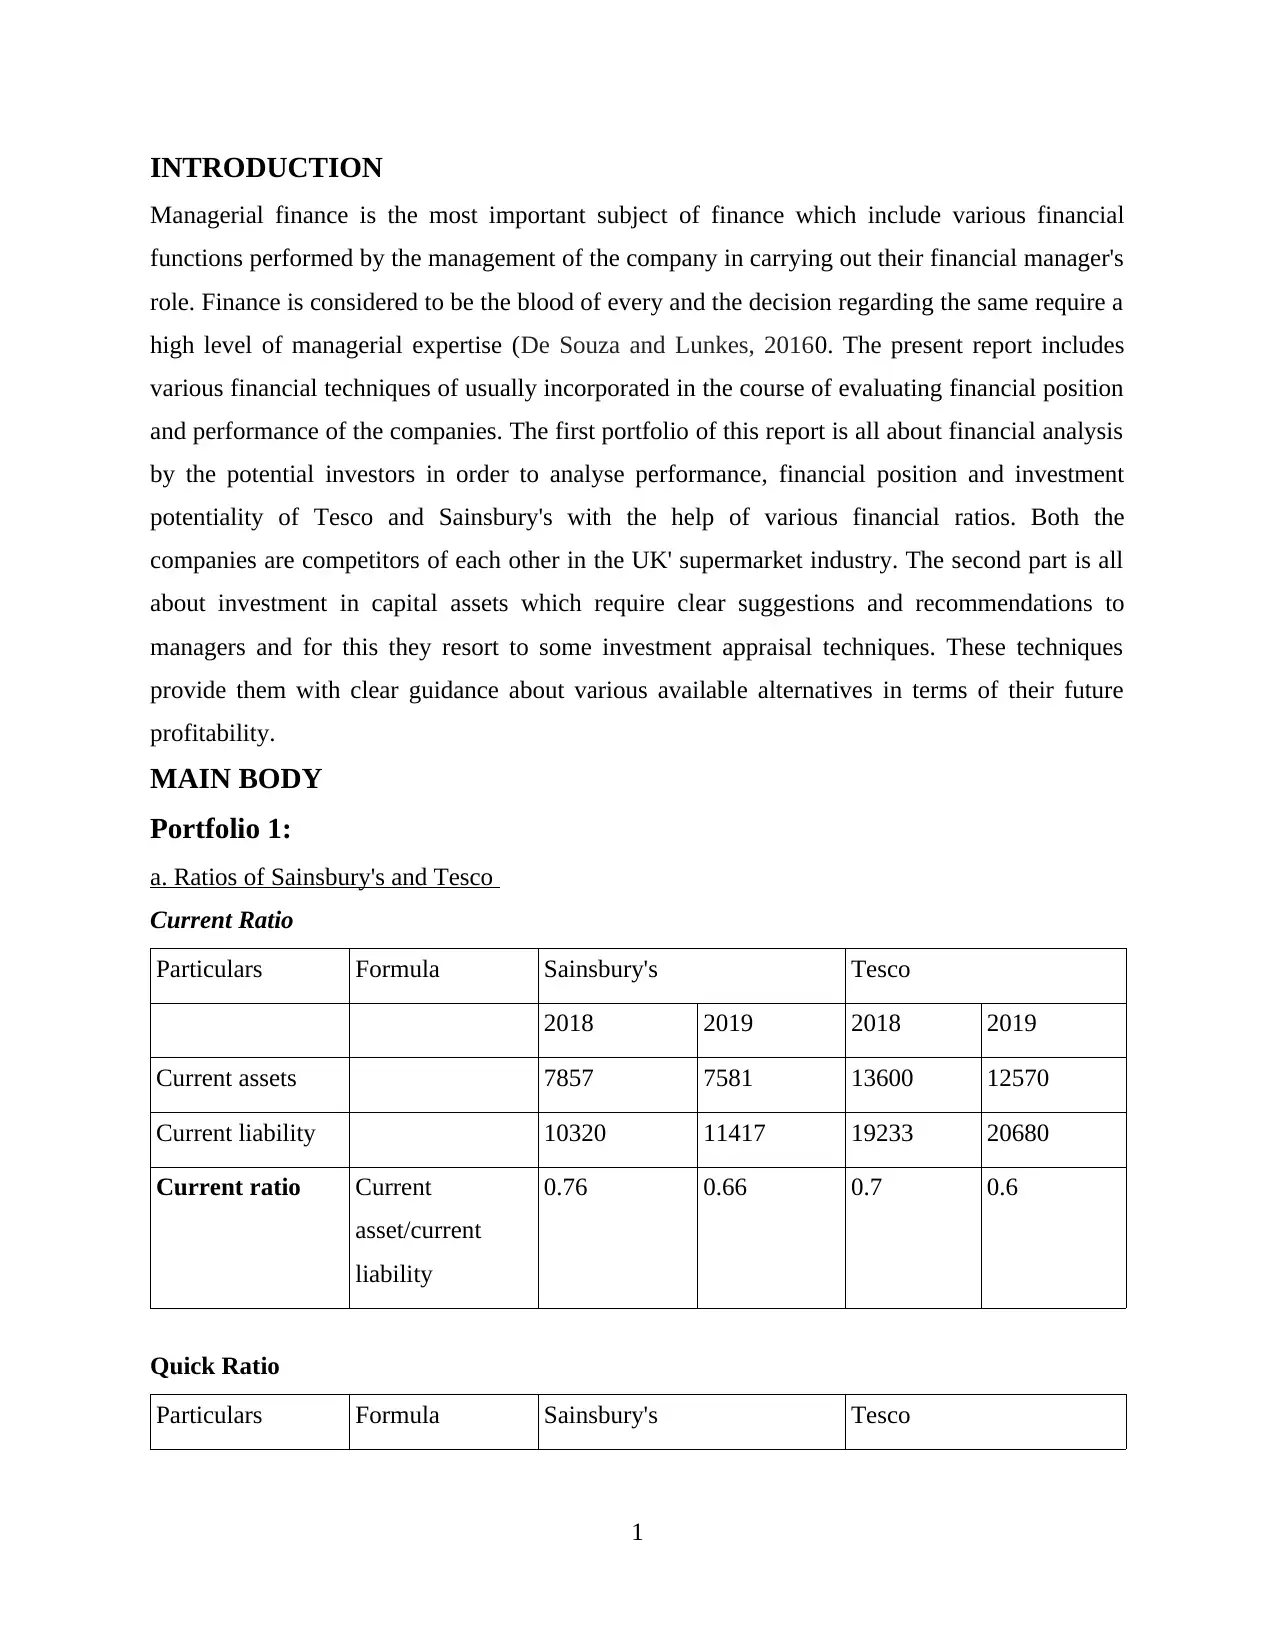
a. Ratios of Sainsbury's and Tesco
Current Ratio
Particulars Formula Sainsbury's Tesco
2018 2019 2018 2019
Current assets 7857 7581 13600 12570
Current liability 10320 11417 19233 20680
Current ratio Current
asset/current
liability
0.76 0.66 0.7 0.6
Quick Ratio
Particulars Formula Sainsbury's Tesco
1
Managerial finance is the most important subject of finance which include various financial
functions performed by the management of the company in carrying out their financial manager's
role. Finance is considered to be the blood of every and the decision regarding the same require a
high level of managerial expertise (De Souza and Lunkes, 20160. The present report includes
various financial techniques of usually incorporated in the course of evaluating financial position
and performance of the companies. The first portfolio of this report is all about financial analysis
by the potential investors in order to analyse performance, financial position and investment
potentiality of Tesco and Sainsbury's with the help of various financial ratios. Both the
companies are competitors of each other in the UK' supermarket industry. The second part is all
about investment in capital assets which require clear suggestions and recommendations to
managers and for this they resort to some investment appraisal techniques. These techniques
provide them with clear guidance about various available alternatives in terms of their future
profitability.
MAIN BODY
Portfolio 1:
a. Ratios of Sainsbury's and Tesco
Current Ratio
Particulars Formula Sainsbury's Tesco
2018 2019 2018 2019
Current assets 7857 7581 13600 12570
Current liability 10320 11417 19233 20680
Current ratio Current
asset/current
liability
0.76 0.66 0.7 0.6
Quick Ratio
Particulars Formula Sainsbury's Tesco
1
⊘ This is a preview!⊘
Do you want full access?
Subscribe today to unlock all pages.
Trusted by 1+ million students worldwide
2018 2019 2018 2019
Quick Assets 5303 4991 9832 9313
Current liability 10320 11417 19233 20680
Quick Ratio Quick
assets/current
liability
0.51 0.43 0.51 0.4
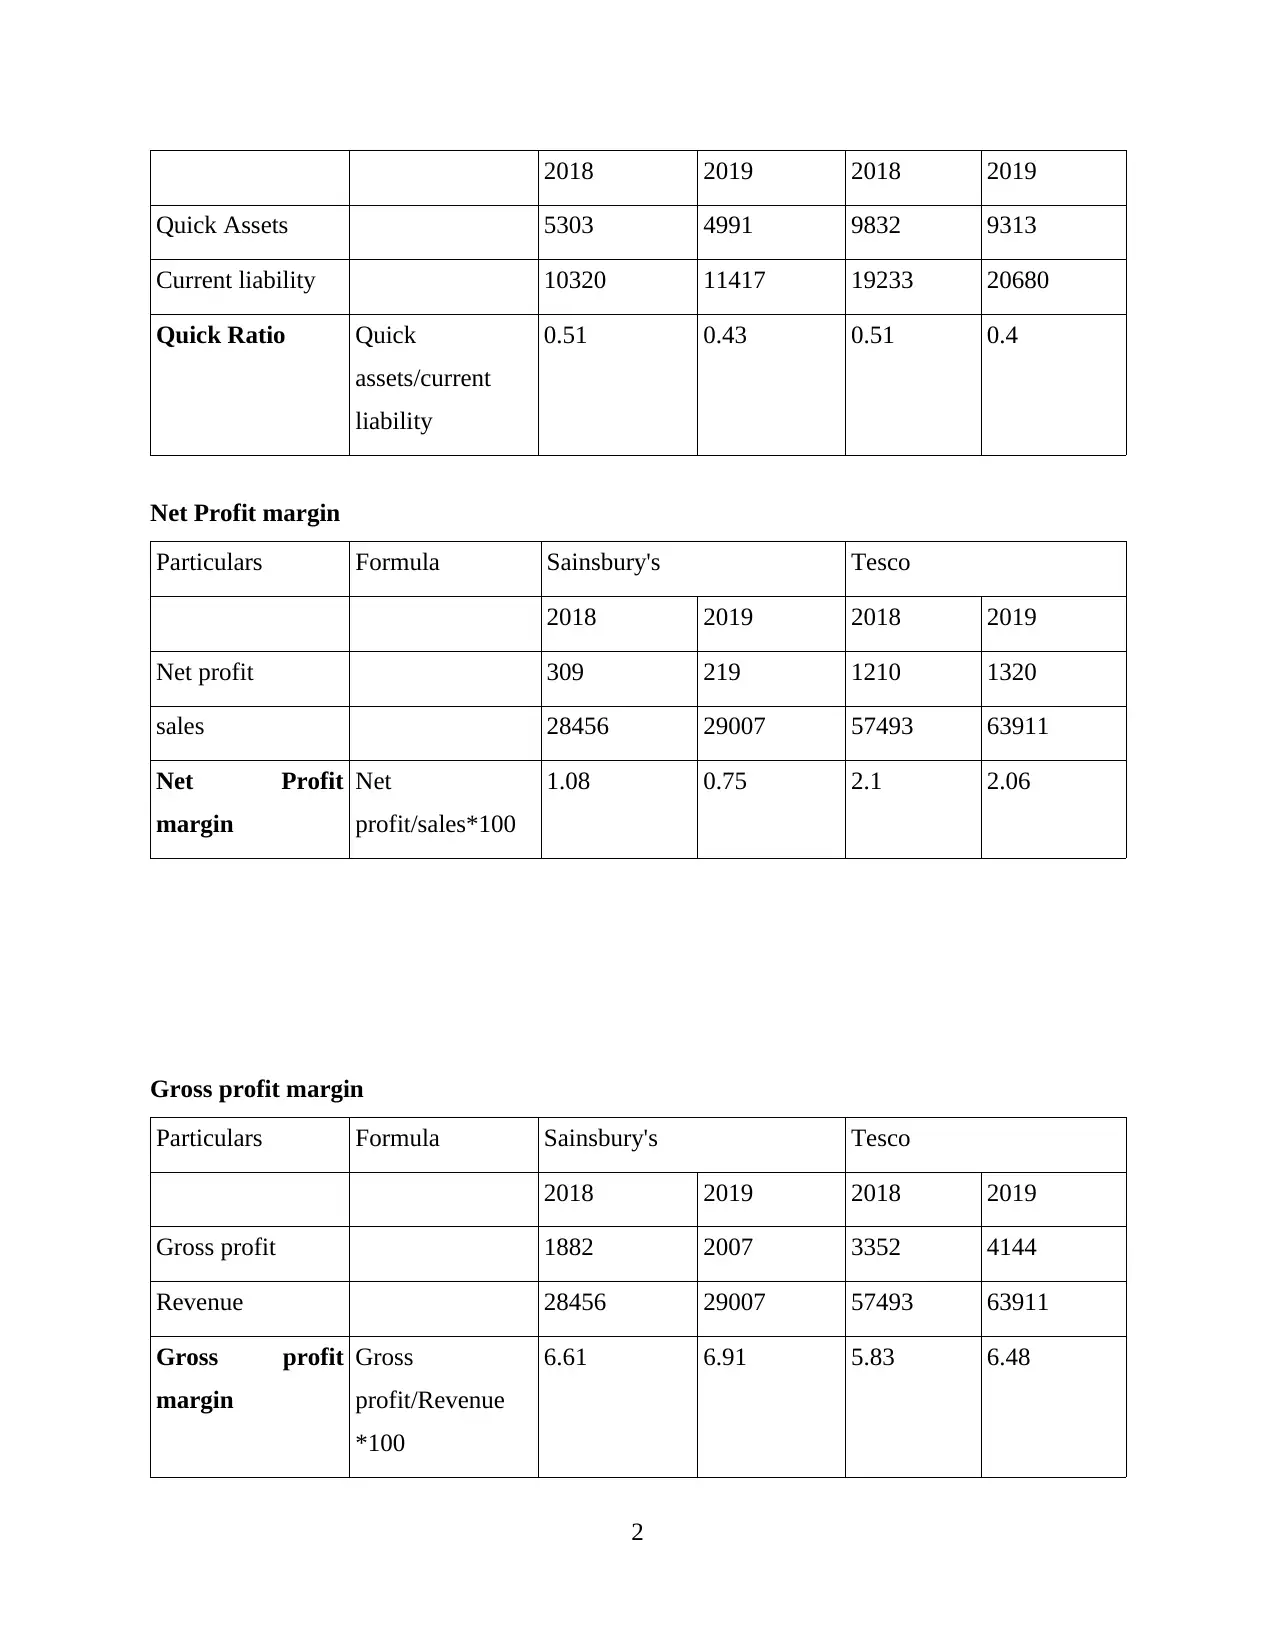
Net Profit margin
Particulars Formula Sainsbury's Tesco
2018 2019 2018 2019
Net profit 309 219 1210 1320
sales 28456 29007 57493 63911
Net Profit
margin
Net
profit/sales*100
1.08 0.75 2.1 2.06
Gross profit margin
Particulars Formula Sainsbury's Tesco
2018 2019 2018 2019
Gross profit 1882 2007 3352 4144
Revenue 28456 29007 57493 63911
Gross profit
margin
Gross
profit/Revenue
*100
6.61 6.91 5.83 6.48
2
Quick Assets 5303 4991 9832 9313
Current liability 10320 11417 19233 20680
Quick Ratio Quick
assets/current
liability
0.51 0.43 0.51 0.4
Net Profit margin
Particulars Formula Sainsbury's Tesco
2018 2019 2018 2019
Net profit 309 219 1210 1320
sales 28456 29007 57493 63911
Net Profit
margin
Net
profit/sales*100
1.08 0.75 2.1 2.06
Gross profit margin
Particulars Formula Sainsbury's Tesco
2018 2019 2018 2019
Gross profit 1882 2007 3352 4144
Revenue 28456 29007 57493 63911
Gross profit
margin
Gross
profit/Revenue
*100
6.61 6.91 5.83 6.48
2
Paraphrase This Document
Need a fresh take? Get an instant paraphrase of this document with our AI Paraphraser
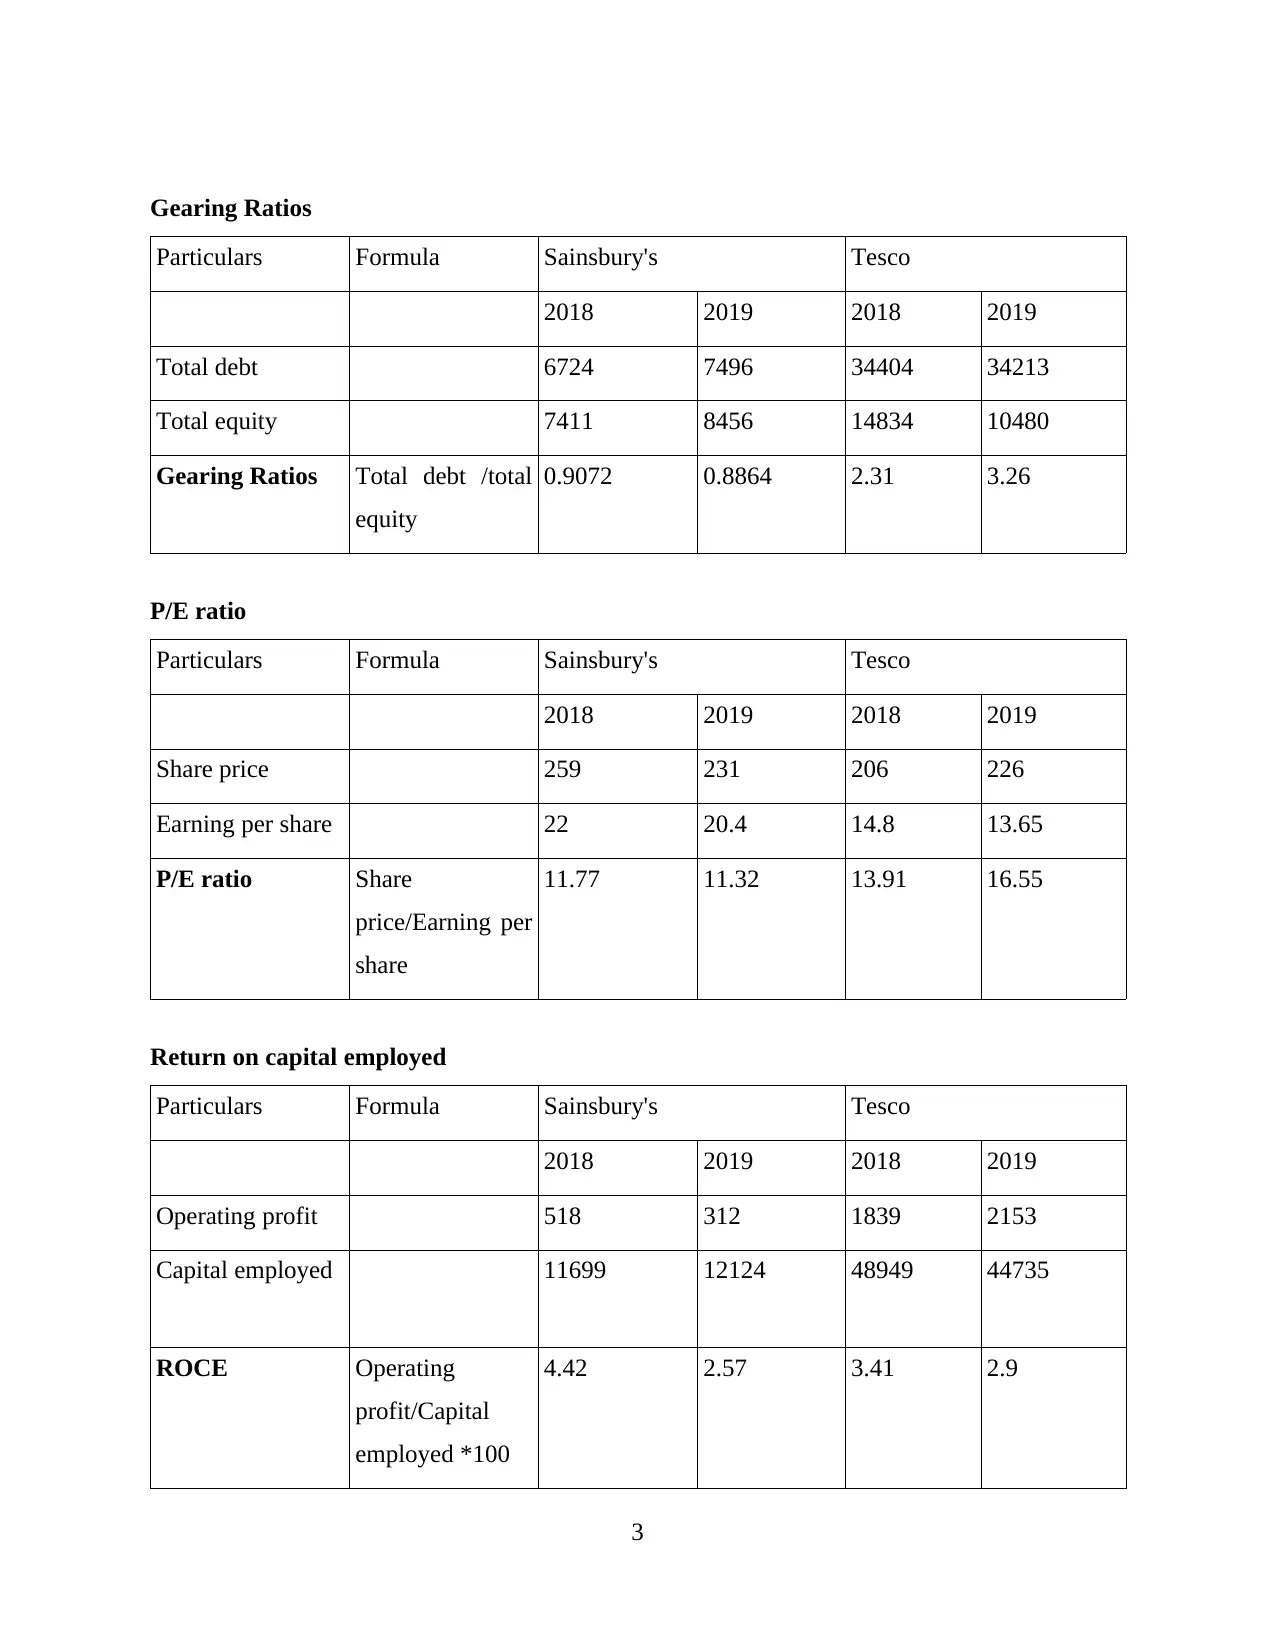
Gearing Ratios
Particulars Formula Sainsbury's Tesco
2018 2019 2018 2019
Total debt 6724 7496 34404 34213
Total equity 7411 8456 14834 10480
Gearing Ratios Total debt /total
equity
0.9072 0.8864 2.31 3.26
P/E ratio
Particulars Formula Sainsbury's Tesco
2018 2019 2018 2019
Share price 259 231 206 226
Earning per share 22 20.4 14.8 13.65
P/E ratio Share
price/Earning per
share
11.77 11.32 13.91 16.55
Return on capital employed
Particulars Formula Sainsbury's Tesco
2018 2019 2018 2019
Operating profit 518 312 1839 2153
Capital employed 11699 12124 48949 44735
ROCE Operating
profit/Capital
employed *100
4.42 2.57 3.41 2.9
3
Particulars Formula Sainsbury's Tesco
2018 2019 2018 2019
Total debt 6724 7496 34404 34213
Total equity 7411 8456 14834 10480
Gearing Ratios Total debt /total
equity
0.9072 0.8864 2.31 3.26
P/E ratio
Particulars Formula Sainsbury's Tesco
2018 2019 2018 2019
Share price 259 231 206 226
Earning per share 22 20.4 14.8 13.65
P/E ratio Share
price/Earning per
share
11.77 11.32 13.91 16.55
Return on capital employed
Particulars Formula Sainsbury's Tesco
2018 2019 2018 2019
Operating profit 518 312 1839 2153
Capital employed 11699 12124 48949 44735
ROCE Operating
profit/Capital
employed *100
4.42 2.57 3.41 2.9
3
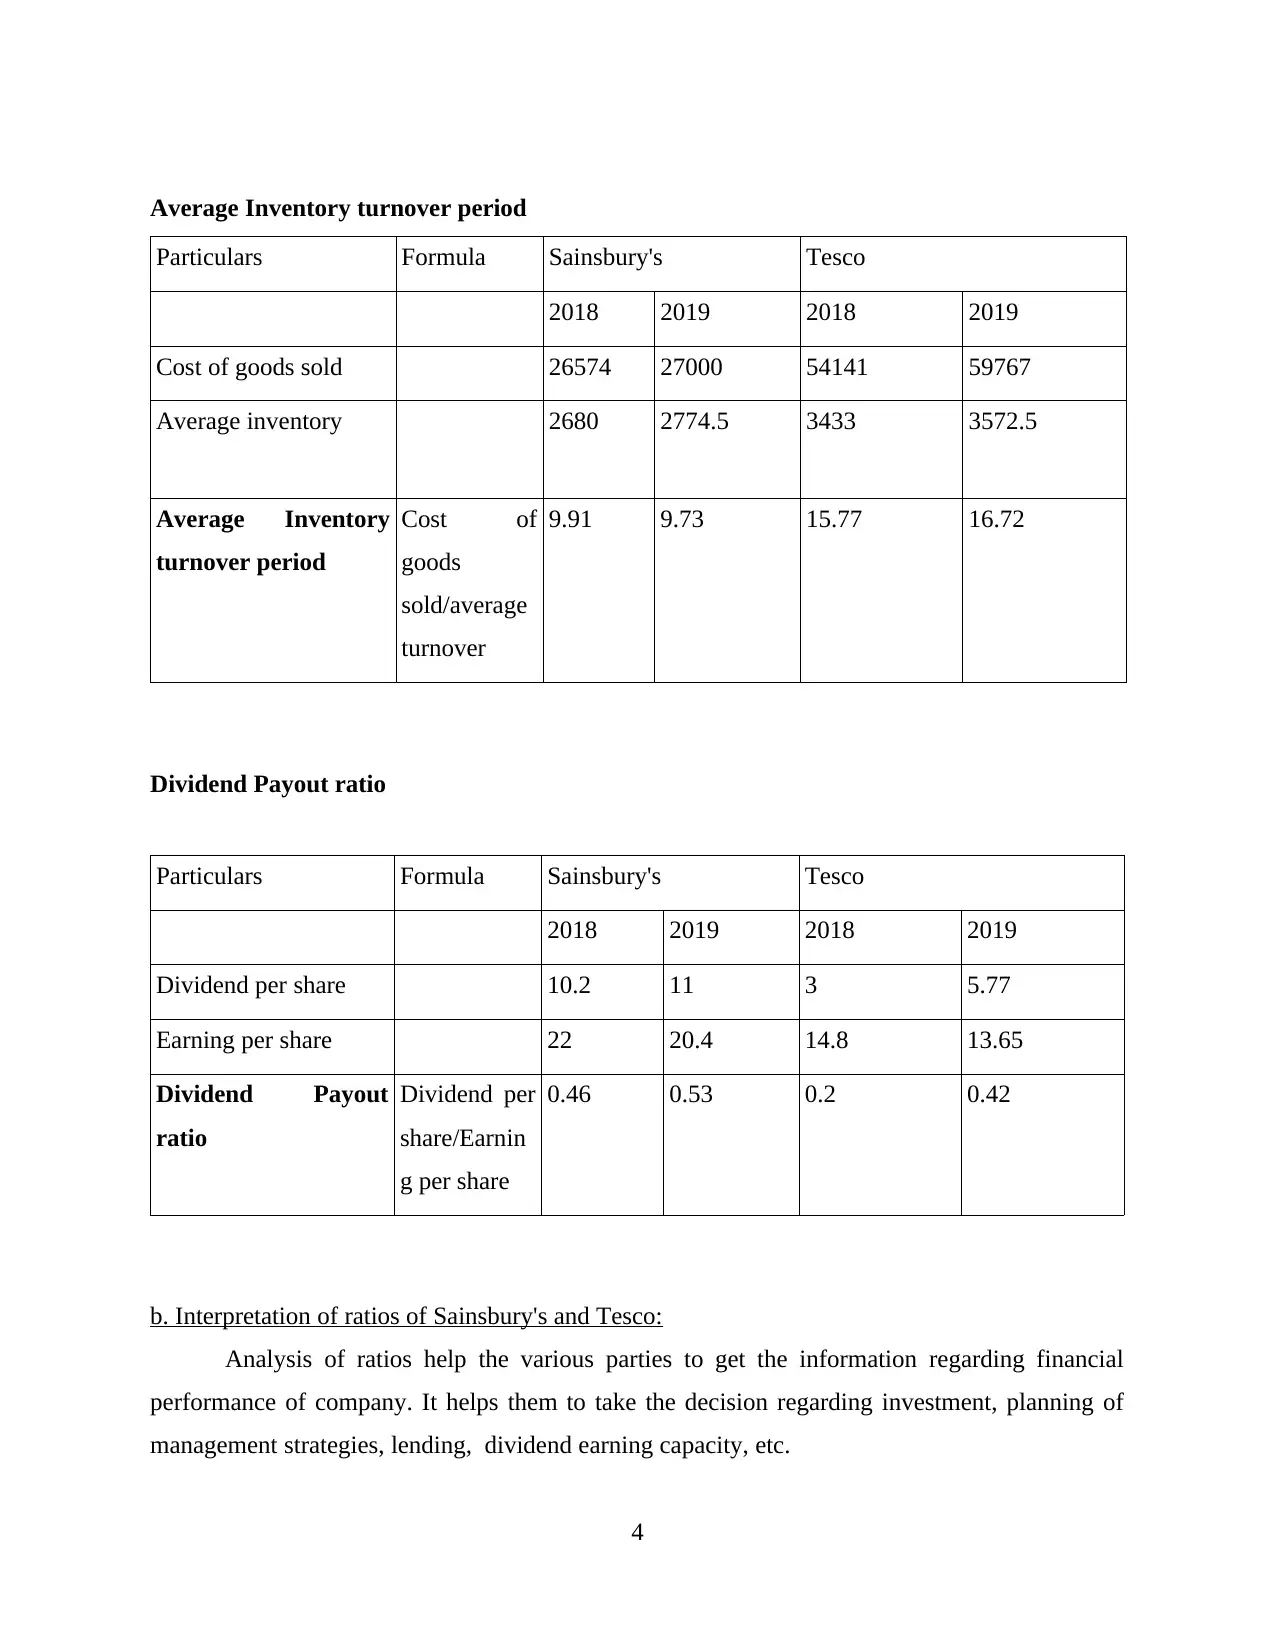
Average Inventory turnover period
Particulars Formula Sainsbury's Tesco
2018 2019 2018 2019
Cost of goods sold 26574 27000 54141 59767
Average inventory 2680 2774.5 3433 3572.5
Average Inventory
turnover period
Cost of
goods
sold/average
turnover
9.91 9.73 15.77 16.72
Dividend Payout ratio
Particulars Formula Sainsbury's Tesco
2018 2019 2018 2019
Dividend per share 10.2 11 3 5.77
Earning per share 22 20.4 14.8 13.65
Dividend Payout
ratio
Dividend per
share/Earnin
g per share
0.46 0.53 0.2 0.42
b. Interpretation of ratios of Sainsbury's and Tesco:
Analysis of ratios help the various parties to get the information regarding financial
performance of company. It helps them to take the decision regarding investment, planning of
management strategies, lending, dividend earning capacity, etc.
4
Particulars Formula Sainsbury's Tesco
2018 2019 2018 2019
Cost of goods sold 26574 27000 54141 59767
Average inventory 2680 2774.5 3433 3572.5
Average Inventory
turnover period
Cost of
goods
sold/average
turnover
9.91 9.73 15.77 16.72
Dividend Payout ratio
Particulars Formula Sainsbury's Tesco
2018 2019 2018 2019
Dividend per share 10.2 11 3 5.77
Earning per share 22 20.4 14.8 13.65
Dividend Payout
ratio
Dividend per
share/Earnin
g per share
0.46 0.53 0.2 0.42
b. Interpretation of ratios of Sainsbury's and Tesco:
Analysis of ratios help the various parties to get the information regarding financial
performance of company. It helps them to take the decision regarding investment, planning of
management strategies, lending, dividend earning capacity, etc.
4
⊘ This is a preview!⊘
Do you want full access?
Subscribe today to unlock all pages.
Trusted by 1+ million students worldwide
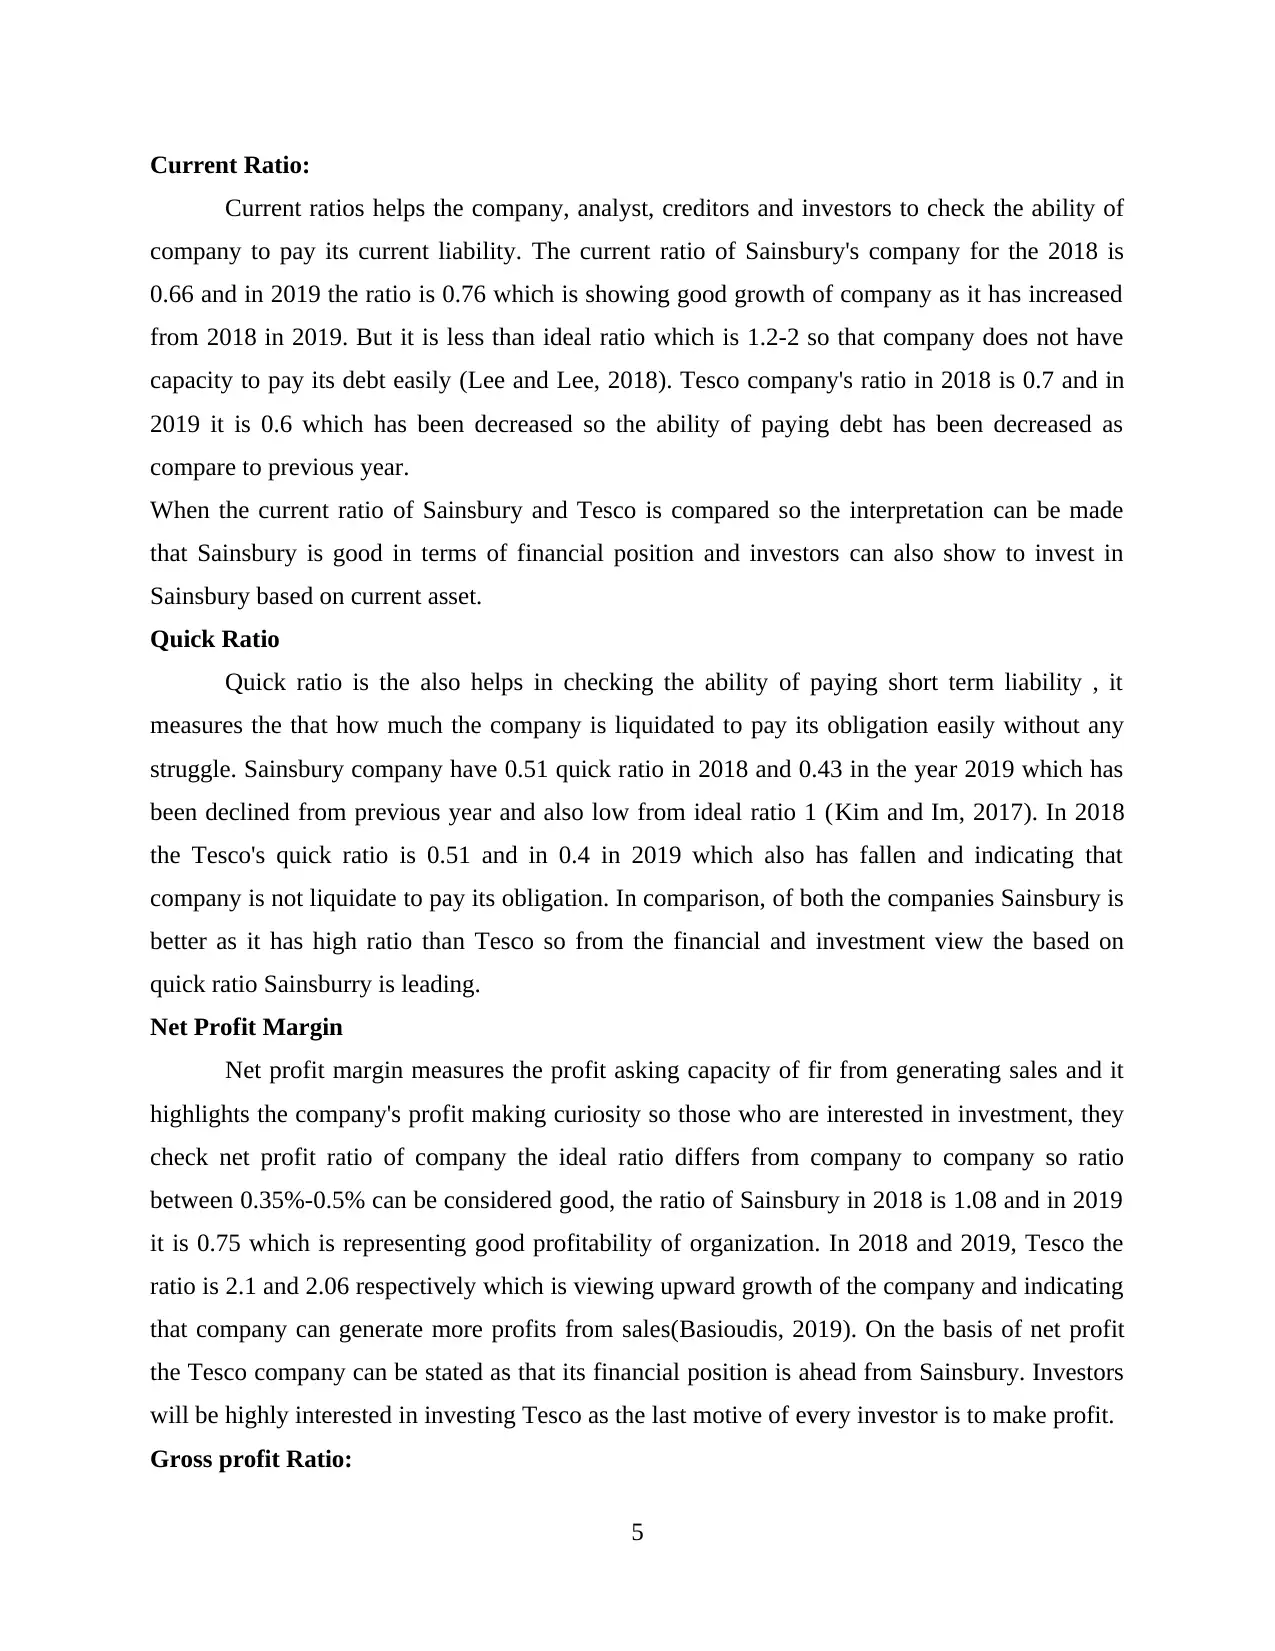
Current Ratio:
Current ratios helps the company, analyst, creditors and investors to check the ability of
company to pay its current liability. The current ratio of Sainsbury's company for the 2018 is
0.66 and in 2019 the ratio is 0.76 which is showing good growth of company as it has increased
from 2018 in 2019. But it is less than ideal ratio which is 1.2-2 so that company does not have
capacity to pay its debt easily (Lee and Lee, 2018). Tesco company's ratio in 2018 is 0.7 and in
2019 it is 0.6 which has been decreased so the ability of paying debt has been decreased as
compare to previous year.
When the current ratio of Sainsbury and Tesco is compared so the interpretation can be made
that Sainsbury is good in terms of financial position and investors can also show to invest in
Sainsbury based on current asset.
Quick Ratio
Quick ratio is the also helps in checking the ability of paying short term liability , it
measures the that how much the company is liquidated to pay its obligation easily without any
struggle. Sainsbury company have 0.51 quick ratio in 2018 and 0.43 in the year 2019 which has
been declined from previous year and also low from ideal ratio 1 (Kim and Im, 2017). In 2018
the Tesco's quick ratio is 0.51 and in 0.4 in 2019 which also has fallen and indicating that
company is not liquidate to pay its obligation. In comparison, of both the companies Sainsbury is
better as it has high ratio than Tesco so from the financial and investment view the based on
quick ratio Sainsburry is leading.
Net Profit Margin
Net profit margin measures the profit asking capacity of fir from generating sales and it
highlights the company's profit making curiosity so those who are interested in investment, they
check net profit ratio of company the ideal ratio differs from company to company so ratio
between 0.35%-0.5% can be considered good, the ratio of Sainsbury in 2018 is 1.08 and in 2019
it is 0.75 which is representing good profitability of organization. In 2018 and 2019, Tesco the
ratio is 2.1 and 2.06 respectively which is viewing upward growth of the company and indicating
that company can generate more profits from sales(Basioudis, 2019). On the basis of net profit
the Tesco company can be stated as that its financial position is ahead from Sainsbury. Investors
will be highly interested in investing Tesco as the last motive of every investor is to make profit.
Gross profit Ratio:
5
Paraphrase This Document
Need a fresh take? Get an instant paraphrase of this document with our AI Paraphraser
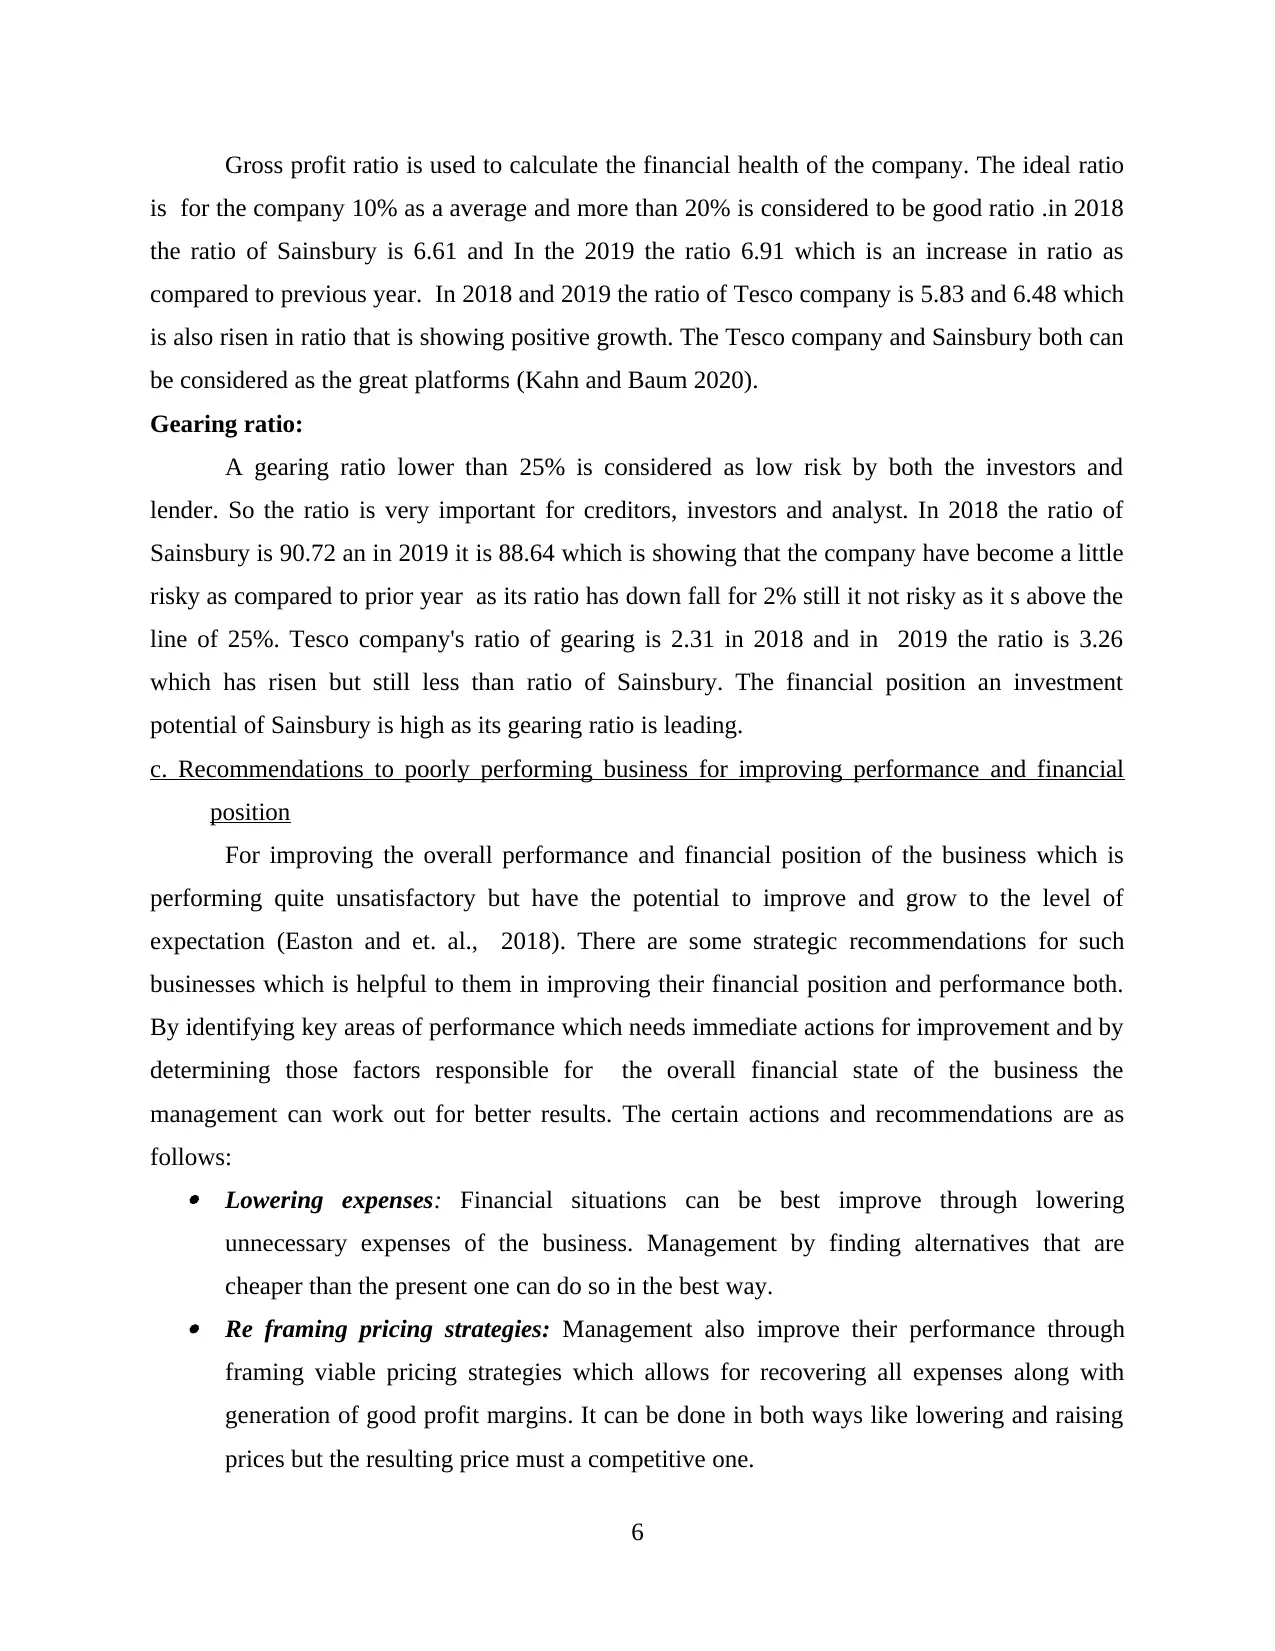
Gross profit ratio is used to calculate the financial health of the company. The ideal ratio
is for the company 10% as a average and more than 20% is considered to be good ratio .in 2018
the ratio of Sainsbury is 6.61 and In the 2019 the ratio 6.91 which is an increase in ratio as
compared to previous year. In 2018 and 2019 the ratio of Tesco company is 5.83 and 6.48 which
is also risen in ratio that is showing positive growth. The Tesco company and Sainsbury both can
be considered as the great platforms (Kahn and Baum 2020).
Gearing ratio:
A gearing ratio lower than 25% is considered as low risk by both the investors and
lender. So the ratio is very important for creditors, investors and analyst. In 2018 the ratio of
Sainsbury is 90.72 an in 2019 it is 88.64 which is showing that the company have become a little
risky as compared to prior year as its ratio has down fall for 2% still it not risky as it s above the
line of 25%. Tesco company's ratio of gearing is 2.31 in 2018 and in 2019 the ratio is 3.26
which has risen but still less than ratio of Sainsbury. The financial position an investment
potential of Sainsbury is high as its gearing ratio is leading.
c. Recommendations to poorly performing business for improving performance and financial
position
For improving the overall performance and financial position of the business which is
performing quite unsatisfactory but have the potential to improve and grow to the level of
expectation (Easton and et. al., 2018). There are some strategic recommendations for such
businesses which is helpful to them in improving their financial position and performance both.
By identifying key areas of performance which needs immediate actions for improvement and by
determining those factors responsible for the overall financial state of the business the
management can work out for better results. The certain actions and recommendations are as
follows: Lowering expenses: Financial situations can be best improve through lowering
unnecessary expenses of the business. Management by finding alternatives that are
cheaper than the present one can do so in the best way. Re framing pricing strategies: Management also improve their performance through
framing viable pricing strategies which allows for recovering all expenses along with
generation of good profit margins. It can be done in both ways like lowering and raising
prices but the resulting price must a competitive one.
6
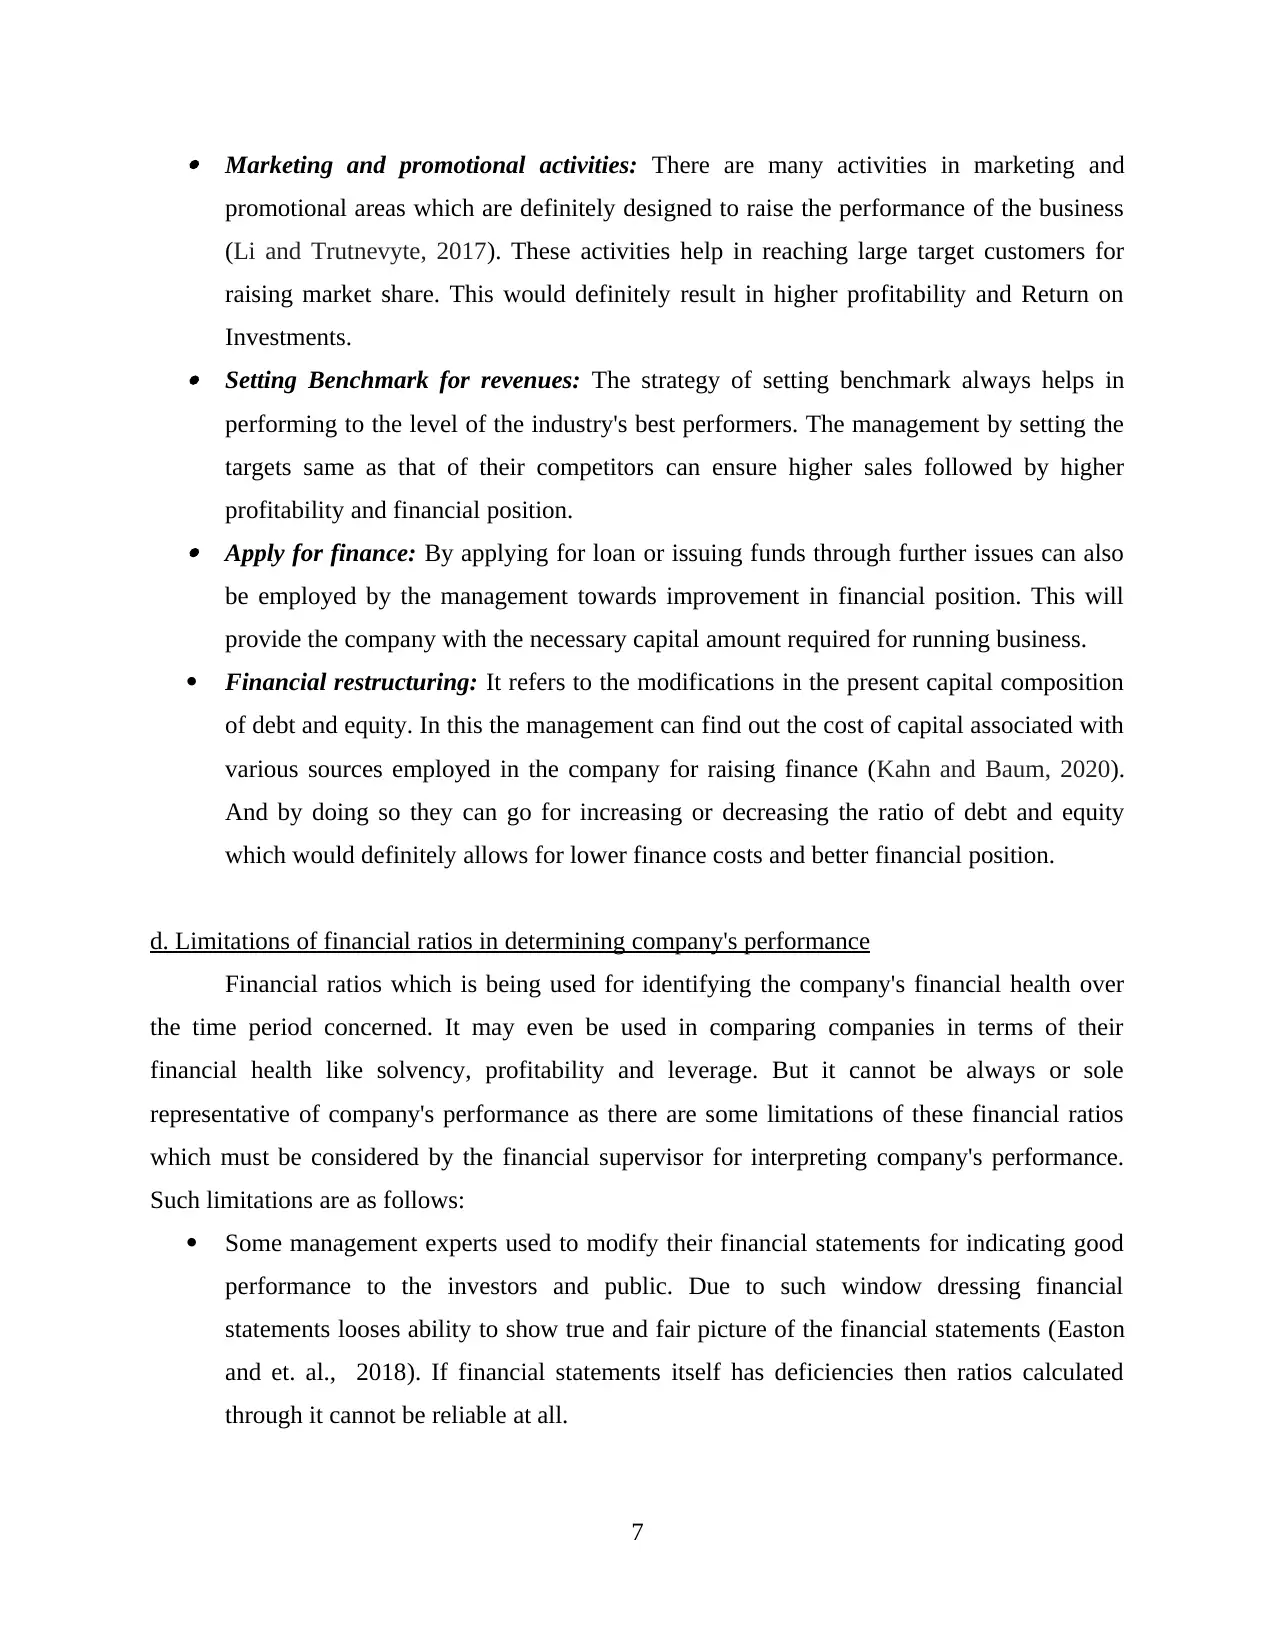
Marketing and promotional activities: There are many activities in marketing and
promotional areas which are definitely designed to raise the performance of the business
(Li and Trutnevyte, 2017). These activities help in reaching large target customers for
raising market share. This would definitely result in higher profitability and Return on
Investments. Setting Benchmark for revenues: The strategy of setting benchmark always helps in
performing to the level of the industry's best performers. The management by setting the
targets same as that of their competitors can ensure higher sales followed by higher
profitability and financial position. Apply for finance: By applying for loan or issuing funds through further issues can also
be employed by the management towards improvement in financial position. This will
provide the company with the necessary capital amount required for running business.
Financial restructuring: It refers to the modifications in the present capital composition
of debt and equity. In this the management can find out the cost of capital associated with
various sources employed in the company for raising finance (Kahn and Baum, 2020).
And by doing so they can go for increasing or decreasing the ratio of debt and equity
which would definitely allows for lower finance costs and better financial position.
d. Limitations of financial ratios in determining company's performance
Financial ratios which is being used for identifying the company's financial health over
the time period concerned. It may even be used in comparing companies in terms of their
financial health like solvency, profitability and leverage. But it cannot be always or sole
representative of company's performance as there are some limitations of these financial ratios
which must be considered by the financial supervisor for interpreting company's performance.
Such limitations are as follows:
Some management experts used to modify their financial statements for indicating good
performance to the investors and public. Due to such window dressing financial
statements looses ability to show true and fair picture of the financial statements (Easton
and et. al., 2018). If financial statements itself has deficiencies then ratios calculated
through it cannot be reliable at all.
7
⊘ This is a preview!⊘
Do you want full access?
Subscribe today to unlock all pages.
Trusted by 1+ million students worldwide
Inflationary factors are usually ignored by the financial statements as they are prepared
on the basis of his historical costs then same the would be carried over on ratios too
(Myšková and Hájek, 2017). Such historical costing doesn't reflect present financial
situation.
The financial ratios is concerned about quantitative aspect only and doesn't take into
consideration non monetary aspects like quality, expertise and experience of management
of the company, their employee's talent, market share and market image.
Sometimes it happens where the company changes their accounting policies. This change
in policies of accounting may result in unmatch between financial results of two
accounting years or two companies with different accounting policies (Abor, 2017). And
if the ratios are calculated on the basis of such differential financial statements then the
ratios so calculated looses its capability to be compared.
Portfolio 2:
Capital Investment Appraisal
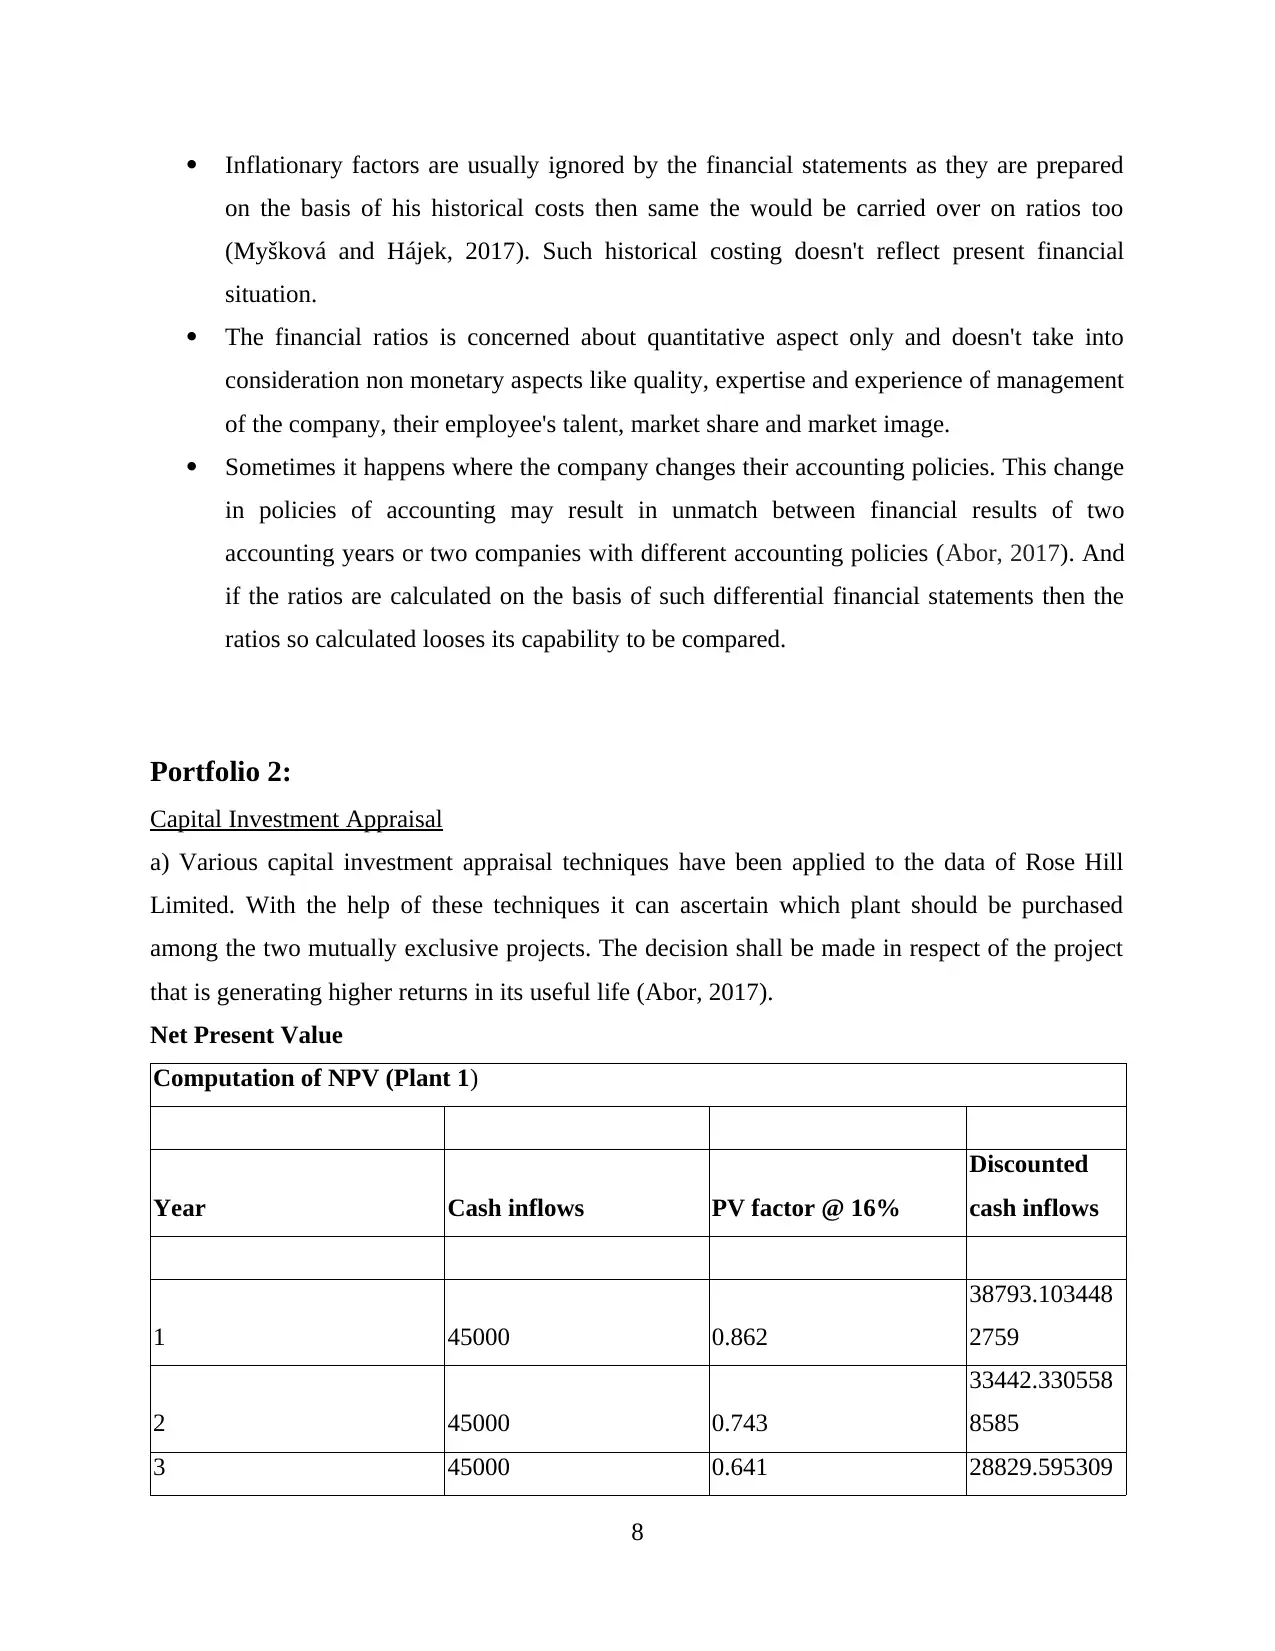
a) Various capital investment appraisal techniques have been applied to the data of Rose Hill
Limited. With the help of these techniques it can ascertain which plant should be purchased
among the two mutually exclusive projects. The decision shall be made in respect of the project
that is generating higher returns in its useful life (Abor, 2017).
Net Present Value
Computation of NPV (Plant 1)
Year Cash inflows PV factor @ 16%
Discounted
cash inflows
1 45000 0.862
38793.103448
2759
2 45000 0.743
33442.330558
8585
3 45000 0.641 28829.595309
8
on the basis of his historical costs then same the would be carried over on ratios too
(Myšková and Hájek, 2017). Such historical costing doesn't reflect present financial
situation.
The financial ratios is concerned about quantitative aspect only and doesn't take into
consideration non monetary aspects like quality, expertise and experience of management
of the company, their employee's talent, market share and market image.
Sometimes it happens where the company changes their accounting policies. This change
in policies of accounting may result in unmatch between financial results of two
accounting years or two companies with different accounting policies (Abor, 2017). And
if the ratios are calculated on the basis of such differential financial statements then the
ratios so calculated looses its capability to be compared.
Portfolio 2:
Capital Investment Appraisal
a) Various capital investment appraisal techniques have been applied to the data of Rose Hill
Limited. With the help of these techniques it can ascertain which plant should be purchased
among the two mutually exclusive projects. The decision shall be made in respect of the project
that is generating higher returns in its useful life (Abor, 2017).
Net Present Value
Computation of NPV (Plant 1)
Year Cash inflows PV factor @ 16%
Discounted
cash inflows
1 45000 0.862
38793.103448
2759
2 45000 0.743
33442.330558
8585
3 45000 0.641 28829.595309
8
Paraphrase This Document
Need a fresh take? Get an instant paraphrase of this document with our AI Paraphraser
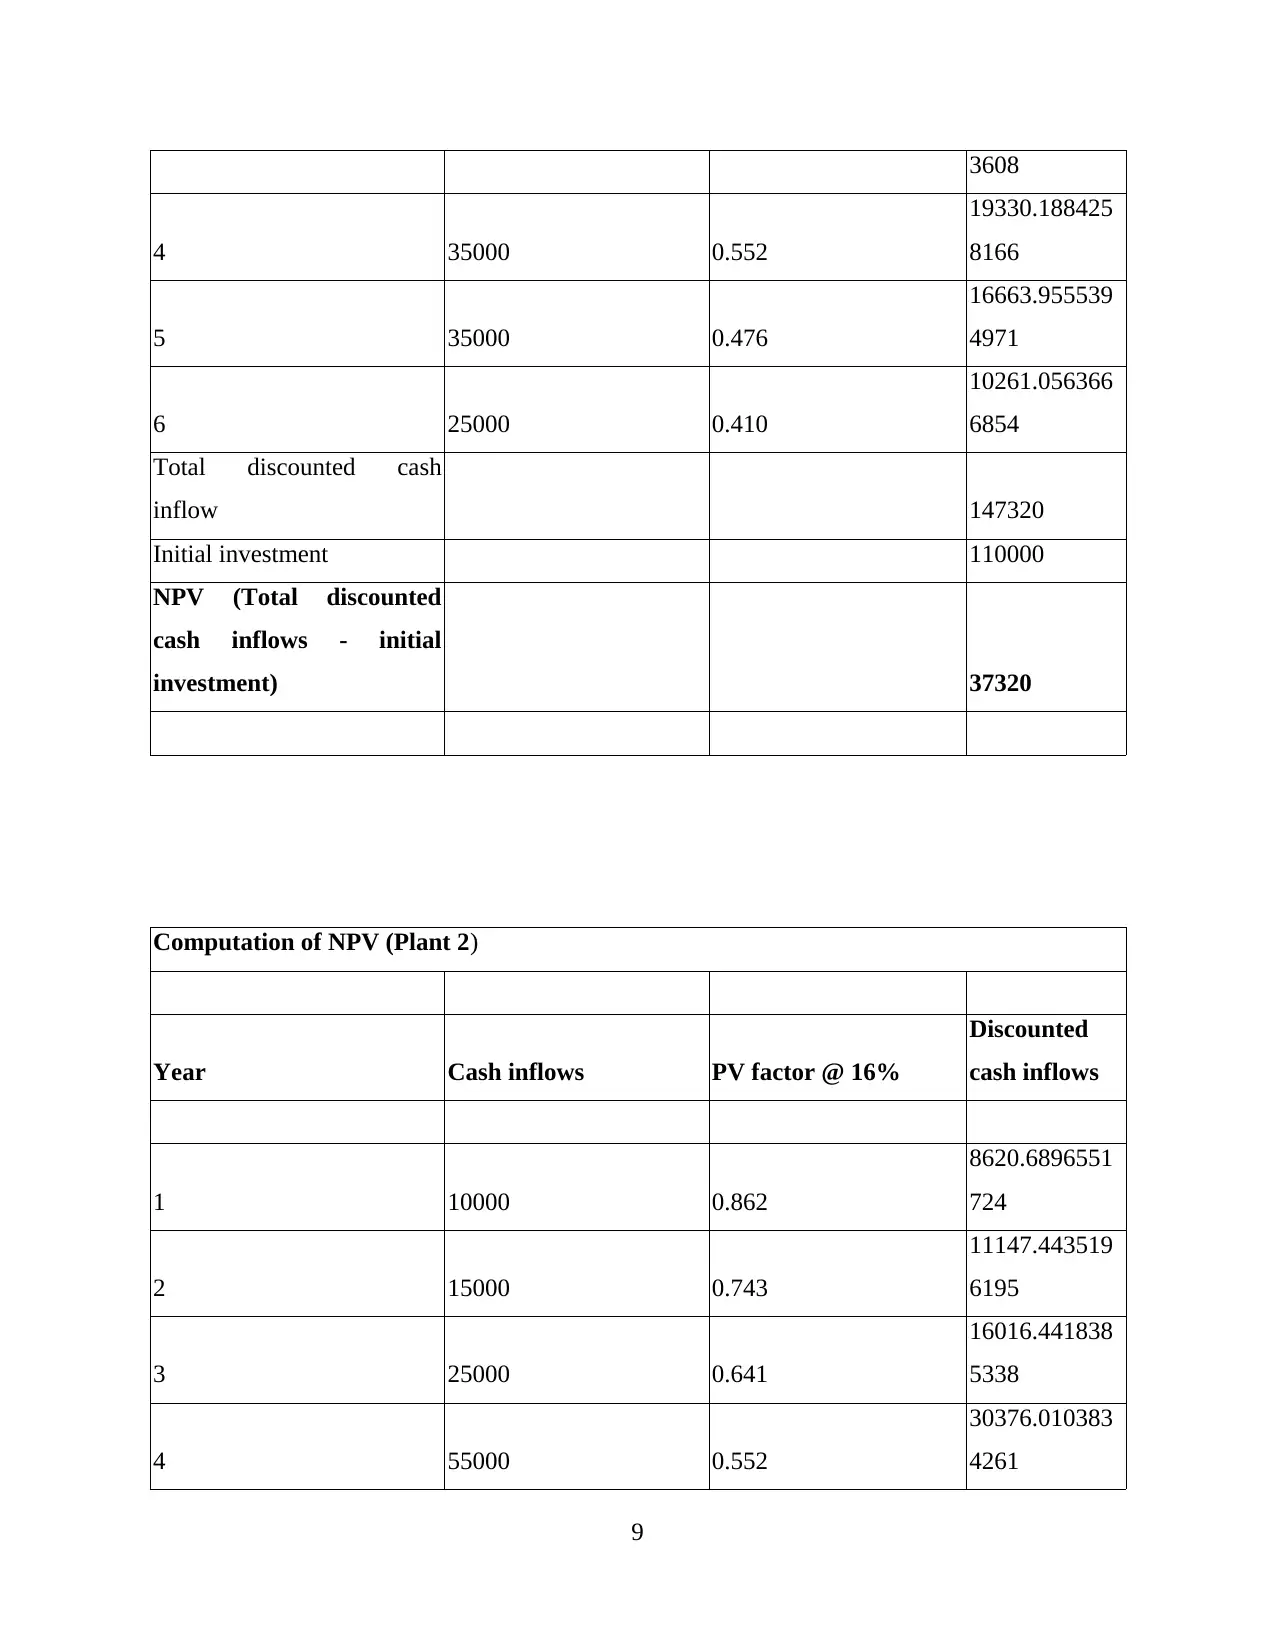
3608
4 35000 0.552
19330.188425
8166
5 35000 0.476
16663.955539
4971
6 25000 0.410
10261.056366
6854
Total discounted cash
inflow 147320
Initial investment 110000
NPV (Total discounted
cash inflows - initial
investment) 37320
Computation of NPV (Plant 2)
Year Cash inflows PV factor @ 16%
Discounted
cash inflows
1 10000 0.862
8620.6896551
724
2 15000 0.743
11147.443519
6195
3 25000 0.641
16016.441838
5338
4 55000 0.552
30376.010383
4261
9
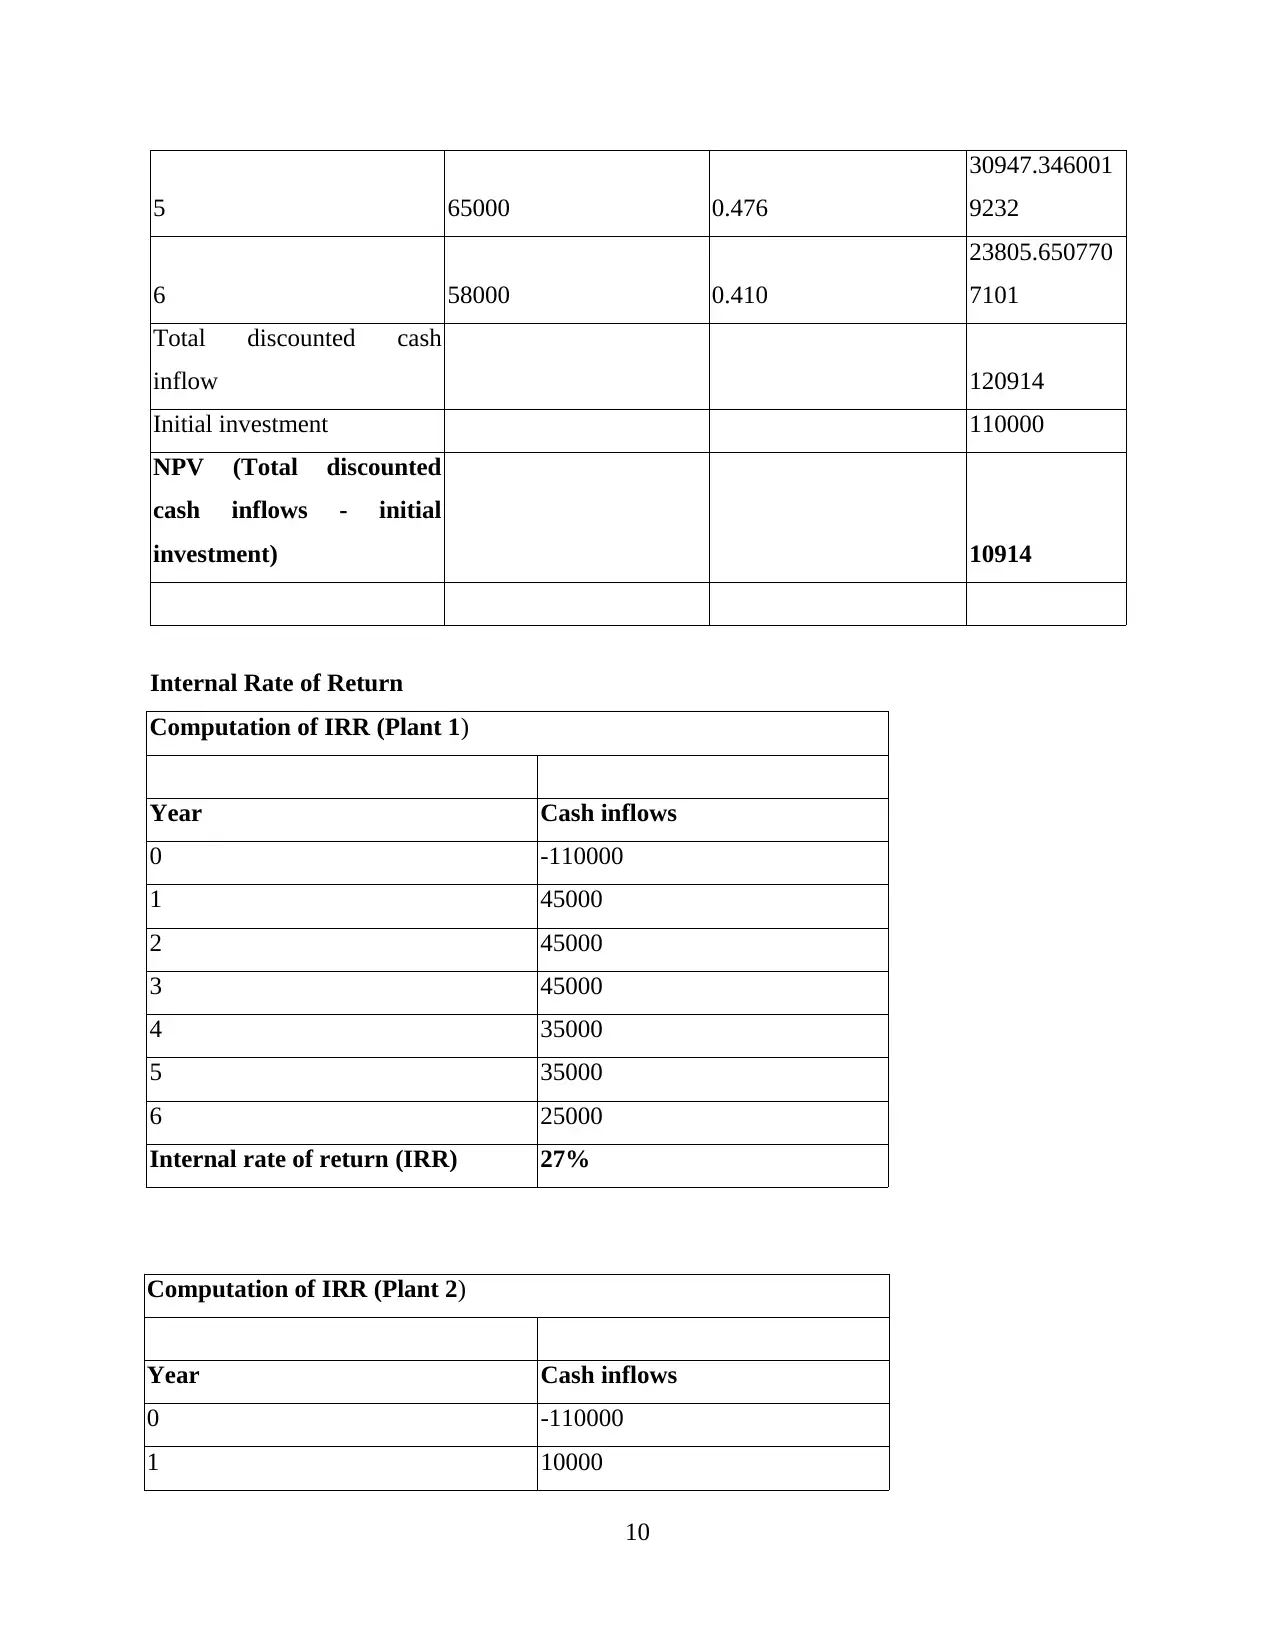
5 65000 0.476
30947.346001
9232
6 58000 0.410
23805.650770
7101
Total discounted cash
inflow 120914
Initial investment 110000
NPV (Total discounted
cash inflows - initial
investment) 10914
Internal Rate of Return
Computation of IRR (Plant 1)
Year Cash inflows
0 -110000
1 45000
2 45000
3 45000
4 35000
5 35000
6 25000
Internal rate of return (IRR) 27%
Computation of IRR (Plant 2)
Year Cash inflows
0 -110000
1 10000
10
⊘ This is a preview!⊘
Do you want full access?
Subscribe today to unlock all pages.
Trusted by 1+ million students worldwide
1 out of 18
Related Documents


Your All-in-One AI-Powered Toolkit for Academic Success.
+13062052269
info@desklib.com
Available 24*7 on WhatsApp / Email
![[object Object]](/_next/static/media/star-bottom.7253800d.svg)
Unlock your academic potential
Copyright © 2020–2026 A2Z Services. All Rights Reserved. Developed and managed by ZUCOL.