Detailed Financial Analysis and Comparison: Sainsbury's & Tesco
VerifiedAdded on 2021/02/21
|24
|4214
|19
Report
AI Summary
This report provides a comprehensive financial analysis of Sainsbury's and Tesco, focusing on key financial ratios to assess their performance from 2015 to 2019. The analysis includes vertical and horizontal ratio analysis of financial statements, covering profitability (gross profit and net profit ratios), liquidity (current and quick ratios), and solvency (debt-equity and interest coverage ratios). Furthermore, the report examines working capital management and evaluates the cash flow of both companies over a two-year period. The objective is to offer recommendations to an Asian food manufacturer regarding potential clients, utilizing the financial data and ratio interpretations to compare the financial health and stability of Sainsbury's and Tesco. The report highlights trends, inconsistencies, and comparative strengths and weaknesses in the financial positions of the two companies, offering valuable insights for decision-making.
Financial Analysis
Management &
Enterprise
Management &
Enterprise
Paraphrase This Document
Need a fresh take? Get an instant paraphrase of this document with our AI Paraphraser
Table of Contents
INTRODUCTION...........................................................................................................................3
MAIN BODY...................................................................................................................................3
1. Vertical and horizontal ratio analysis of the financial Statements of two companies........3
2. Working capital analysis..................................................................................................20
3. Evaluation of the Cash Flow............................................................................................21
CONCLUSION..............................................................................................................................23
REFERENCES..............................................................................................................................24
INTRODUCTION
The financial analysis can be defined as a kind of technique which is related to the
assessing and interpreting the financial reports and statements of companies (Langston and
Lauge-Kristensen, 2013). This is very important for companies to analyse the financial
transactions of organisations so that financial position of organisations can be evaluated. As well
as proper financial analysis leads to effective management of financial situation of company.
Herein, the project report Sainsbury's and Tesco company has been chosen. As well as in the
project report, financial performance of both companies is analysed. In this analysis vertical and
horizontal of financial statements of two companies is included . Along with role of analysing
the working capital of both the companies in decision making is mentioned. In the end of project
report, annual cash flow of above companies is analysed for two years. The aim of project report
is to recommending to Asian food manufacture to choose the Tesco and Sainsburry's company as
client.
MAIN BODY
1. Vertical and horizontal ratio analysis of the financial Statements of two companies.
The ratio analysis can be defined as a kind of technique which is related to the analysing
the financial position of companies with the use of various types of ratio (WANG and WANG,
2012). Basically, the ratio analysis consists a wide range of ratios that are being calculated and
interpreted by companies for purpose of decision making. Herein, below some types of ratios of
Sainsburry's and Tesco company are mentioned below:
Profitability ratio- The profitability ratios can be defined as a kind of ratios which are being
calculated to provide information about level of profits earned by companies at the end of any
particular time period. This ratio consists some types of ratios which are as follows:
Gross profit ratio- It is a kind of ratio that is being computed by companies to get
information about profitability of various activities regarding to the production (Pinto,
and Garvey, 2016). As well as this ratio is being calculated by this formula: Net sales/
Gross profit. Herein, below gross profit ratio of above two companies is mentioned below
for four years:
⊘ This is a preview!⊘
Do you want full access?
Subscribe today to unlock all pages.
Trusted by 1+ million students worldwide
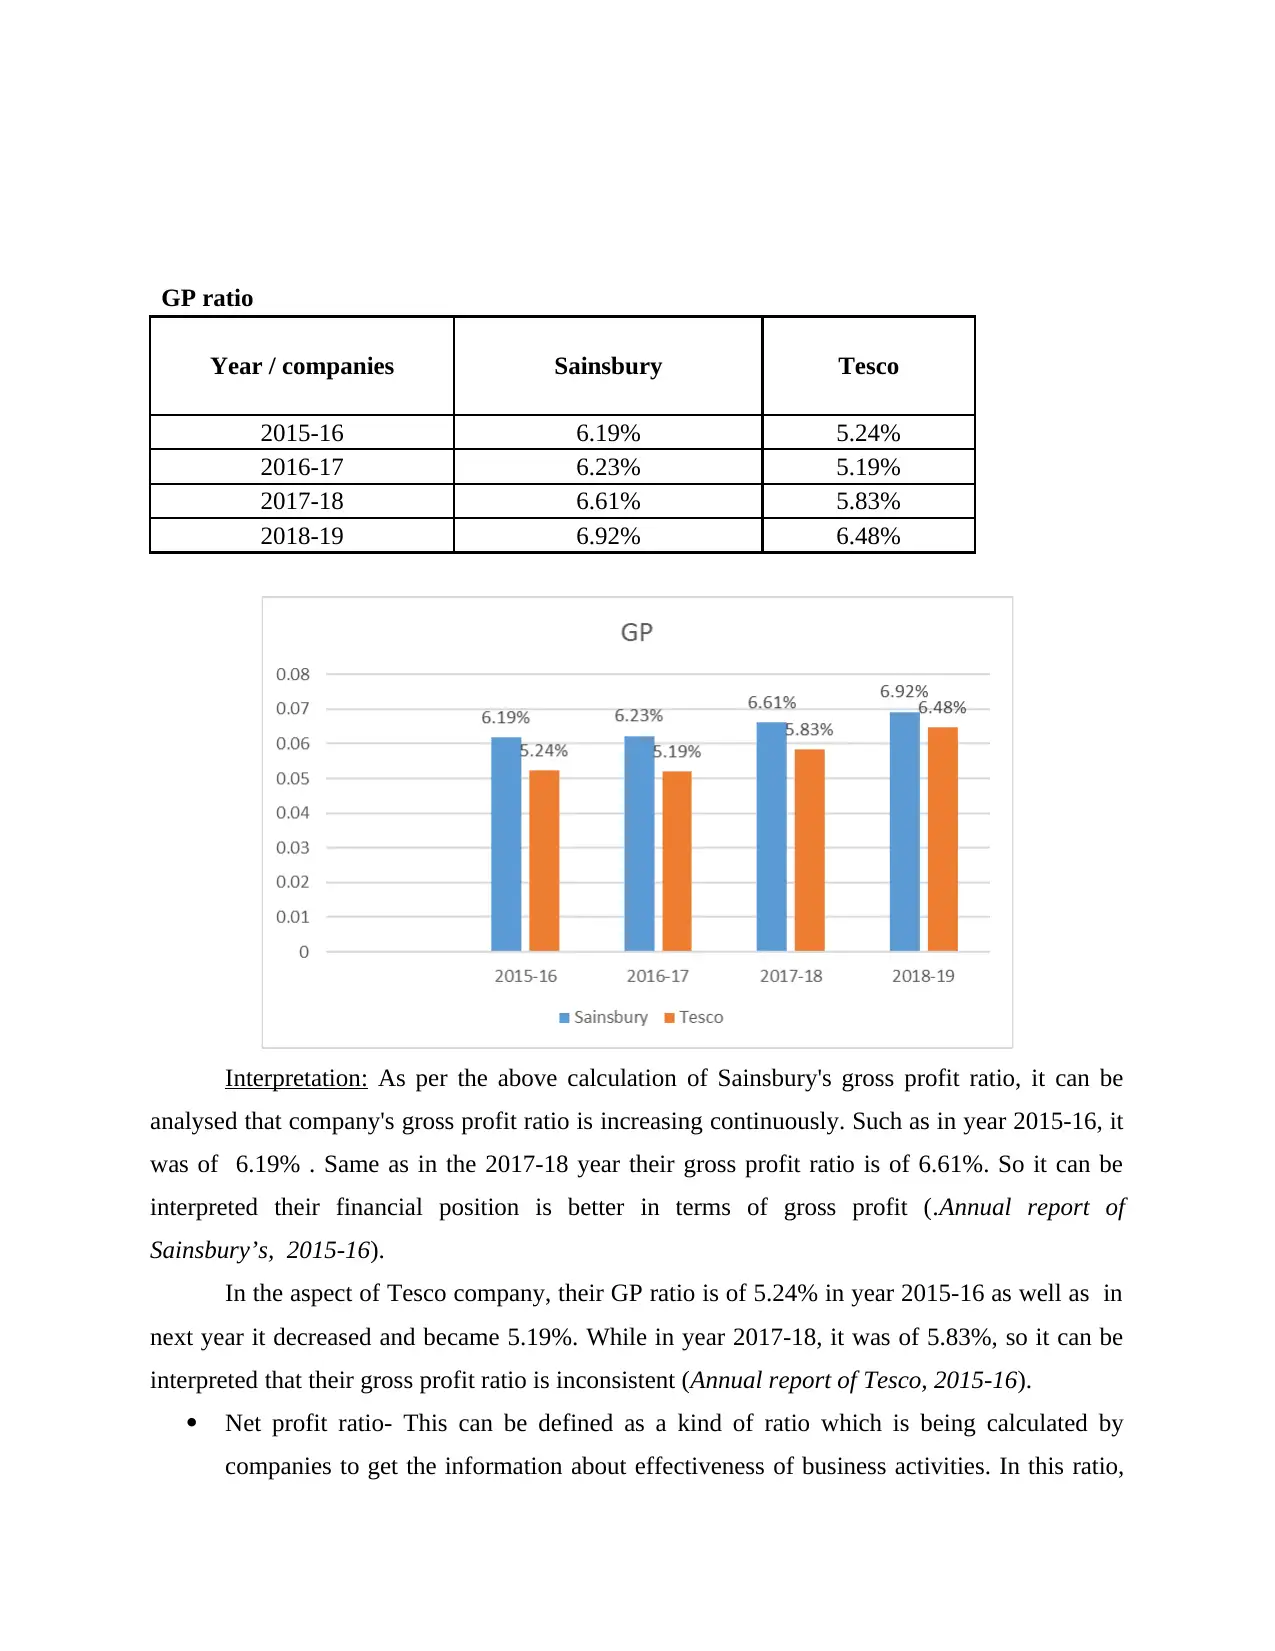
GP ratio
Year / companies Sainsbury Tesco
2015-16 6.19% 5.24%
2016-17 6.23% 5.19%
2017-18 6.61% 5.83%
2018-19 6.92% 6.48%
Interpretation: As per the above calculation of Sainsbury's gross profit ratio, it can be
analysed that company's gross profit ratio is increasing continuously. Such as in year 2015-16, it
was of 6.19% . Same as in the 2017-18 year their gross profit ratio is of 6.61%. So it can be
interpreted their financial position is better in terms of gross profit (.Annual report of
Sainsbury’s, 2015-16).
In the aspect of Tesco company, their GP ratio is of 5.24% in year 2015-16 as well as in
next year it decreased and became 5.19%. While in year 2017-18, it was of 5.83%, so it can be
interpreted that their gross profit ratio is inconsistent (Annual report of Tesco, 2015-16).
Net profit ratio- This can be defined as a kind of ratio which is being calculated by
companies to get the information about effectiveness of business activities. In this ratio,
Paraphrase This Document
Need a fresh take? Get an instant paraphrase of this document with our AI Paraphraser
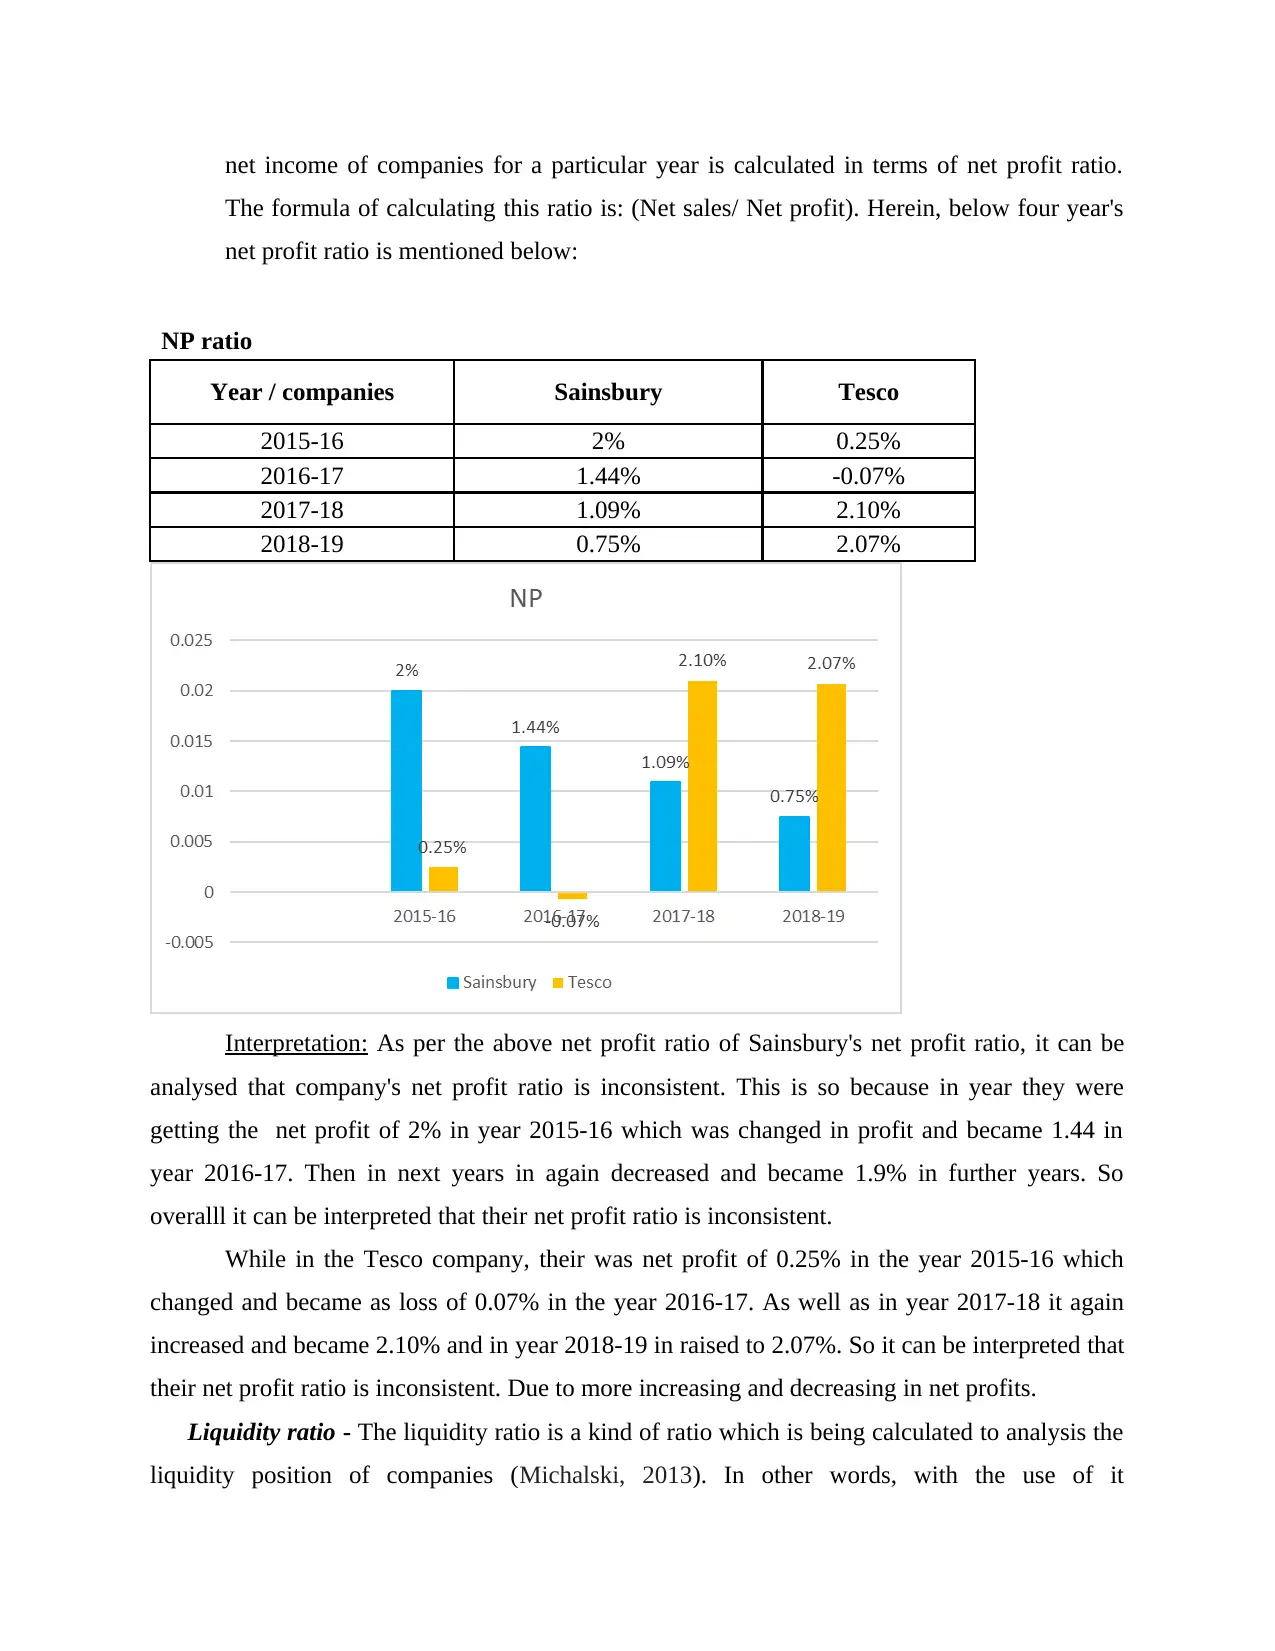
net income of companies for a particular year is calculated in terms of net profit ratio.
The formula of calculating this ratio is: (Net sales/ Net profit). Herein, below four year's
net profit ratio is mentioned below:
NP ratio
Year / companies Sainsbury Tesco
2015-16 2% 0.25%
2016-17 1.44% -0.07%
2017-18 1.09% 2.10%
2018-19 0.75% 2.07%
Interpretation: As per the above net profit ratio of Sainsbury's net profit ratio, it can be
analysed that company's net profit ratio is inconsistent. This is so because in year they were
getting the net profit of 2% in year 2015-16 which was changed in profit and became 1.44 in
year 2016-17. Then in next years in again decreased and became 1.9% in further years. So
overalll it can be interpreted that their net profit ratio is inconsistent.
While in the Tesco company, their was net profit of 0.25% in the year 2015-16 which
changed and became as loss of 0.07% in the year 2016-17. As well as in year 2017-18 it again
increased and became 2.10% and in year 2018-19 in raised to 2.07%. So it can be interpreted that
their net profit ratio is inconsistent. Due to more increasing and decreasing in net profits.
Liquidity ratio - The liquidity ratio is a kind of ratio which is being calculated to analysis the
liquidity position of companies (Michalski, 2013). In other words, with the use of it
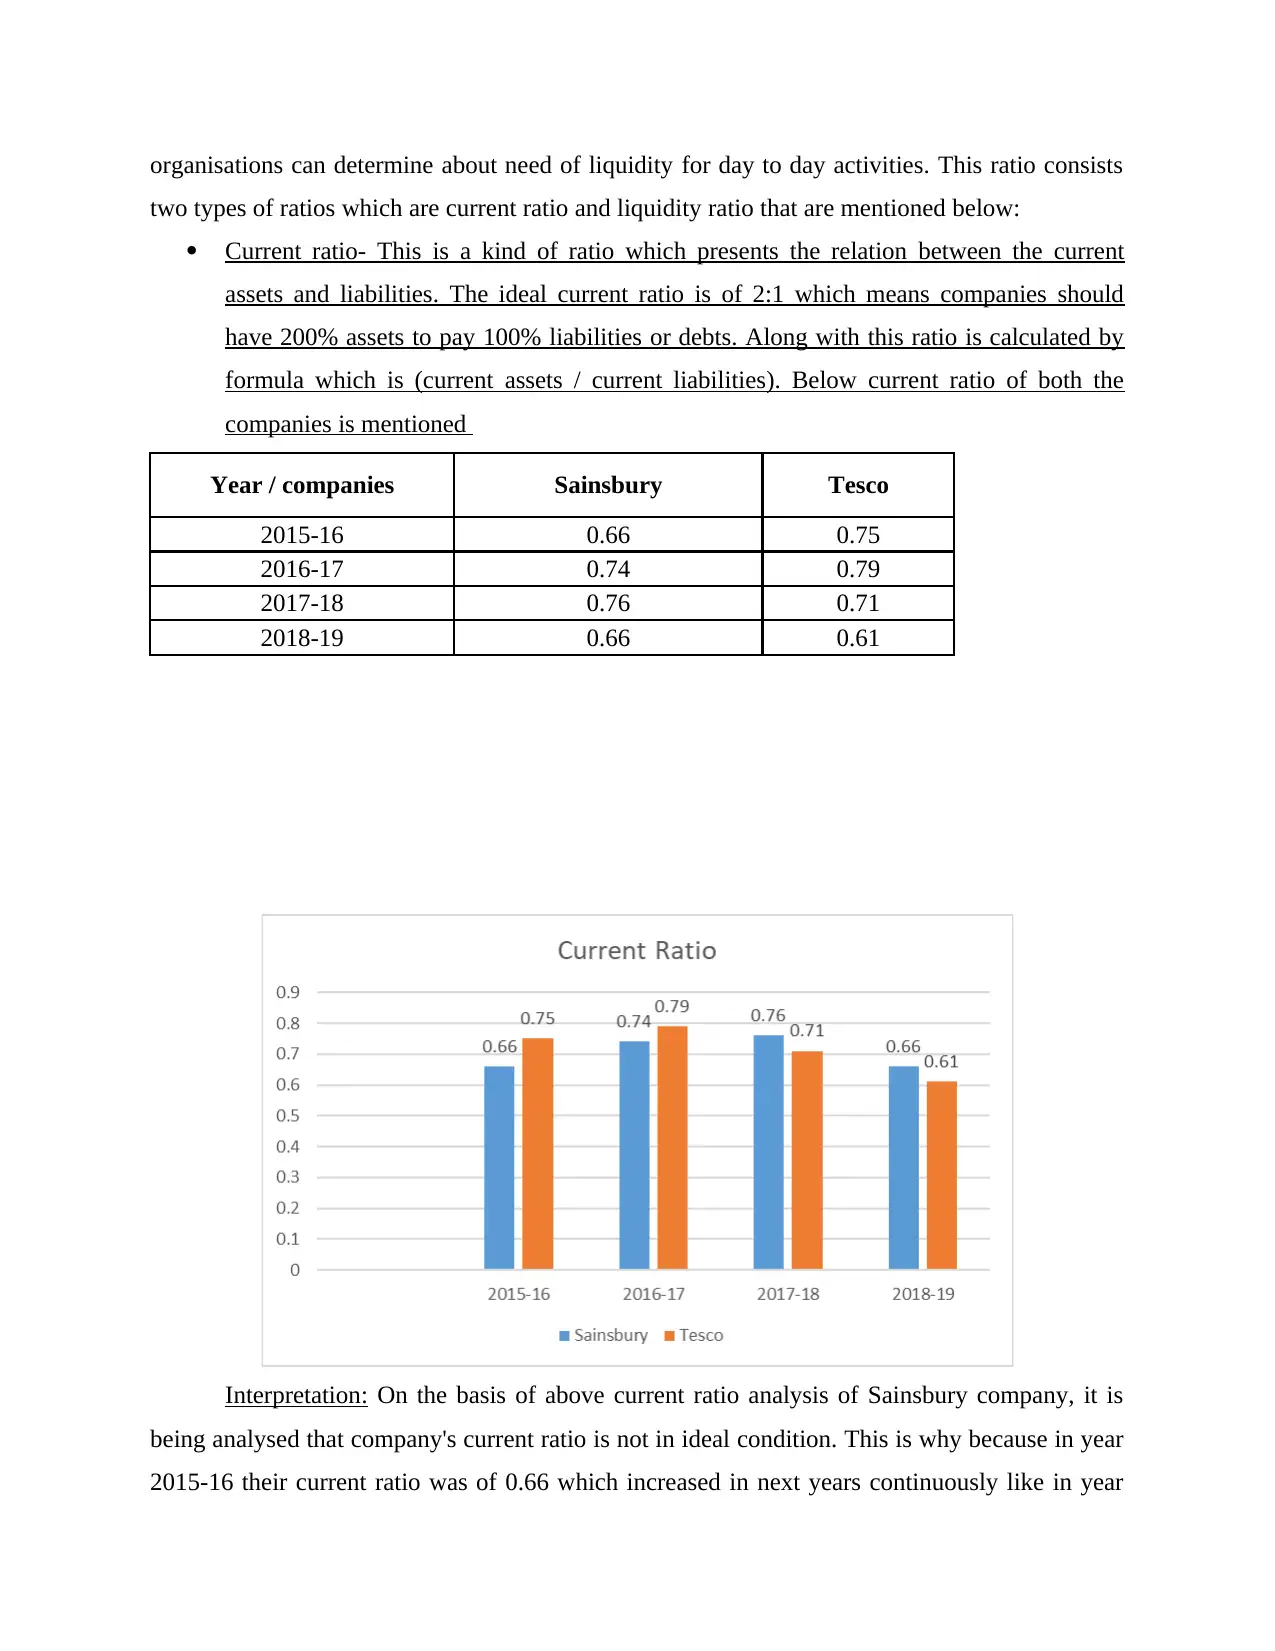
organisations can determine about need of liquidity for day to day activities. This ratio consists
two types of ratios which are current ratio and liquidity ratio that are mentioned below:
Current ratio- This is a kind of ratio which presents the relation between the current
assets and liabilities. The ideal current ratio is of 2:1 which means companies should
have 200% assets to pay 100% liabilities or debts. Along with this ratio is calculated by
formula which is (current assets / current liabilities). Below current ratio of both the
companies is mentioned
Year / companies Sainsbury Tesco
2015-16 0.66 0.75
2016-17 0.74 0.79
2017-18 0.76 0.71
2018-19 0.66 0.61
Interpretation: On the basis of above current ratio analysis of Sainsbury company, it is
being analysed that company's current ratio is not in ideal condition. This is why because in year
2015-16 their current ratio was of 0.66 which increased in next years continuously like in year
⊘ This is a preview!⊘
Do you want full access?
Subscribe today to unlock all pages.
Trusted by 1+ million students worldwide
2016-17, it was of 0.74. As well as in last two years this ratio was of 0.76 and 0.66. Hence, it can
be interpreted that company's current ratio is not in ideal condition but their ratio is increasing
continuously except last year.
In the Tesco company, their current ratio is of 0.75 in year 2015-16. As well as in next
year 2016-17, it was of 0.79 but in year 2017-18, it decreased in became 0.71. So overall, it can
be interpreted that company's liquidity position is weak because they do not have enough current
assets to pay their creditors. Along with the company is far away from ideal position of current
ratio which is of 2:1.
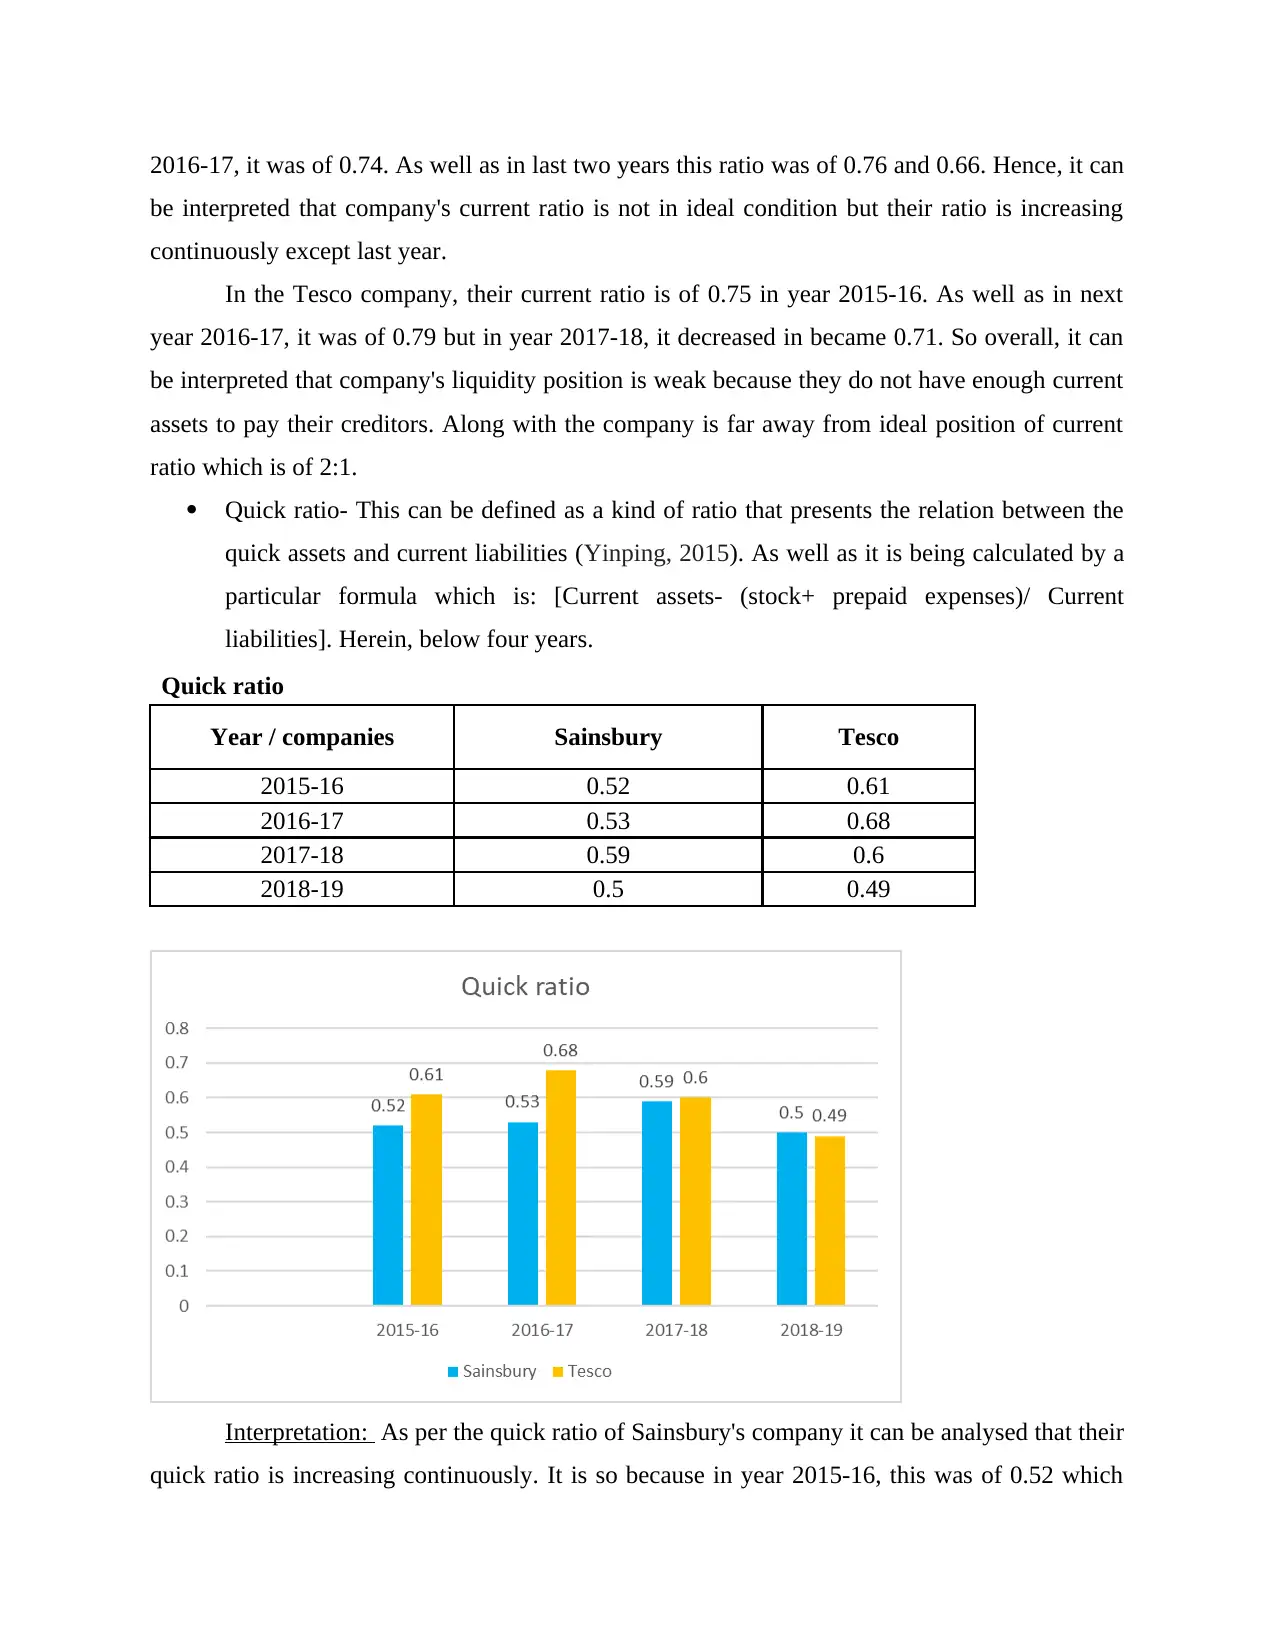
Quick ratio- This can be defined as a kind of ratio that presents the relation between the
quick assets and current liabilities (Yinping, 2015). As well as it is being calculated by a
particular formula which is: [Current assets- (stock+ prepaid expenses)/ Current
liabilities]. Herein, below four years.
Quick ratio
Year / companies Sainsbury Tesco
2015-16 0.52 0.61
2016-17 0.53 0.68
2017-18 0.59 0.6
2018-19 0.5 0.49
Interpretation: As per the quick ratio of Sainsbury's company it can be analysed that their
quick ratio is increasing continuously. It is so because in year 2015-16, this was of 0.52 which
be interpreted that company's current ratio is not in ideal condition but their ratio is increasing
continuously except last year.
In the Tesco company, their current ratio is of 0.75 in year 2015-16. As well as in next
year 2016-17, it was of 0.79 but in year 2017-18, it decreased in became 0.71. So overall, it can
be interpreted that company's liquidity position is weak because they do not have enough current
assets to pay their creditors. Along with the company is far away from ideal position of current
ratio which is of 2:1.
Quick ratio- This can be defined as a kind of ratio that presents the relation between the
quick assets and current liabilities (Yinping, 2015). As well as it is being calculated by a
particular formula which is: [Current assets- (stock+ prepaid expenses)/ Current
liabilities]. Herein, below four years.
Quick ratio
Year / companies Sainsbury Tesco
2015-16 0.52 0.61
2016-17 0.53 0.68
2017-18 0.59 0.6
2018-19 0.5 0.49
Interpretation: As per the quick ratio of Sainsbury's company it can be analysed that their
quick ratio is increasing continuously. It is so because in year 2015-16, this was of 0.52 which
Paraphrase This Document
Need a fresh take? Get an instant paraphrase of this document with our AI Paraphraser
increased in further years. In 2016-17, it was of 0.53 as well as in next it became of 0.59. In the
current year 2018-19, their quick ratio was of 0.50. So it can be interpreted that company's quick
ratio is not in ideal condition which is of 1.5:1.
On the other hand, in the Tesco company their quick ratio is of 0.61 in year 2015-16
which is increasing and decreasing in next years. Like in year 2016-17, it was of 0.68 which
increased then previous year. As well as in next year 2017-18, it decreased and became of 0.6 but
in next year again it decreased and became of 0.49. It shows that their quick ratio is inconsistent.
So it can be interpreted that company's quick ratio is not in better condition due to below of ideal
standard of ratio that is of 1.5:1. In the comparative manner, both company's quick ratio is not so
good because for better position companies need 1.5% assets to pay 1 % of current liabilities.
Though as per the individual performance, the Tesco company's liquidity position is better as
compare to Sainsburry's. For example in time duration between 2015-18, Sainsbury's ratios are
just below 0.60 but Tesco company's ratios are more then 0.60 and highest is of 0.68 (Annual
report of Tesco, 2016-17). Hence, it can be interpreted that Tesco's liquidity position is better
then Sainsburry.
Solvency ratio- It can be defined as a kind of ratio which is related to the determining the
long term liabilities of companies (Zhao, Hwang, Pheng Low, 2014). In other words, this ratio is
beneficial for assessing the about way in which organisations are meeting to their debts. In this
context if this is ratio is maximum then it indicate that company's financial position is in better
condition. Herein, below various types of solvency ratio are mentioned below:
Debt- equity ratio- This may be defined as a type of ratio that defines the relation
between the debt and equity. The debt to equity ratio analyse about availability of
equities to pay the debts of company. Eventually, the ideal debt to equity ratio should be
1.5:1 which means company should have 1.5% equities to pay the 1% debtors. As well as
this ratio is being calculated by following formula which is: (total debts/ shareholders
fund). Herein, below four years debt to equity ratio is mentioned below of above two
companies:
Debt-equity ratio
Year / companies Sainsbury Tesco
2015-16 0.35 1.23
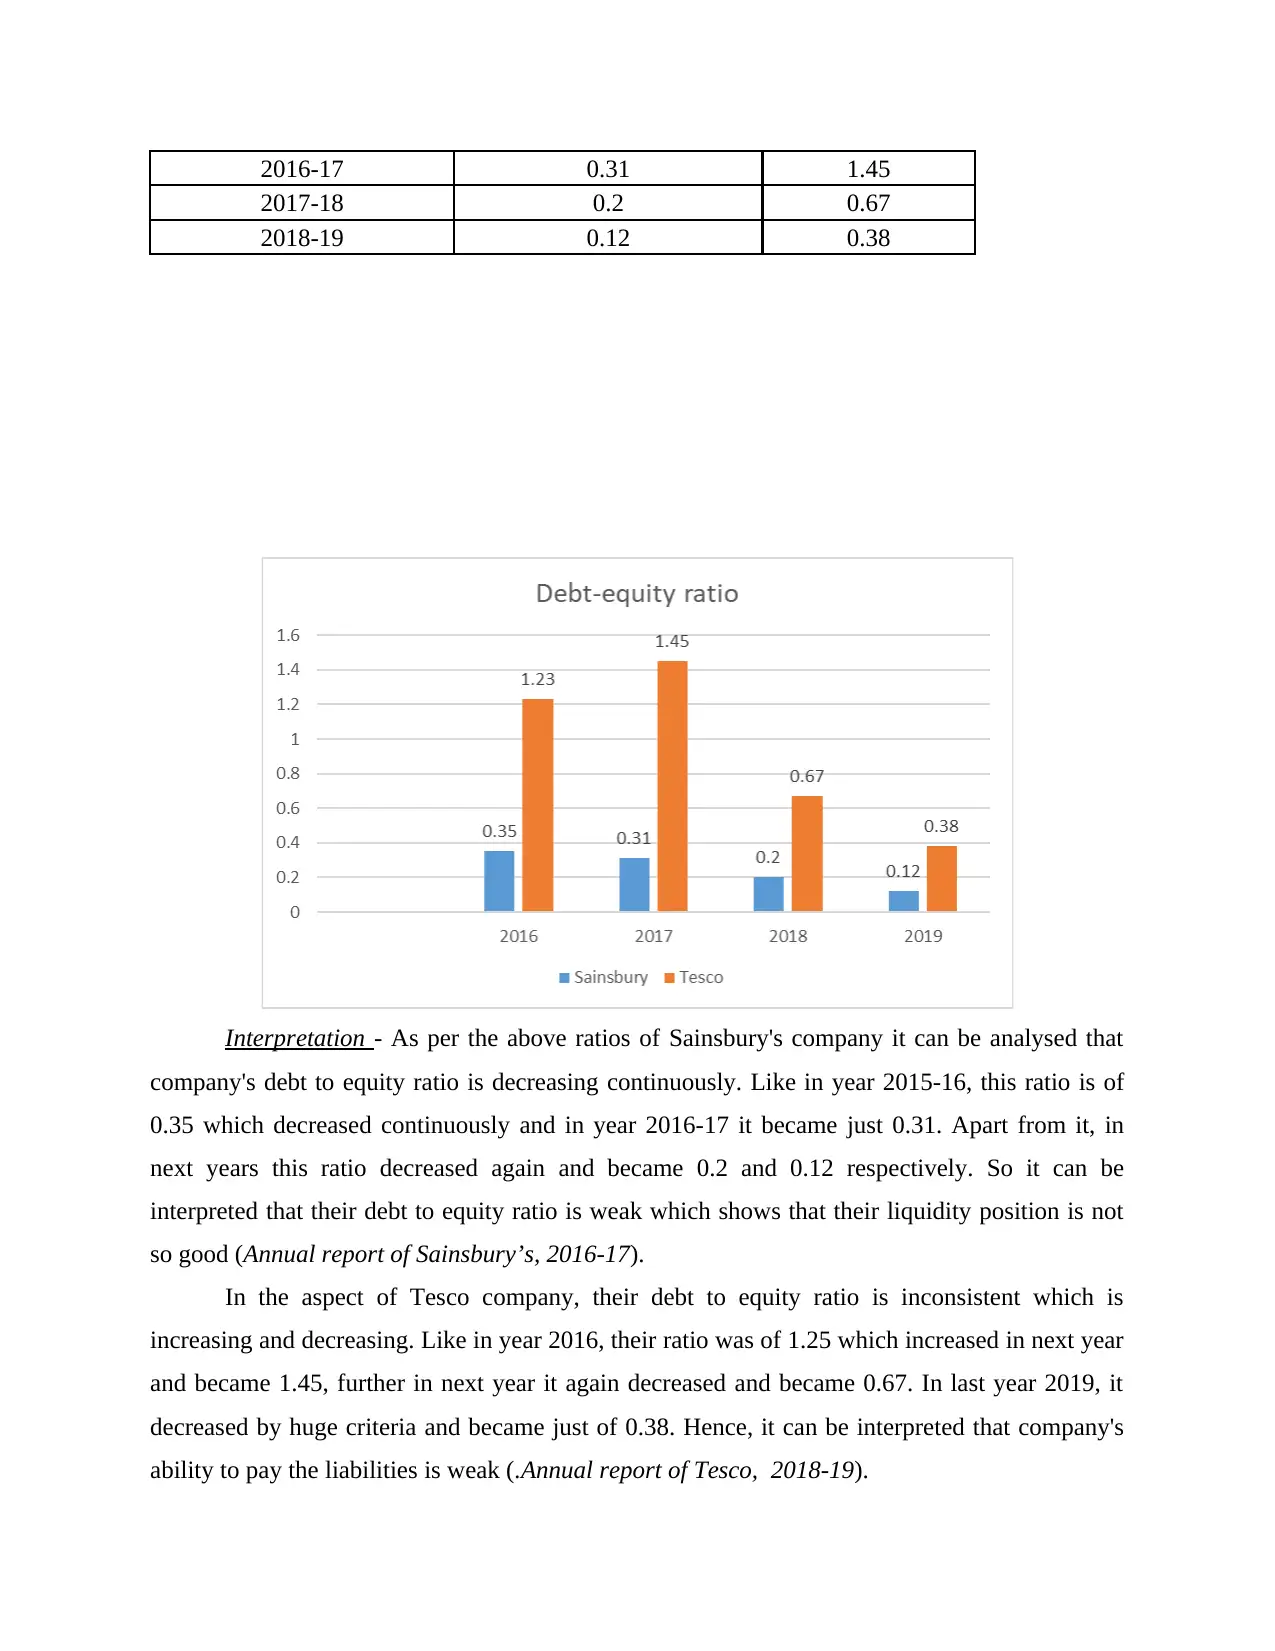
2016-17 0.31 1.45
2017-18 0.2 0.67
2018-19 0.12 0.38
Interpretation - As per the above ratios of Sainsbury's company it can be analysed that
company's debt to equity ratio is decreasing continuously. Like in year 2015-16, this ratio is of
0.35 which decreased continuously and in year 2016-17 it became just 0.31. Apart from it, in
next years this ratio decreased again and became 0.2 and 0.12 respectively. So it can be
interpreted that their debt to equity ratio is weak which shows that their liquidity position is not
so good (Annual report of Sainsbury’s, 2016-17).
In the aspect of Tesco company, their debt to equity ratio is inconsistent which is
increasing and decreasing. Like in year 2016, their ratio was of 1.25 which increased in next year
and became 1.45, further in next year it again decreased and became 0.67. In last year 2019, it
decreased by huge criteria and became just of 0.38. Hence, it can be interpreted that company's
ability to pay the liabilities is weak (.Annual report of Tesco, 2018-19).
⊘ This is a preview!⊘
Do you want full access?
Subscribe today to unlock all pages.
Trusted by 1+ million students worldwide
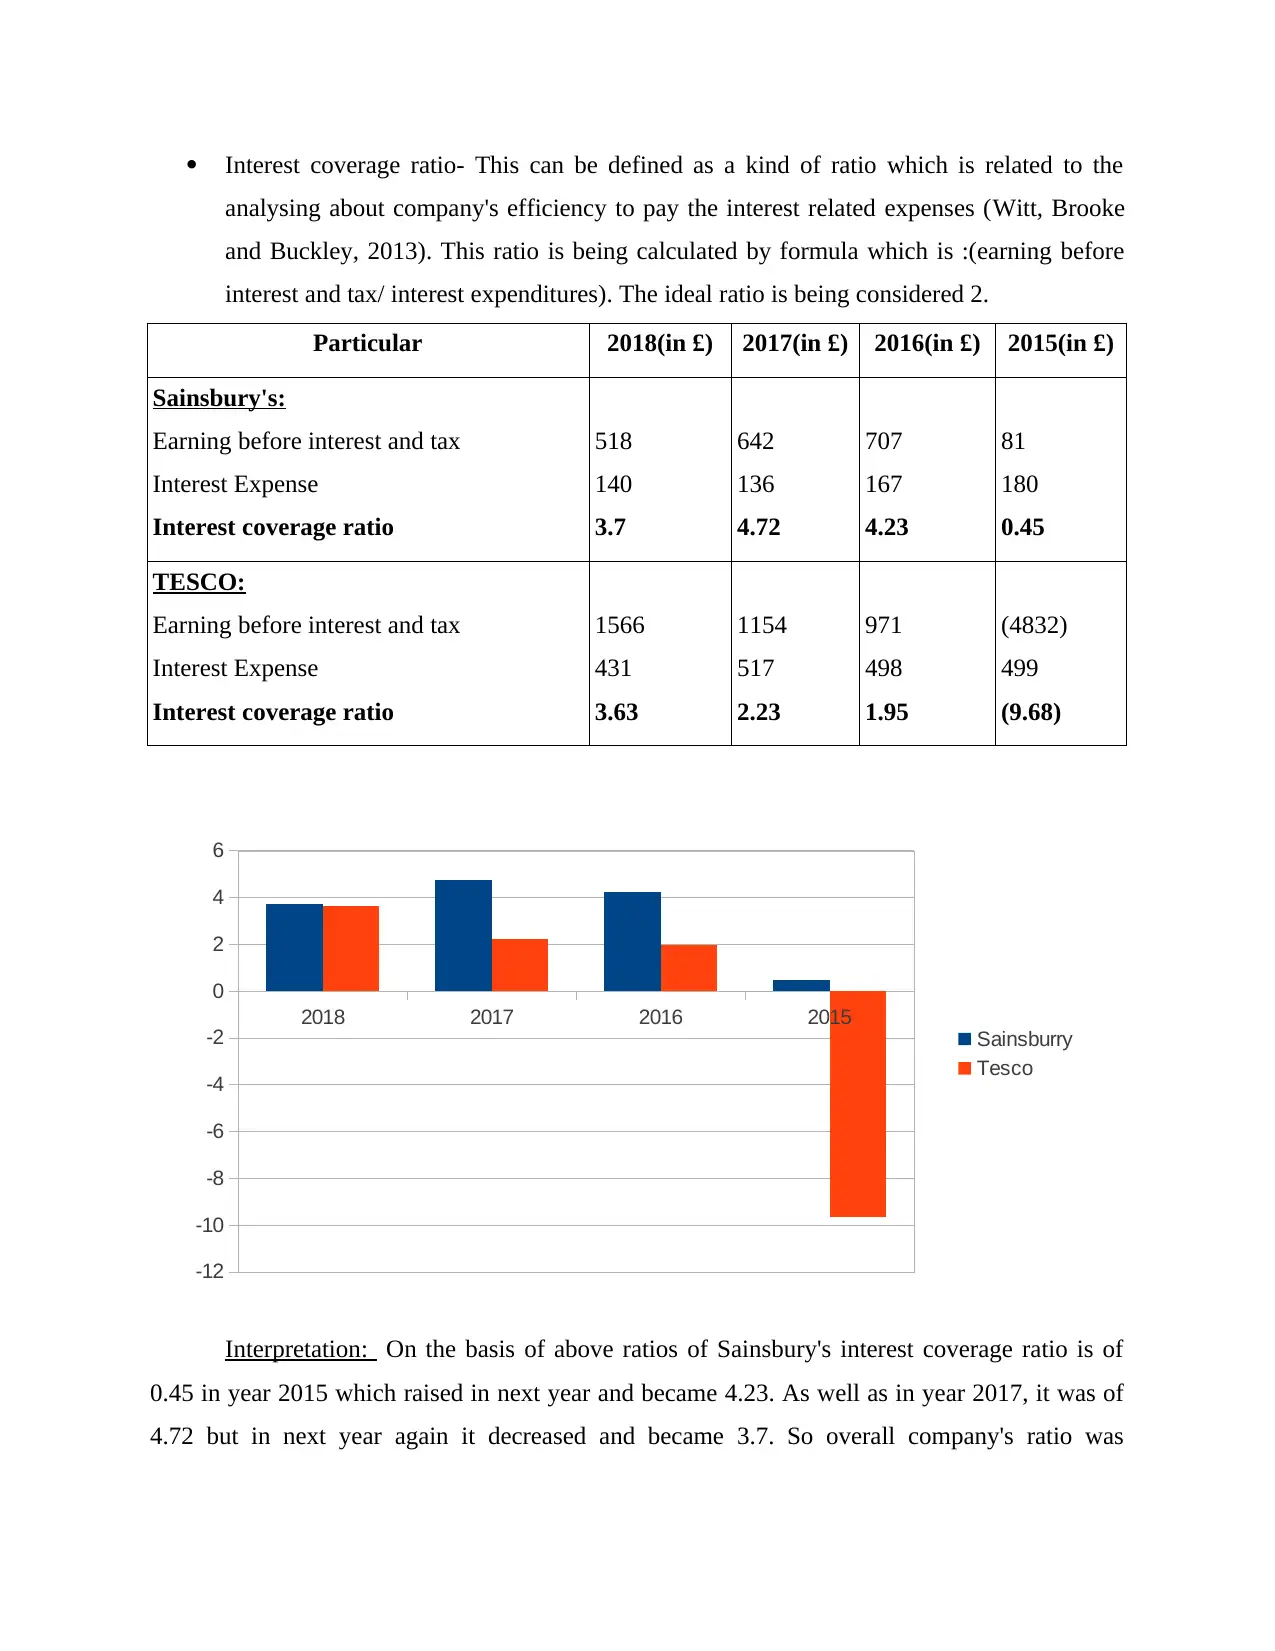
Interest coverage ratio- This can be defined as a kind of ratio which is related to the
analysing about company's efficiency to pay the interest related expenses (Witt, Brooke
and Buckley, 2013). This ratio is being calculated by formula which is :(earning before
interest and tax/ interest expenditures). The ideal ratio is being considered 2.
Particular 2018(in £) 2017(in £) 2016(in £) 2015(in £)
Sainsbury's:
Earning before interest and tax
Interest Expense
Interest coverage ratio
518
140
3.7
642
136
4.72
707
167
4.23
81
180
0.45
TESCO:
Earning before interest and tax
Interest Expense
Interest coverage ratio
1566
431
3.63
1154
517
2.23
971
498
1.95
(4832)
499
(9.68)
2018 2017 2016 2015
-12
-10
-8
-6
-4
-2
0
2
4
6
Sainsburry
Tesco
Interpretation: On the basis of above ratios of Sainsbury's interest coverage ratio is of
0.45 in year 2015 which raised in next year and became 4.23. As well as in year 2017, it was of
4.72 but in next year again it decreased and became 3.7. So overall company's ratio was
Paraphrase This Document
Need a fresh take? Get an instant paraphrase of this document with our AI Paraphraser
fluctuating in four years continuously. Hence, it can be interpreted that company's situation is
better except year 2015 because in all the years their ratio is above 2.
In the aspect of Tesco company, their interest coverage ratio is of (9.68) in negative
manner which increased in next year and became 1.95. Along with in year 2017, this ratio was of
2.23 that increased in year 2018 and became 3.63. So overall company's solvency condition is
average.
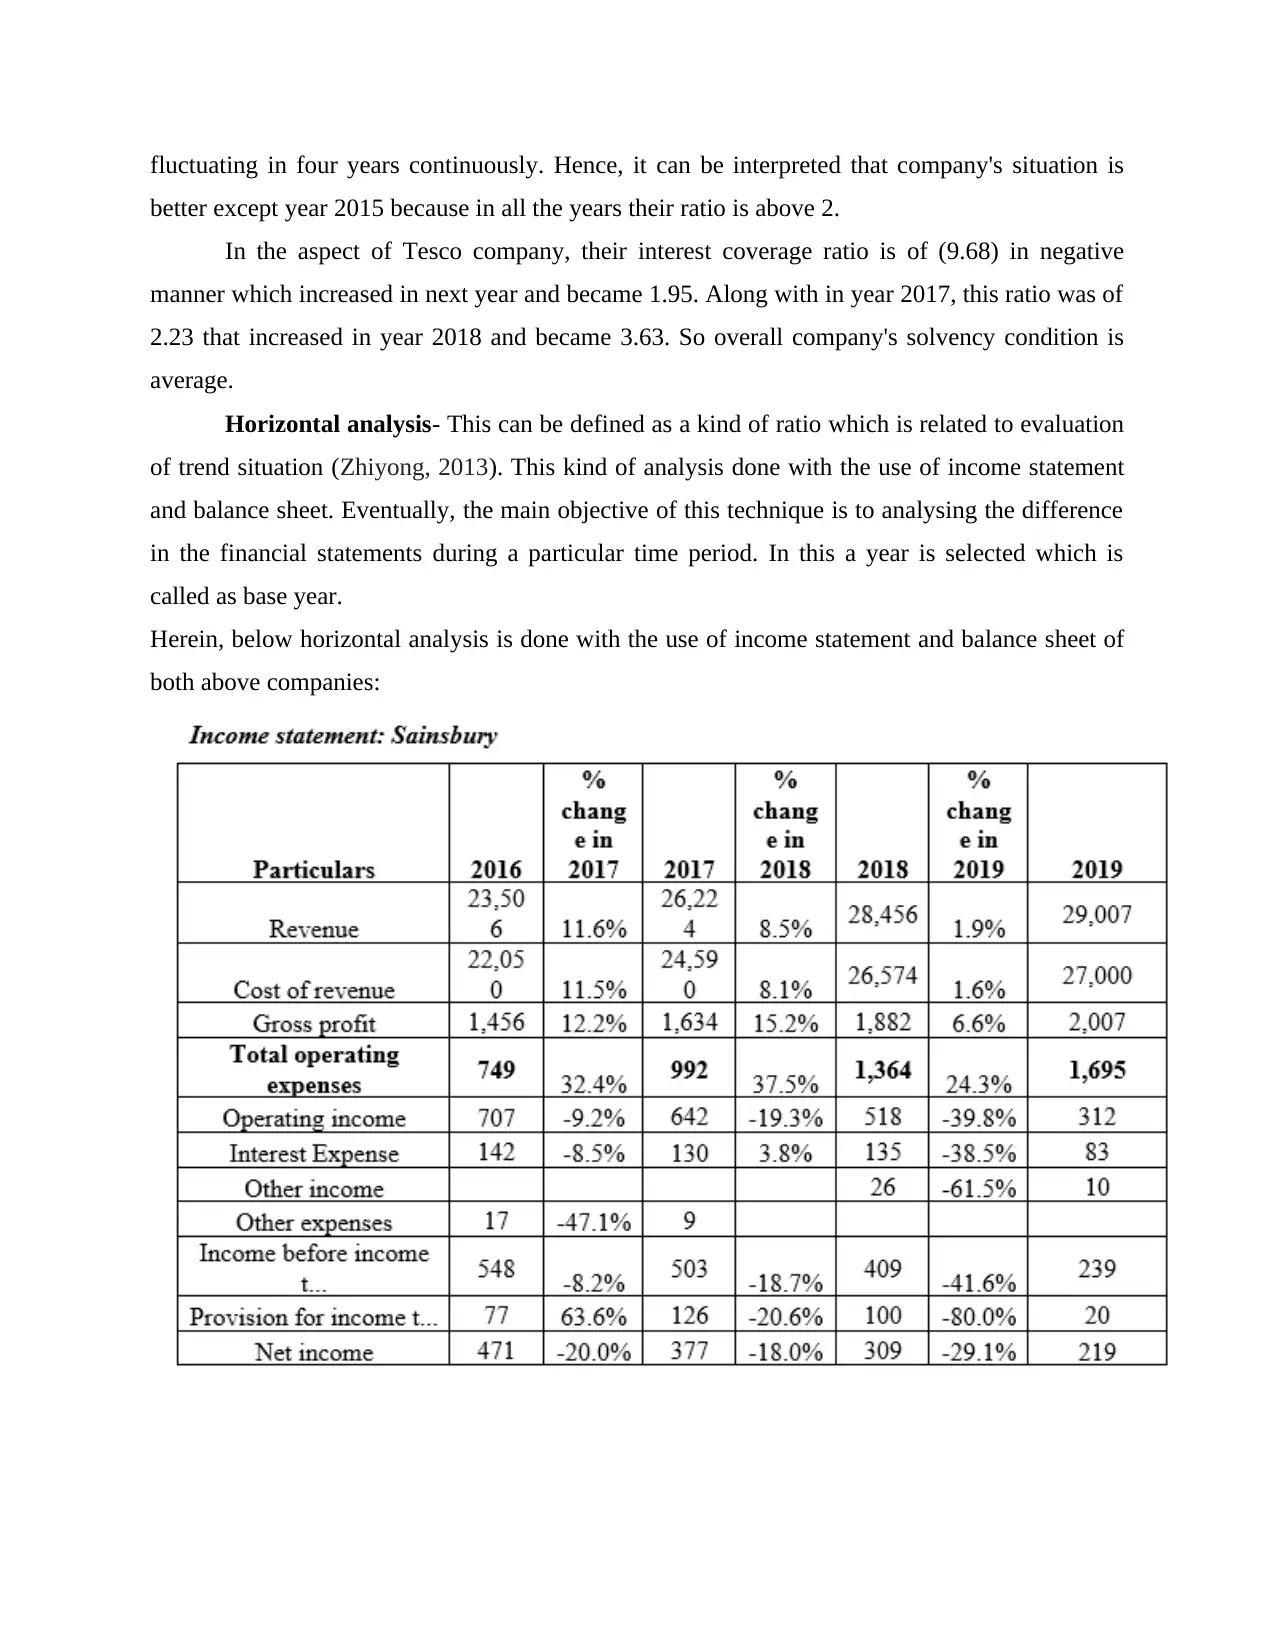
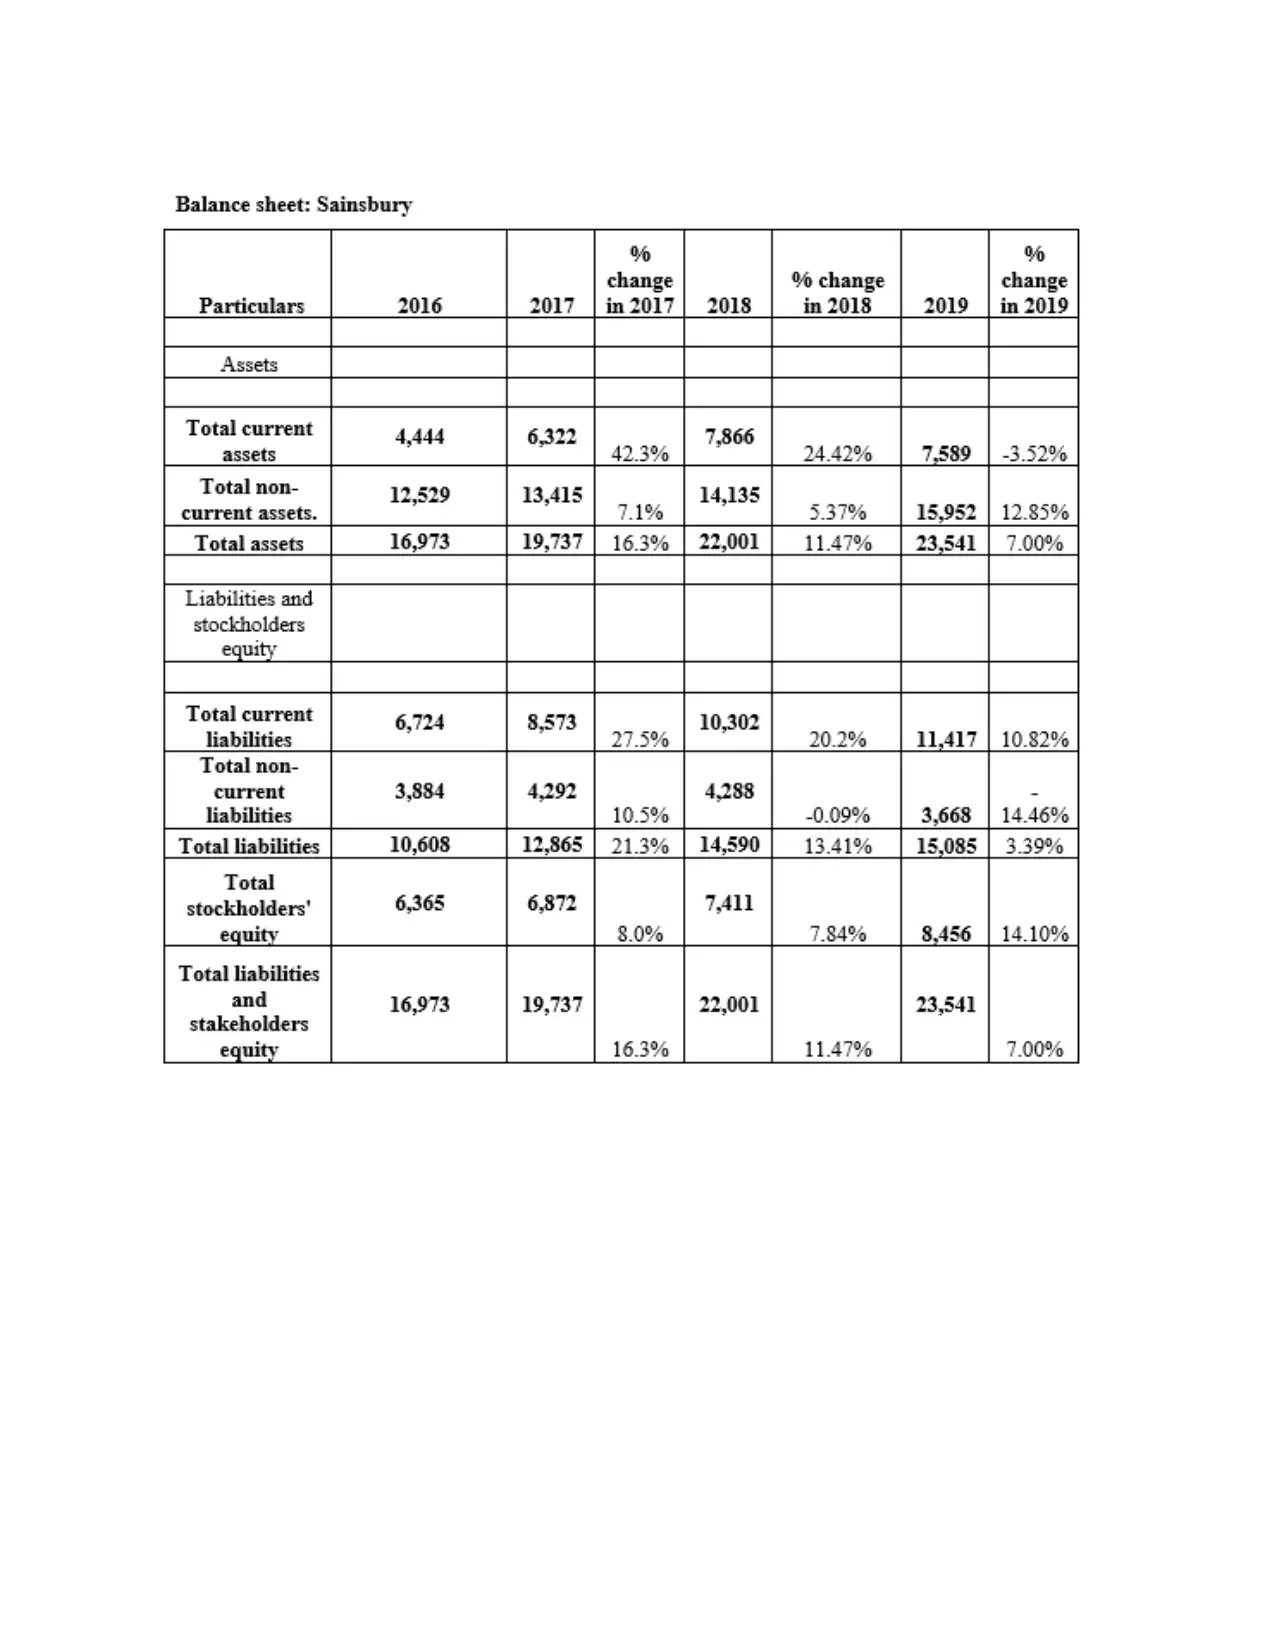
Horizontal analysis- This can be defined as a kind of ratio which is related to evaluation
of trend situation (Zhiyong, 2013). This kind of analysis done with the use of income statement
and balance sheet. Eventually, the main objective of this technique is to analysing the difference
in the financial statements during a particular time period. In this a year is selected which is
called as base year.
Herein, below horizontal analysis is done with the use of income statement and balance sheet of
both above companies:
better except year 2015 because in all the years their ratio is above 2.
In the aspect of Tesco company, their interest coverage ratio is of (9.68) in negative
manner which increased in next year and became 1.95. Along with in year 2017, this ratio was of
2.23 that increased in year 2018 and became 3.63. So overall company's solvency condition is
average.
Horizontal analysis- This can be defined as a kind of ratio which is related to evaluation
of trend situation (Zhiyong, 2013). This kind of analysis done with the use of income statement
and balance sheet. Eventually, the main objective of this technique is to analysing the difference
in the financial statements during a particular time period. In this a year is selected which is
called as base year.
Herein, below horizontal analysis is done with the use of income statement and balance sheet of
both above companies:
⊘ This is a preview!⊘
Do you want full access?
Subscribe today to unlock all pages.
Trusted by 1+ million students worldwide
1 out of 24
Related Documents


Your All-in-One AI-Powered Toolkit for Academic Success.
+13062052269
info@desklib.com
Available 24*7 on WhatsApp / Email
![[object Object]](/_next/static/media/star-bottom.7253800d.svg)
Unlock your academic potential
Copyright © 2020–2026 A2Z Services. All Rights Reserved. Developed and managed by ZUCOL.