Statistical Analysis of Salaries by Gender and Occupation in Australia
VerifiedAdded on  2021/05/30
|11
|1942
|358
Report
AI Summary
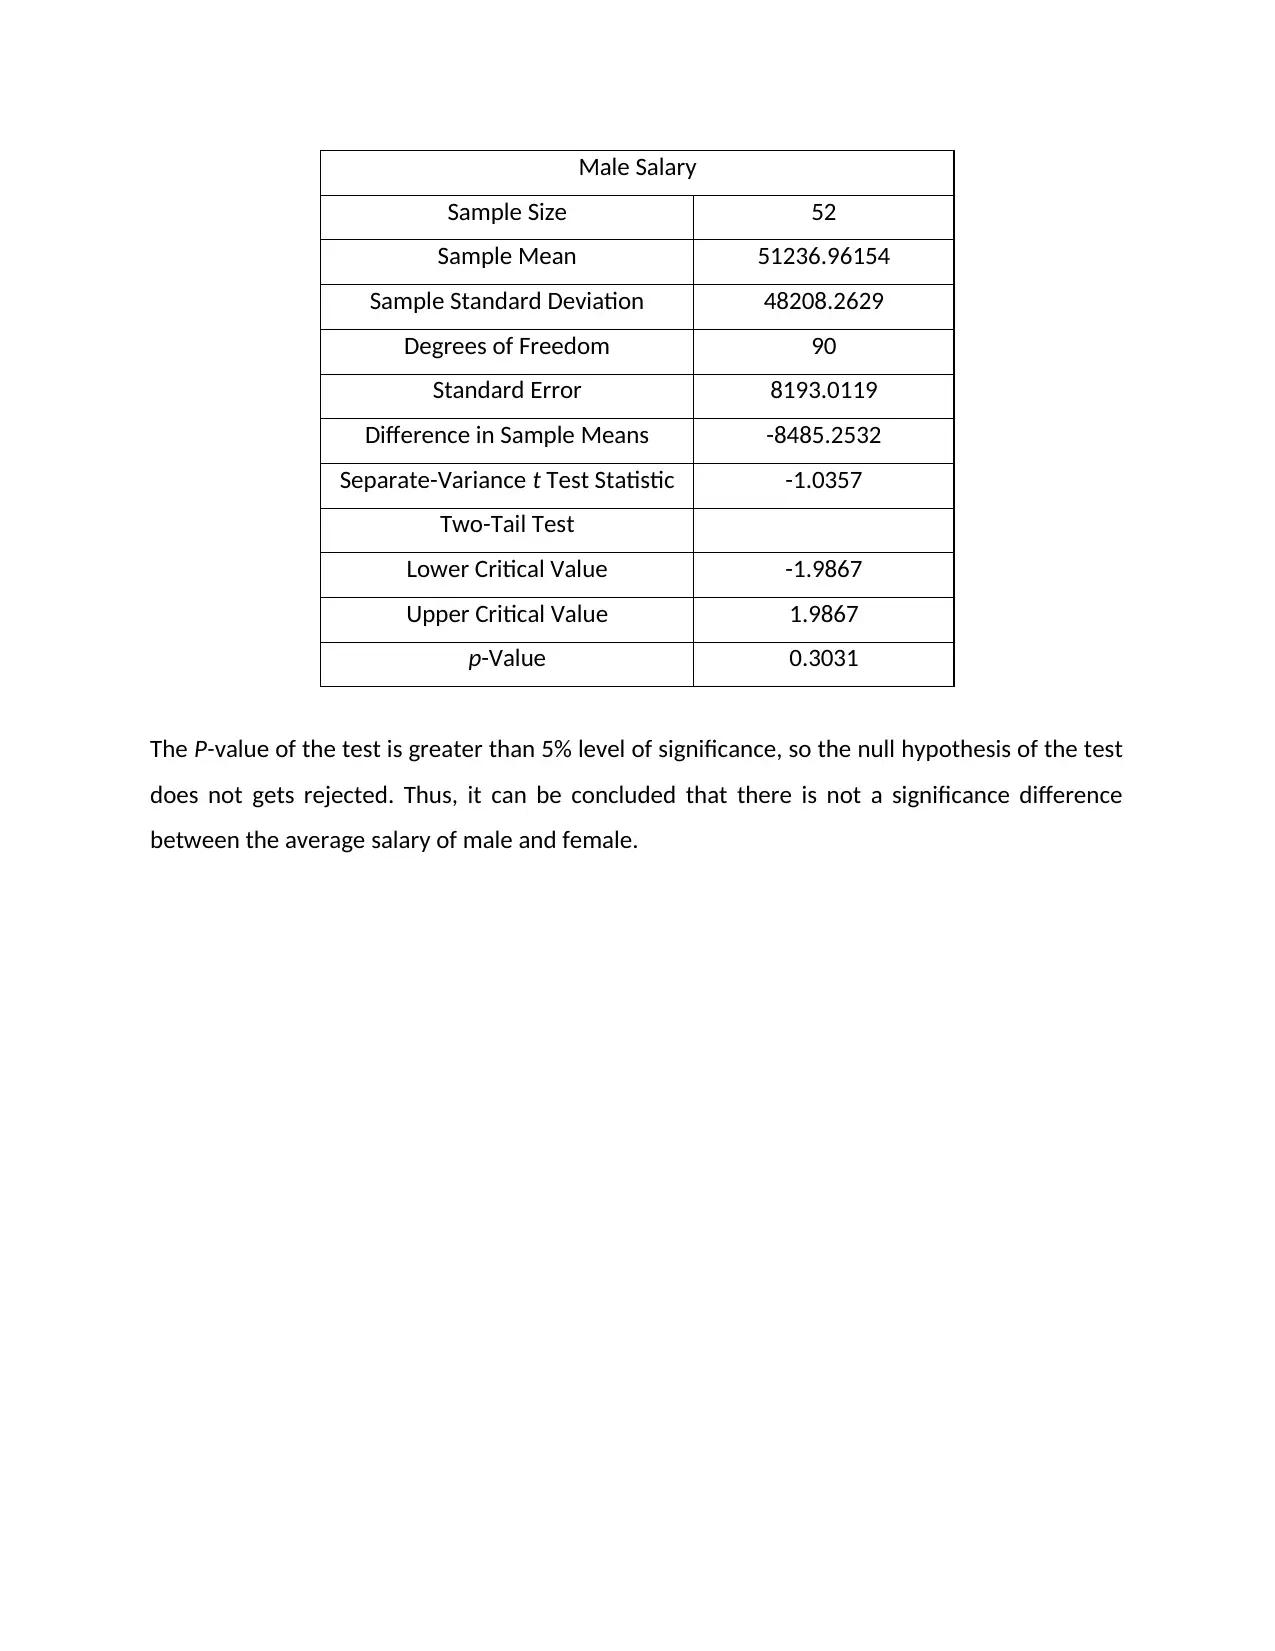
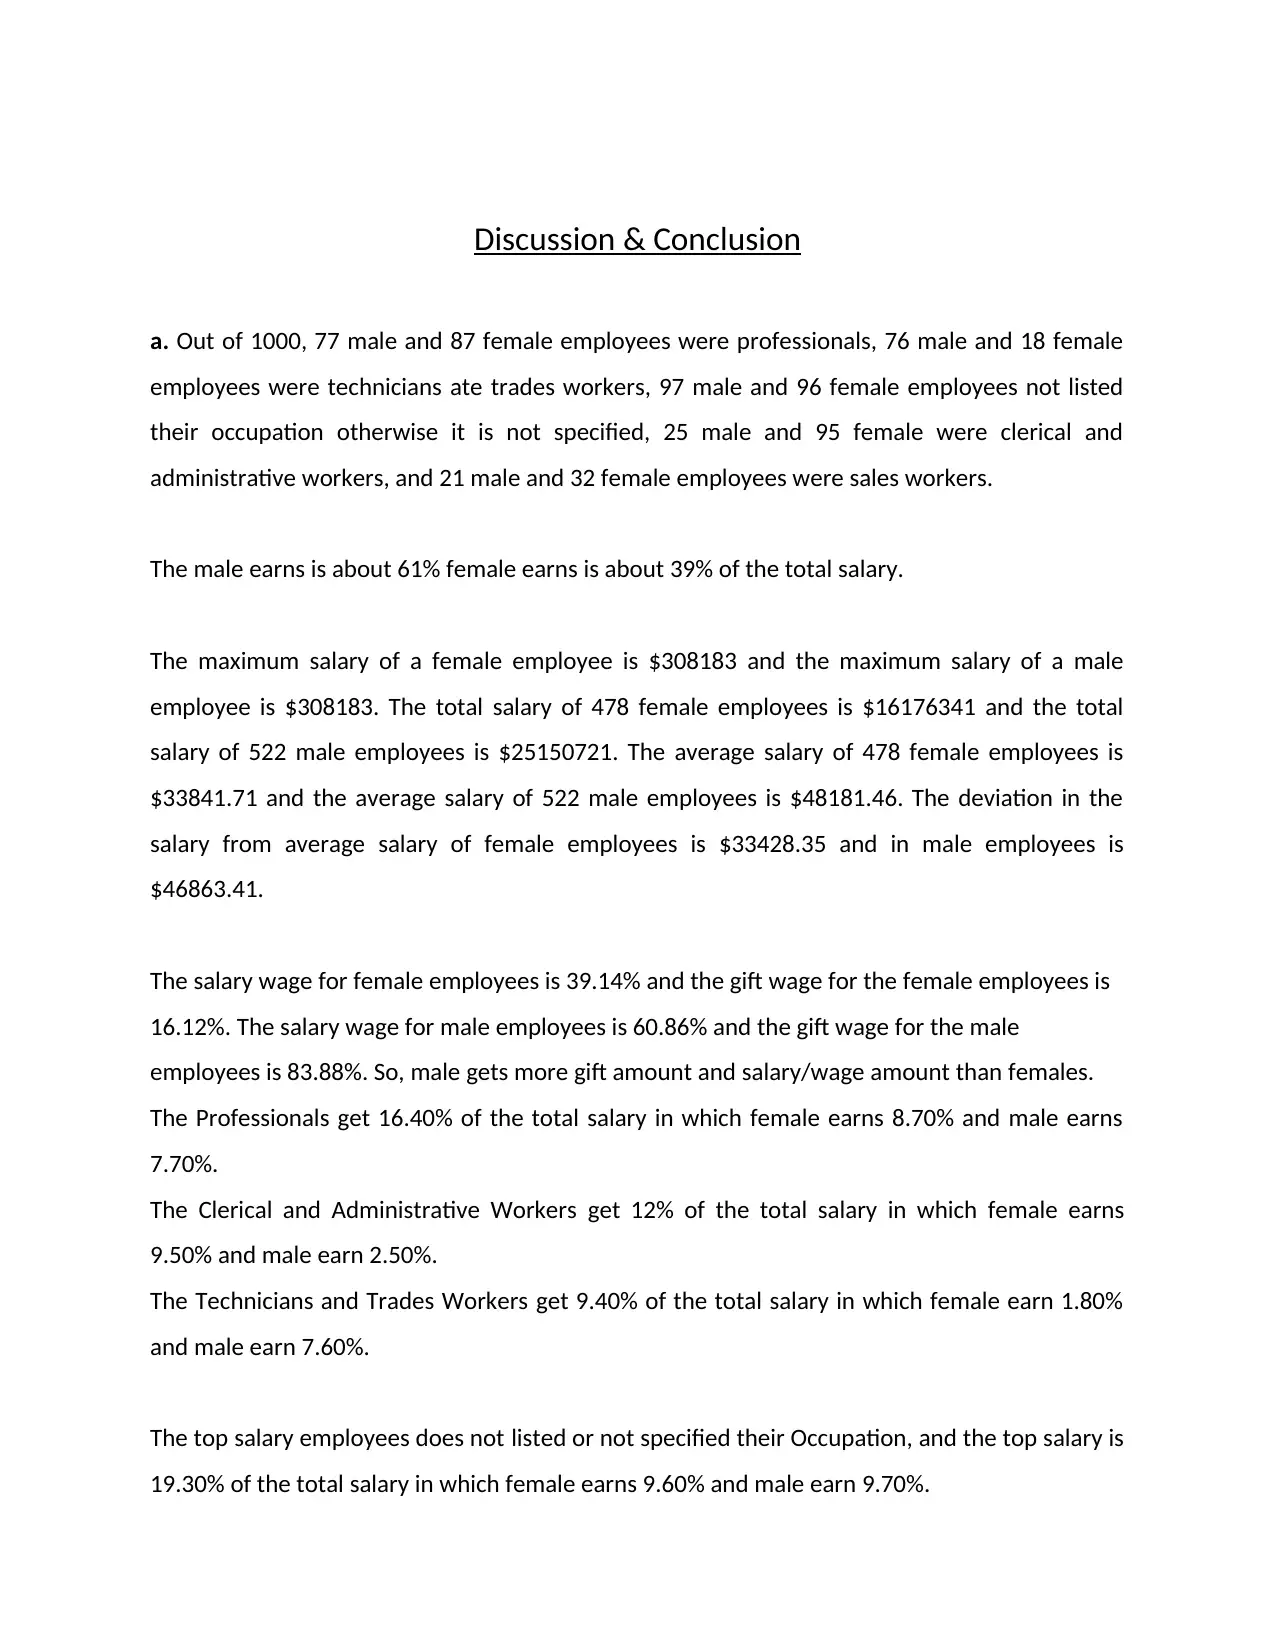
This report presents a comprehensive analysis of salary data in Australia, focusing on the relationships between gender, occupation, and income. The study utilizes two datasets: one from the Australian Taxation Office (ATO) and another collected through a survey. The analysis employs descriptive statistics, including bar graphs, pie charts, and numerical summaries, to illustrate the distribution of salaries across different genders and occupations. Inferential statistics, such as one-sample Z-tests and two-sample t-tests, are used to determine significant differences in salary levels. The report investigates whether there are significant differences in average salaries between genders, examines the proportion of male machinery operators and drivers, and explores the top-earning occupations. The findings reveal discrepancies between the datasets, highlighting the importance of large sample sizes and comprehensive data collection for accurate and generalizable results. The report concludes with a discussion of the results, limitations, and recommendations for future research.
Contribute Materials
Your contribution can guide someone’s learning journey. Share your
documents today.

Table of Contents
Introduction:....................................................................................................................................2
Descriptive Statistics:.......................................................................................................................4
Inferential Statistics:........................................................................................................................7
Discussion & Conclusion................................................................................................................12
Secure Best Marks with AI Grader
Need help grading? Try our AI Grader for instant feedback on your assignments.

Introduction
a. The article is based on the analysis of salaries and occupation of different gender. The data
for the study has been provided by Australian Taxation Office (ATO) for a particular location in
Australia.
The requirement of the study is to know about the relationship between salaries and
occupation for different gender. So, consider the research question of the study as, whether
there is a significance difference between the average salaries of different gender. To analysis a
research question, the data has been collected for a particular location in Australia.
b. The dataset 1 has been provided by Australian Taxation Office (ATO) for a particular location
in Australia which holds the taxation data. Thus, dataset 1 has been obtained from other
source, so it can be consider as a secondary data. The dataset 1 consists data of 1000
employees which have 4 variables that are Gender, Occupation code, salary/wage amount and
the gift amount. The variable gender has divided into two categories as female and male, so it is
a nominal level variable. The variable occupation code specifies the occupation of the
employees which has divided into 10 categories, so it is a nominal level variable. The variable
salary/wage amount indicates the salary of the employees, so it interval/ratio level variable.
The gift amount indicates the gift or donation deductions, so it interval/ratio level variable. The
first five values of the dataset 1 is shown below;
Gend
er
Occ_co
de
Sw_a
mt
Gift_a
mt
Male 9 31304 0
Fema
le 0 0 27
Fema
le 2 86934 0
Fema 4 28649 144

le
Fema
le 3 69620 0
c. The dataset 2 has been collected randomly by offline survey, the researcher asked questions
to working people about their gender, position and the income amount. Thus dataset 2 is a
primary data.
The dataset covers 100 values which is greater than 30, so the results from the study will not be
biased. The dataset have 3 variables that are Gender, Occupation code, salary/wage amount.
The variable gender has been divided into two categories as female and male, so it is a nominal
level of measurement. The variable occupation code indicates the occupation of the employees
which has been divided into 10 categories, so it is a nominal level of measurement. The variable
salary/wage amount indicates the salary of the employees, so it interval/ratio level of
measurement.

Descriptive Statistics:
a. The bar graph for the relationship between variable Gender and the occupation is shown
below:
Occupation not listed/ Occupation not specified
Managers
Professionals
Technicians and Trades Workers
Community and Personal Service Workers
Clerical and Administrative Workers
Sales workers
Machinery operators and drivers
Labourers
Consultants, apprentices and type not specified or
not listed
0 20 40 60 80 100 120
96
29
87
18
57
95
32
2
29
33
97
51
77
76
26
25
21
44
59
46
Male Female
The above bar plot indicates, Out of 1000, 77 male and 87 female employees were
professionals, 76 male and 18 female employees were technicians ate trades workers, 97 male
and 96 female employees not listed their occupation otherwise it is not specified, 25 male and
Secure Best Marks with AI Grader
Need help grading? Try our AI Grader for instant feedback on your assignments.

95 female were clerical and administrative workers, and 21 male and 32 female employees
were sales workers.
b. The pie chart for the relationship between variable Gender and the salary/Wage amount is
shown below:
39%
61%
Female
Male
The male earns is about 61% female earns is about 39% of the total salary.
c. The numerical summary for the relationship between variable Gender and the salary/Wage
amount is shown below:
Row Labels
Average of
Sw_amt
Sum of
Sw_amt
Max of
Sw_amt3
Count of
Sw_amt2
StdDev of
Sw_amt4
Female 33841.72 16176341 308183 478 33428.35
Male 48181.46 25150721 308183 522 46863.41
Grand total 41327.062 41327062 308183 1000 41596.55031

The maximum salary of a female employee is $308183 and the maximum salary of a male
employee is $308183. The total salary of 478 female employees is $16176341 and the total salary
of 522 male employees is $25150721. The average salary of 478 female employees is $33841.71
and the average salary of 522 male employees is $48181.46. The deviation in the salary from
average salary of female employees is $33428.35 and in male employees is $46863.41.
d. The graphical summary for the relationship between variable Salary/Wage amount and Gift
amount is shown below:
Female
Male
0.00%
20.00%
40.00%
60.00%
80.00%
100.00%
120.00%
140.00%
160.00%
39.14%
60.86%
16.12%
83.88%
Sum of Sw_amt
Sum of Gift_amt
The salary wage for female employees is 39.14% and the gift wage for the female employees is
16.12%. The salary wage for male employees is 60.86% and the gift wage for the male
employees is 83.88%. So, male gets more gift amount and salary/wage amount than females.

Inferential Statistics:
a. The top 4 occupation based on median salary and the proportion of the gender
is shown below:
Occupation description Female Male Grand Total
Occupation not listed/ Occupation not specified 9.60% 9.70% 19.30%
Professionals 8.70% 7.70% 16.40%
Clerical and Administrative Workers 9.50% 2.50% 12.00%
Technicians and Trades Workers 1.80% 7.60% 9.40%
The Professionals get 16.40% of the total salary in which female earns 8.70% and male earns
7.70%. The Clerical and Administrative Workers get 12% of the total salary in which female
earns 9.50% and male earn 2.50%. The Technicians and Trades Workers get 9.40% of the total
salary in which female earn 1.80% and male earn 7.60%. The top salary employees does not
listed or not specified their Occupation, and the top salary is 19.30% of the total salary in which
female earns 9.60% and male earn 9.70%.
b. To test whether the proportion of machinery operators and drivers who are male is more
than 80%, one sample Z-test will be used. The hypothesis of the test is given below:
The null hypothesis is . And, the alternative hypothesis .
The calculation are provided in Excel, the proportion of male the Machinery operators and
drivers is about 96%. The obtained results are shown below:
Paraphrase This Document
Need a fresh take? Get an instant paraphrase of this document with our AI Paraphraser

Null Hypothesis p = 0.8
Level of Significance 0.05
Number of Items of Interest 96
Sample Size 100
Sample Proportion 0.96
Standard Error 0.0400
Z Test Statistic 4.0000
Upper Critical Value 1.6449
p-Value 0.0000
The P-value of the test is less than 5% level of significance, so the null hypothesis of the test
gets rejected. Thus, it can be concluded that the proportion of machinery operators and drivers
who are male is more than 80%.
c. To test whether there is a difference in salary amount between gender, two-sample t-test will
be used. The hypothesis of the test is given below:
The null hypothesis is .
And, the alternative hypothesis is .
The ratio between the male samples to female sample is greater than 1.5. So, the separate
variance t-test will be used for analysis. The results of the test is shown below:
Hypothesized Difference 0
Level of Significance 0.05
Female Salary/Wage amount Sample
Sample Size 478
Sample Mean 33841.71757
Sample Standard Deviation 33428.3532
Male Salary/Wage amount Sample
Level of Significance 0.05
Number of Items of Interest 96
Sample Size 100
Sample Proportion 0.96
Standard Error 0.0400
Z Test Statistic 4.0000
Upper Critical Value 1.6449
p-Value 0.0000
The P-value of the test is less than 5% level of significance, so the null hypothesis of the test
gets rejected. Thus, it can be concluded that the proportion of machinery operators and drivers
who are male is more than 80%.
c. To test whether there is a difference in salary amount between gender, two-sample t-test will
be used. The hypothesis of the test is given below:
The null hypothesis is .
And, the alternative hypothesis is .
The ratio between the male samples to female sample is greater than 1.5. So, the separate
variance t-test will be used for analysis. The results of the test is shown below:
Hypothesized Difference 0
Level of Significance 0.05
Female Salary/Wage amount Sample
Sample Size 478
Sample Mean 33841.71757
Sample Standard Deviation 33428.3532
Male Salary/Wage amount Sample

Sample Size 522
Sample Mean 48181.45785
Sample Standard Deviation 46863.4081
Numerator of Degrees of Freedom 42837169748527.2000
Denominator of Degrees of Freedom 45432179135.9228
Total Degrees of Freedom 942.8817
Degrees of Freedom 942
Standard Error 2558.3219
Difference in Sample Means -14339.7403
Separate-Variance t Test Statistic -5.6051
p-Value 0.0000
The P-value of the test is less than 5% level of significance, so the null hypothesis of the test
gets rejected. Thus, it can be concluded that salary of male and female differ significantly.
d. To test whether there is a significance difference between the average salary of male and
female, two-sample t-test will be used. The hypothesis of the test is given below:
The null hypothesis is .
And, the alternative hypothesis is .
The ratio between the male samples to female sample is greater than 1.5. So, the separate
variance t-test will be used for analysis. The results of the test is shown below:
Hypothesized Difference 0
Level of Significance 0.05
Female Salary
Sample Size 48
Sample Mean 42751.70833
Sample Standard Deviation 32813.9723

Male Salary
Sample Size 52
Sample Mean 51236.96154
Sample Standard Deviation 48208.2629
Degrees of Freedom 90
Standard Error 8193.0119
Difference in Sample Means -8485.2532
Separate-Variance t Test Statistic -1.0357
Two-Tail Test
Lower Critical Value -1.9867
Upper Critical Value 1.9867
p-Value 0.3031
The P-value of the test is greater than 5% level of significance, so the null hypothesis of the test
does not gets rejected. Thus, it can be concluded that there is not a significance difference
between the average salary of male and female.
Secure Best Marks with AI Grader
Need help grading? Try our AI Grader for instant feedback on your assignments.

Discussion & Conclusion
a. Out of 1000, 77 male and 87 female employees were professionals, 76 male and 18 female
employees were technicians ate trades workers, 97 male and 96 female employees not listed
their occupation otherwise it is not specified, 25 male and 95 female were clerical and
administrative workers, and 21 male and 32 female employees were sales workers.
The male earns is about 61% female earns is about 39% of the total salary.
The maximum salary of a female employee is $308183 and the maximum salary of a male
employee is $308183. The total salary of 478 female employees is $16176341 and the total
salary of 522 male employees is $25150721. The average salary of 478 female employees is
$33841.71 and the average salary of 522 male employees is $48181.46. The deviation in the
salary from average salary of female employees is $33428.35 and in male employees is
$46863.41.
The salary wage for female employees is 39.14% and the gift wage for the female employees is
16.12%. The salary wage for male employees is 60.86% and the gift wage for the male
employees is 83.88%. So, male gets more gift amount and salary/wage amount than females.
The Professionals get 16.40% of the total salary in which female earns 8.70% and male earns
7.70%.
The Clerical and Administrative Workers get 12% of the total salary in which female earns
9.50% and male earn 2.50%.
The Technicians and Trades Workers get 9.40% of the total salary in which female earn 1.80%
and male earn 7.60%.
The top salary employees does not listed or not specified their Occupation, and the top salary is
19.30% of the total salary in which female earns 9.60% and male earn 9.70%.
1 out of 11
Related Documents

Your All-in-One AI-Powered Toolkit for Academic Success.
 +13062052269
info@desklib.com
Available 24*7 on WhatsApp / Email
Unlock your academic potential
© 2024  |  Zucol Services PVT LTD  |  All rights reserved.