Business Statistics Analysis: Salary, Satisfaction, and T-Tests

Verified

Added on  2020/03/28

|6
|762
|291
Homework Assignment
AI Summary
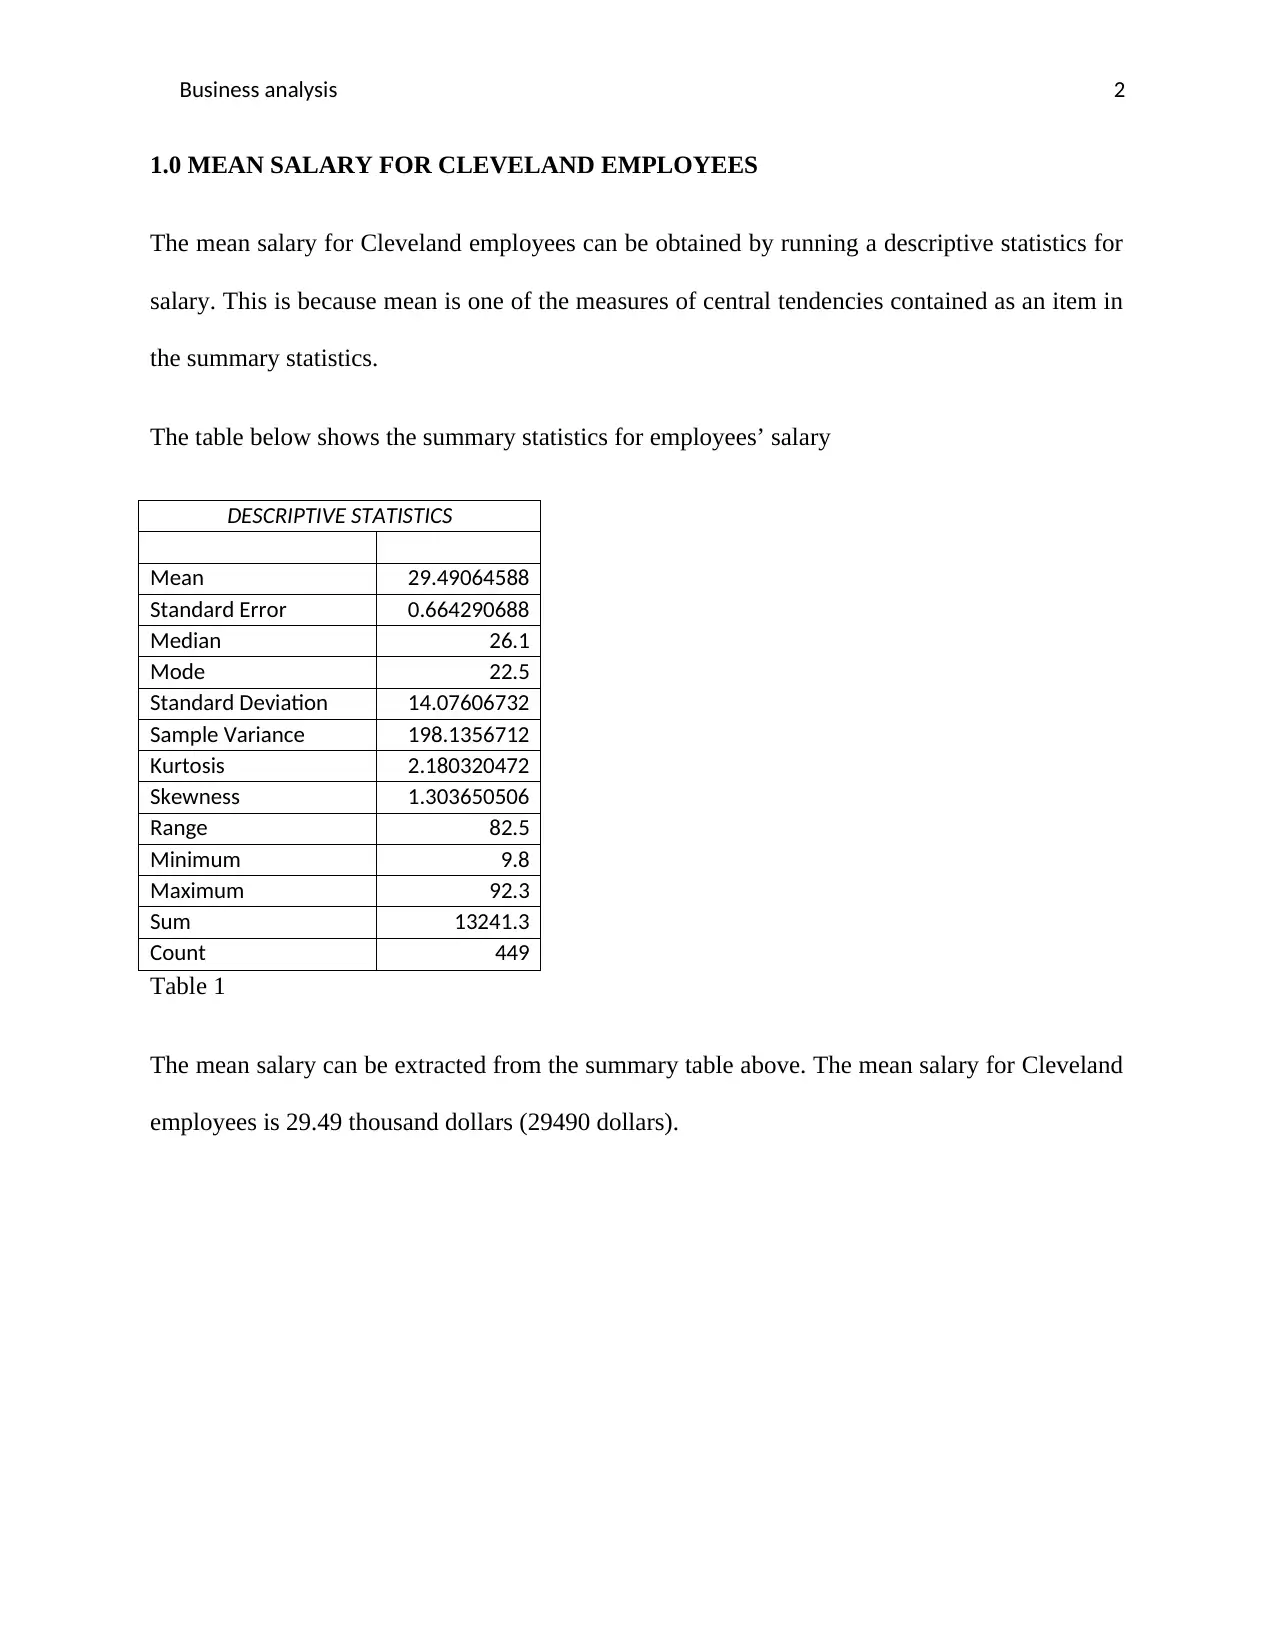
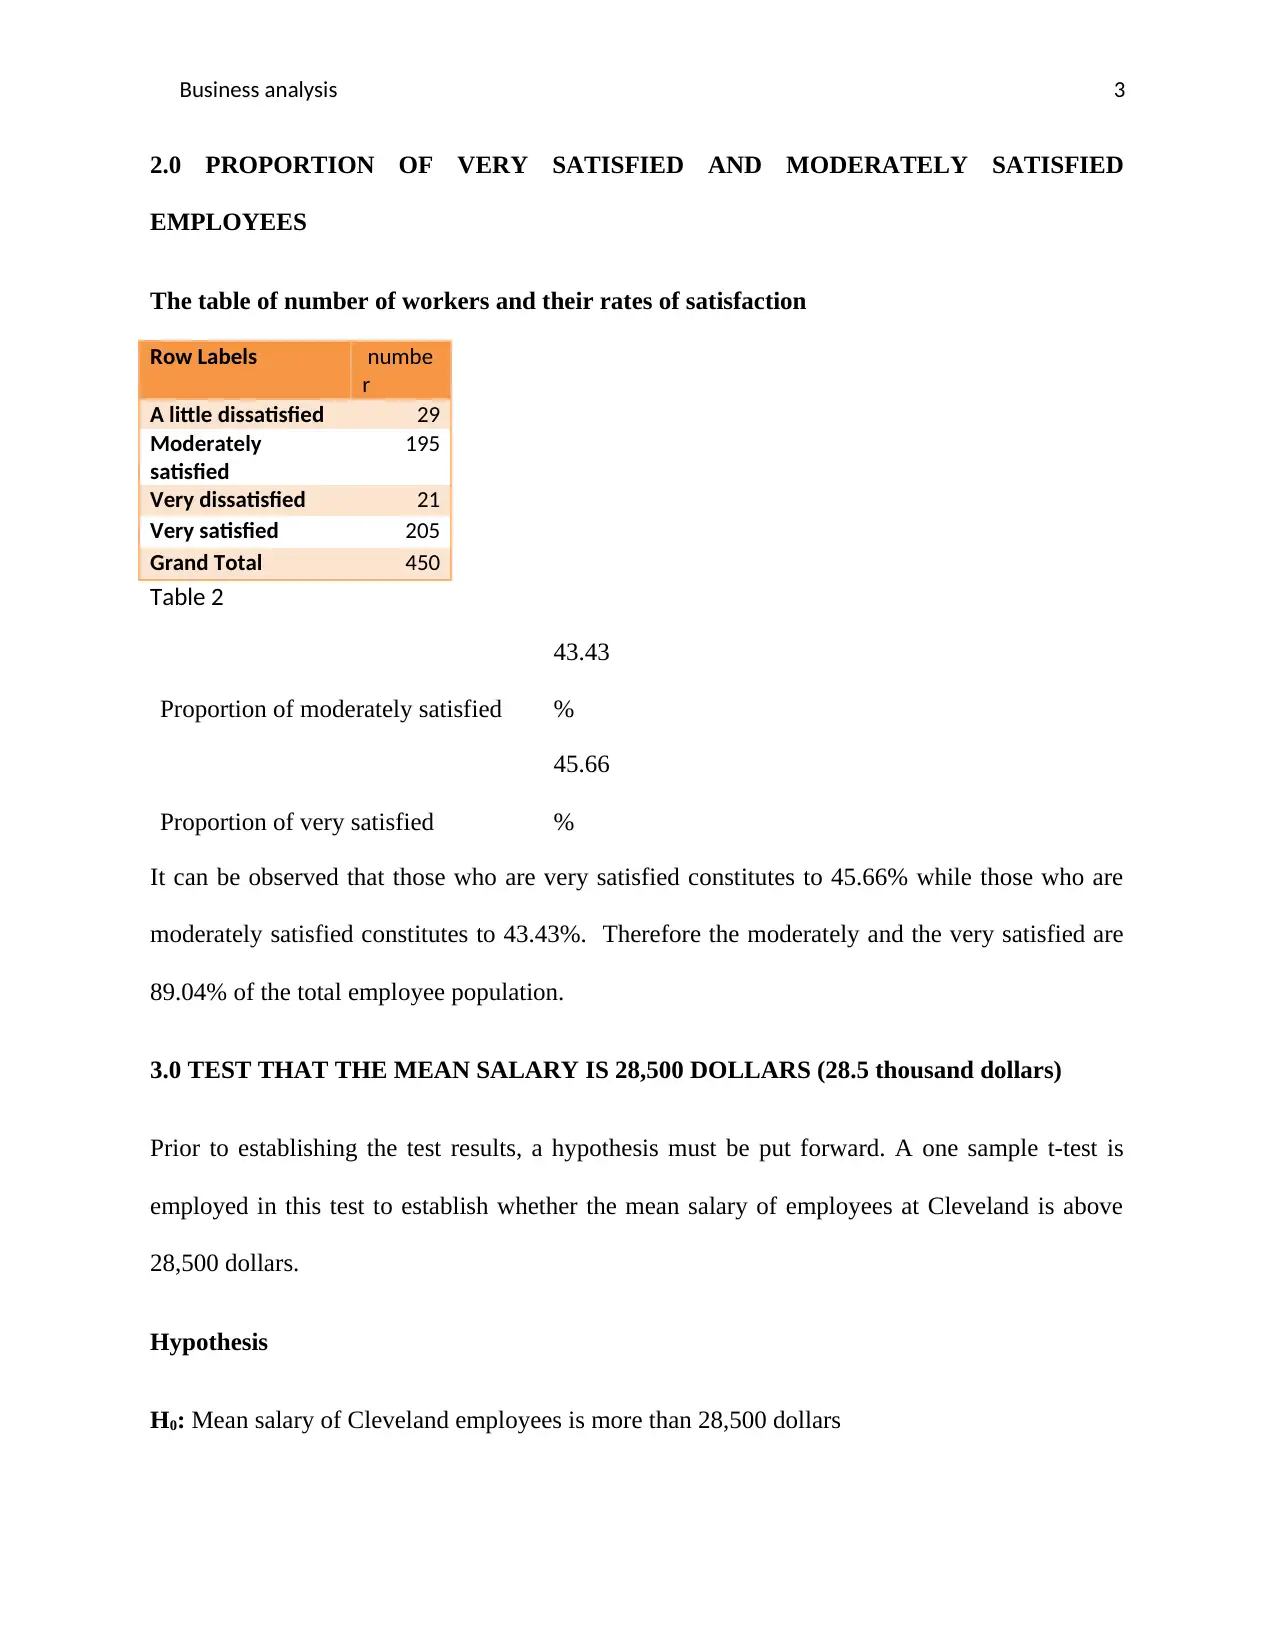
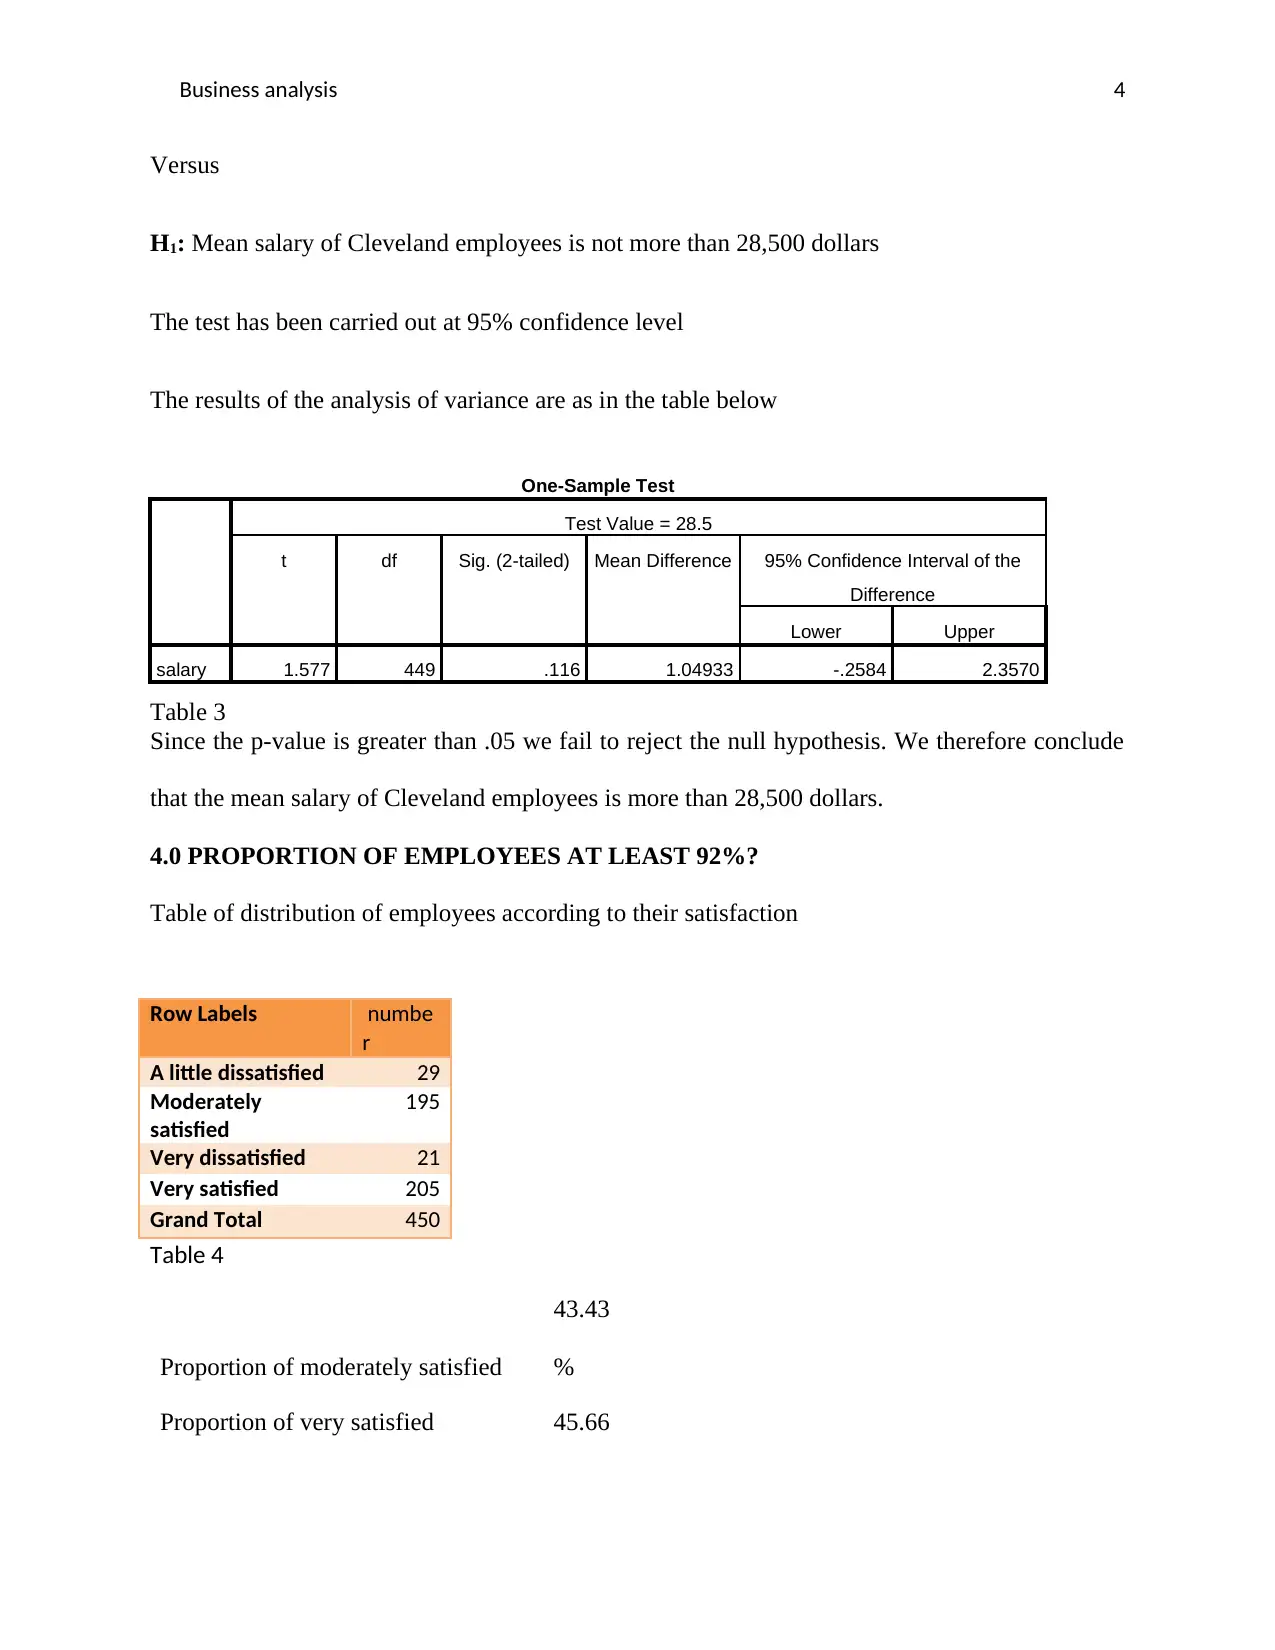
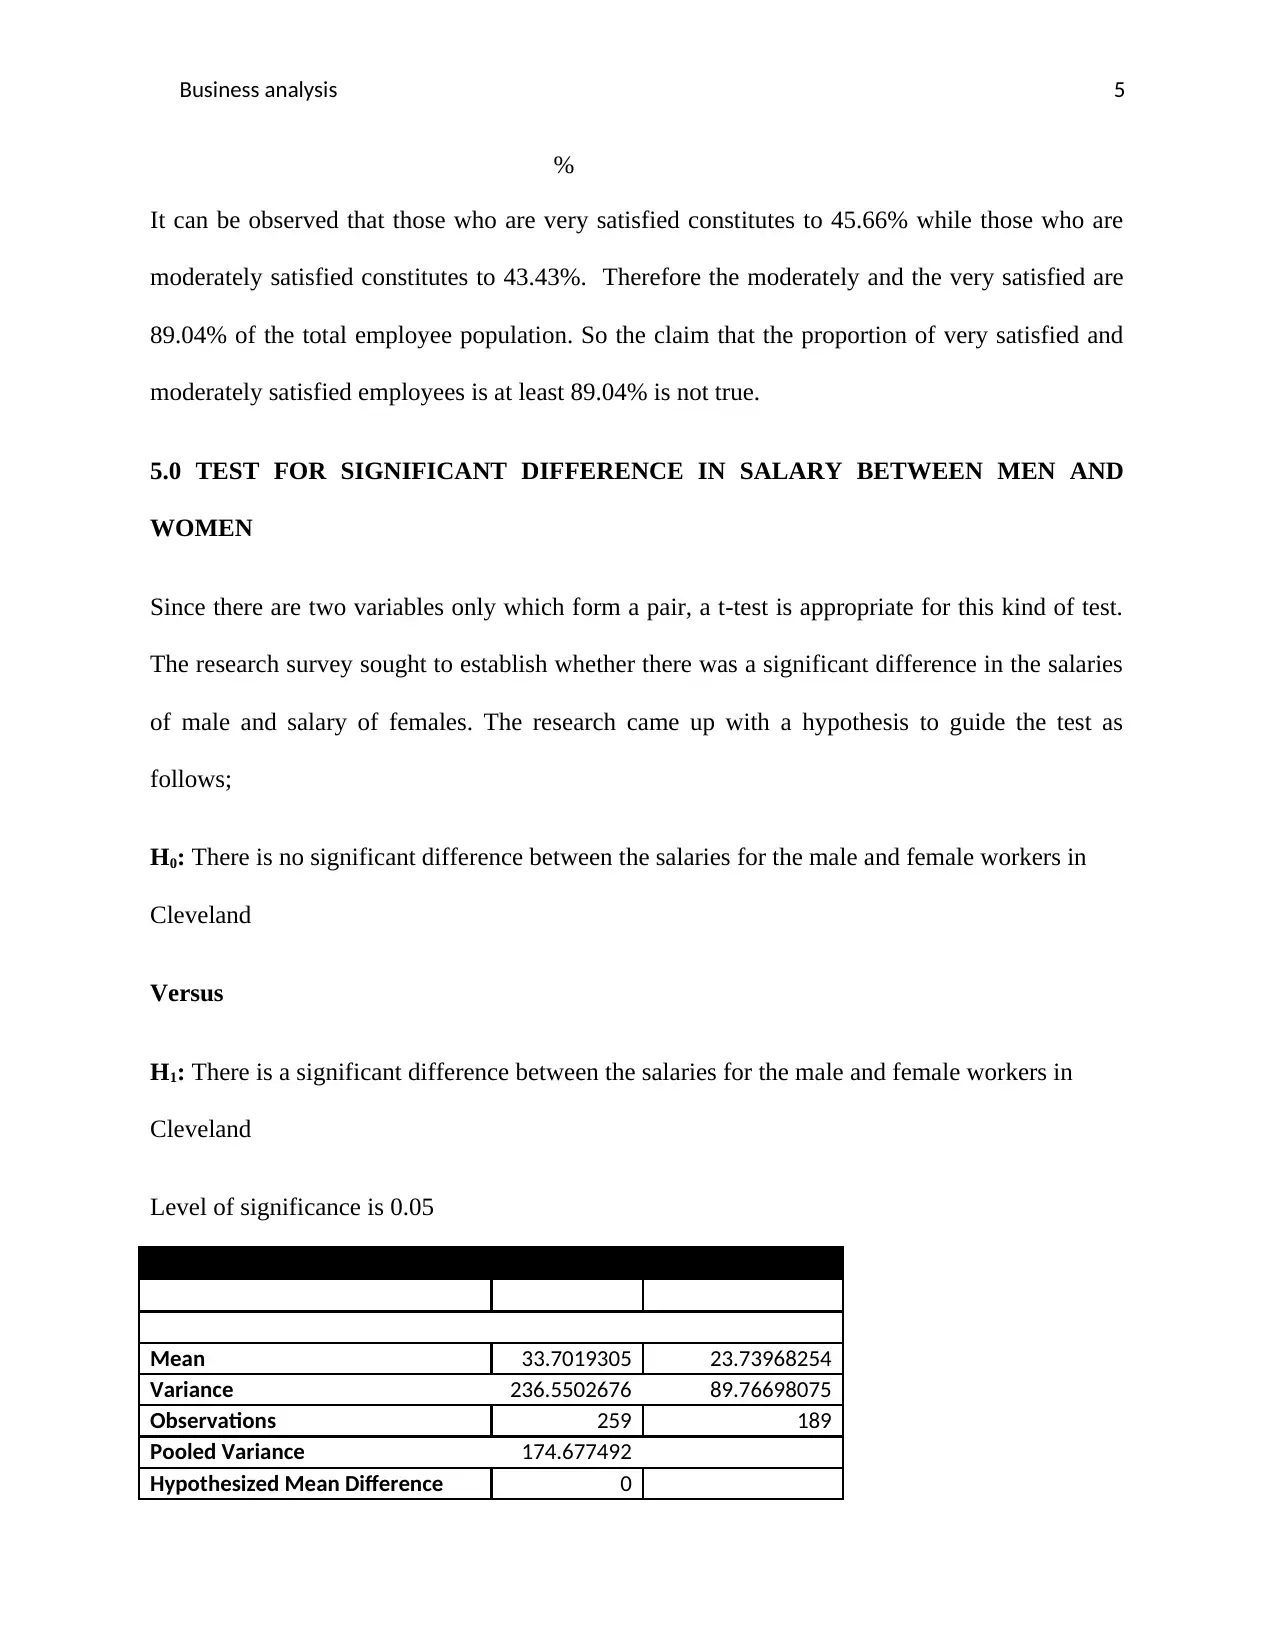
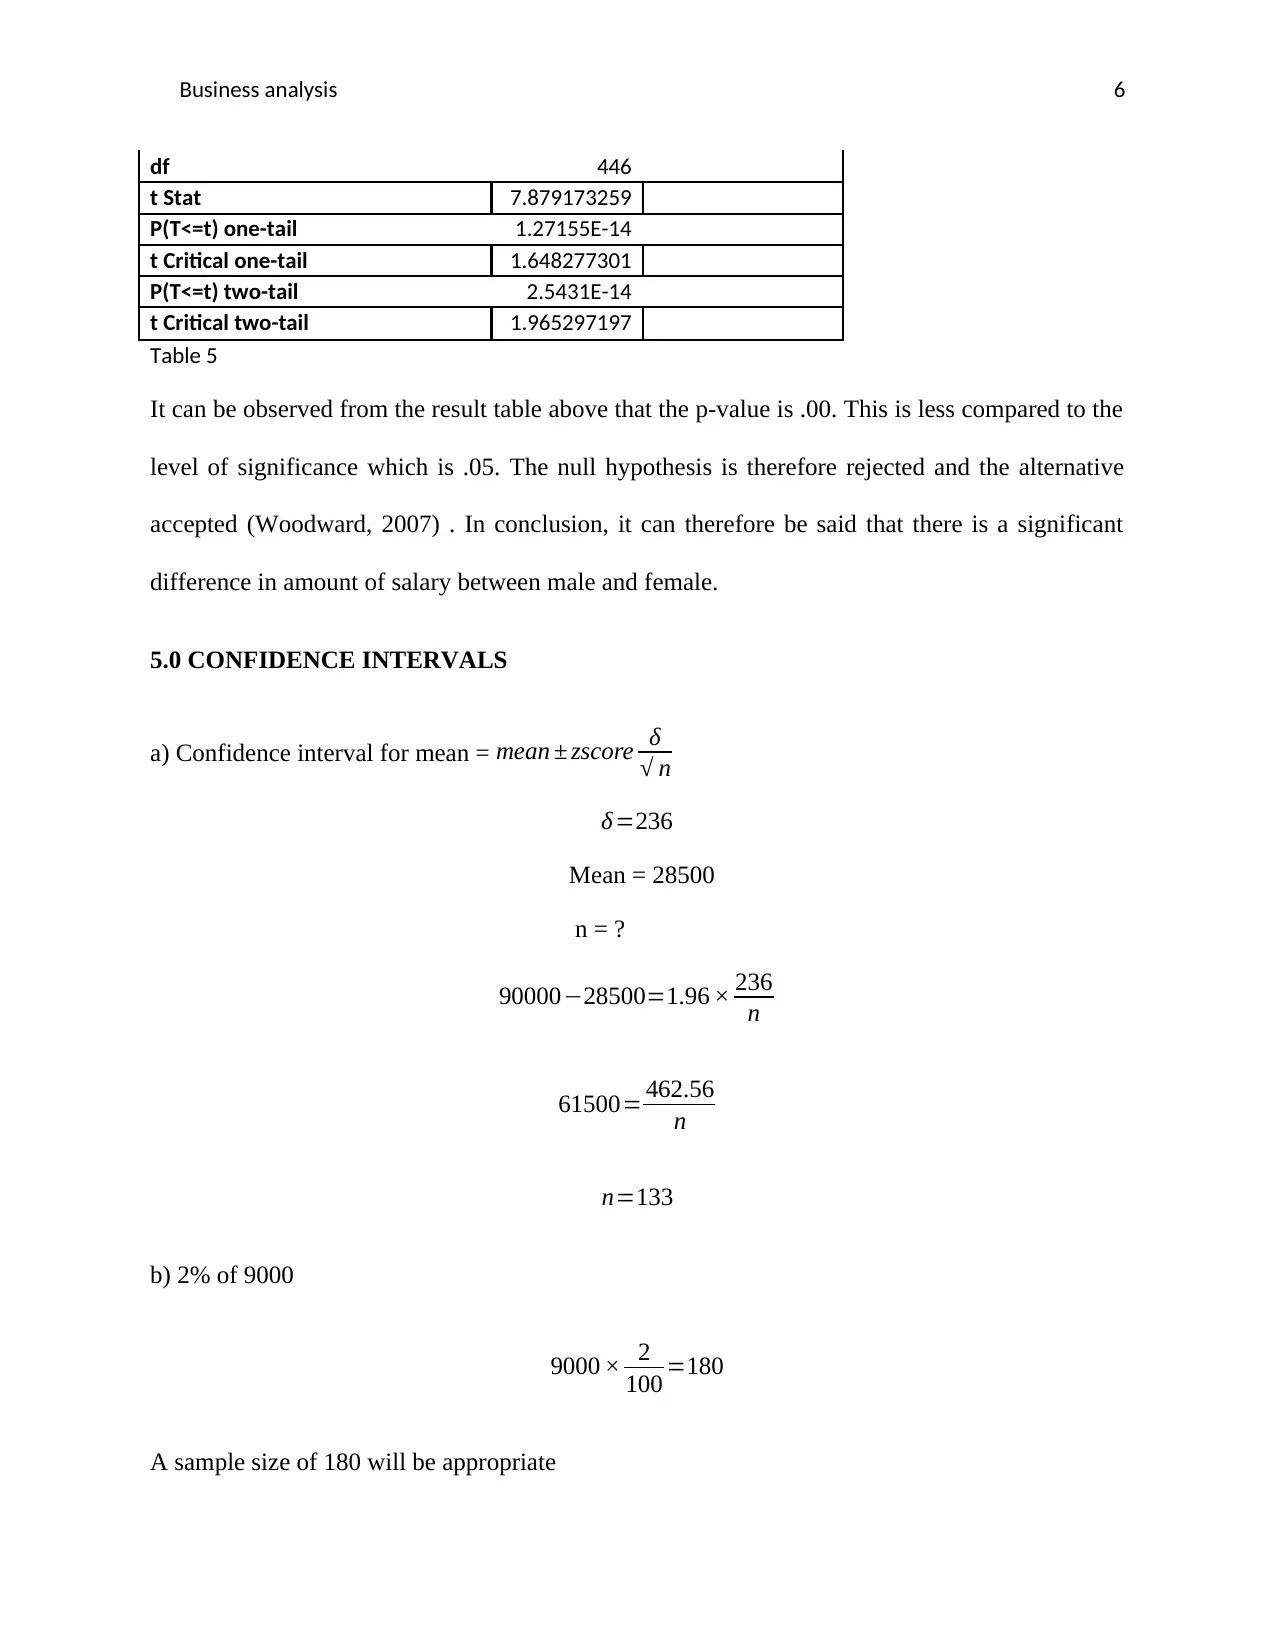
This homework assignment analyzes Cleveland employee salary and satisfaction data using various statistical methods. The solution begins by calculating the mean salary, which is found to be $29,490. The proportion of very and moderately satisfied employees is determined to be 89.04%. A one-sample t-test is performed to test whether the mean salary is greater than $28,500, with the null hypothesis not rejected. The proportion of employees who are at least 92% satisfied is also examined. Finally, a two-sample t-test is conducted to determine if there is a significant difference in salary between male and female employees, concluding that there is a significant difference. The assignment also briefly touches upon confidence intervals.
Document Page
Business analysis 1
Title
Student’s name
Professor
Course title
Date
tabler-icon-diamond-filled.svg

Secure Best Marks with AI Grader

Need help grading? Try our AI Grader for instant feedback on your assignments.
Document Page
Business analysis 2
1.0 MEAN SALARY FOR CLEVELAND EMPLOYEES
The mean salary for Cleveland employees can be obtained by running a descriptive statistics for
salary. This is because mean is one of the measures of central tendencies contained as an item in
the summary statistics.
The table below shows the summary statistics for employees’ salary
DESCRIPTIVE STATISTICS
Mean 29.49064588
Standard Error 0.664290688
Median 26.1
Mode 22.5
Standard Deviation 14.07606732
Sample Variance 198.1356712
Kurtosis 2.180320472
Skewness 1.303650506
Range 82.5
Minimum 9.8
Maximum 92.3
Sum 13241.3
Count 449
Table 1
The mean salary can be extracted from the summary table above. The mean salary for Cleveland
employees is 29.49 thousand dollars (29490 dollars).
Document Page
Business analysis 3
2.0 PROPORTION OF VERY SATISFIED AND MODERATELY SATISFIED
EMPLOYEES
The table of number of workers and their rates of satisfaction
Row Labels numbe
r
A little dissatisfied 29
Moderately
satisfied
195
Very dissatisfied 21
Very satisfied 205
Grand Total 450
Table 2
Proportion of moderately satisfied
43.43
%
Proportion of very satisfied
45.66
%
It can be observed that those who are very satisfied constitutes to 45.66% while those who are
moderately satisfied constitutes to 43.43%. Therefore the moderately and the very satisfied are
89.04% of the total employee population.
3.0 TEST THAT THE MEAN SALARY IS 28,500 DOLLARS (28.5 thousand dollars)
Prior to establishing the test results, a hypothesis must be put forward. A one sample t-test is
employed in this test to establish whether the mean salary of employees at Cleveland is above
28,500 dollars.
Hypothesis
H0: Mean salary of Cleveland employees is more than 28,500 dollars
Document Page
Business analysis 4
Versus
H1: Mean salary of Cleveland employees is not more than 28,500 dollars
The test has been carried out at 95% confidence level
The results of the analysis of variance are as in the table below
One-Sample Test
Test Value = 28.5
t df Sig. (2-tailed) Mean Difference 95% Confidence Interval of the
Difference
Lower Upper
salary 1.577 449 .116 1.04933 -.2584 2.3570
Table 3
Since the p-value is greater than .05 we fail to reject the null hypothesis. We therefore conclude
that the mean salary of Cleveland employees is more than 28,500 dollars.
4.0 PROPORTION OF EMPLOYEES AT LEAST 92%?
Table of distribution of employees according to their satisfaction
Row Labels numbe
r
A little dissatisfied 29
Moderately
satisfied
195
Very dissatisfied 21
Very satisfied 205
Grand Total 450
Table 4
Proportion of moderately satisfied
43.43
%
Proportion of very satisfied 45.66
tabler-icon-diamond-filled.svg

Secure Best Marks with AI Grader

Need help grading? Try our AI Grader for instant feedback on your assignments.
Document Page
Business analysis 5
%
It can be observed that those who are very satisfied constitutes to 45.66% while those who are
moderately satisfied constitutes to 43.43%. Therefore the moderately and the very satisfied are
89.04% of the total employee population. So the claim that the proportion of very satisfied and
moderately satisfied employees is at least 89.04% is not true.
5.0 TEST FOR SIGNIFICANT DIFFERENCE IN SALARY BETWEEN MEN AND
WOMEN
Since there are two variables only which form a pair, a t-test is appropriate for this kind of test.
The research survey sought to establish whether there was a significant difference in the salaries
of male and salary of females. The research came up with a hypothesis to guide the test as
follows;
H0: There is no significant difference between the salaries for the male and female workers in
Cleveland
Versus
H1: There is a significant difference between the salaries for the male and female workers in
Cleveland
Level of significance is 0.05
t-Test: Two-Sample Assuming Equal Variances
Mean 33.7019305 23.73968254
Variance 236.5502676 89.76698075
Observations 259 189
Pooled Variance 174.677492
Hypothesized Mean Difference 0
Document Page
Business analysis 6
df 446
t Stat 7.879173259
P(T<=t) one-tail 1.27155E-14
t Critical one-tail 1.648277301
P(T<=t) two-tail 2.5431E-14
t Critical two-tail 1.965297197
Table 5
It can be observed from the result table above that the p-value is .00. This is less compared to the
level of significance which is .05. The null hypothesis is therefore rejected and the alternative
accepted (Woodward, 2007) . In conclusion, it can therefore be said that there is a significant
difference in amount of salary between male and female.
5.0 CONFIDENCE INTERVALS
a) Confidence interval for mean = mean ± zscore δ
n
δ=236
Mean = 28500
n = ?
9000028500=1.96 × 236
n
61500= 462.56
n
n=133
b) 2% of 9000
9000 × 2
100 =180
A sample size of 180 will be appropriate
chevron_up_icon
1 out of 6
circle_padding
hide_on_mobile
zoom_out_icon
[object Object]