Compensation Survey Data Analysis: Southeast Region
VerifiedAdded on 2022/09/18
|3
|845
|18
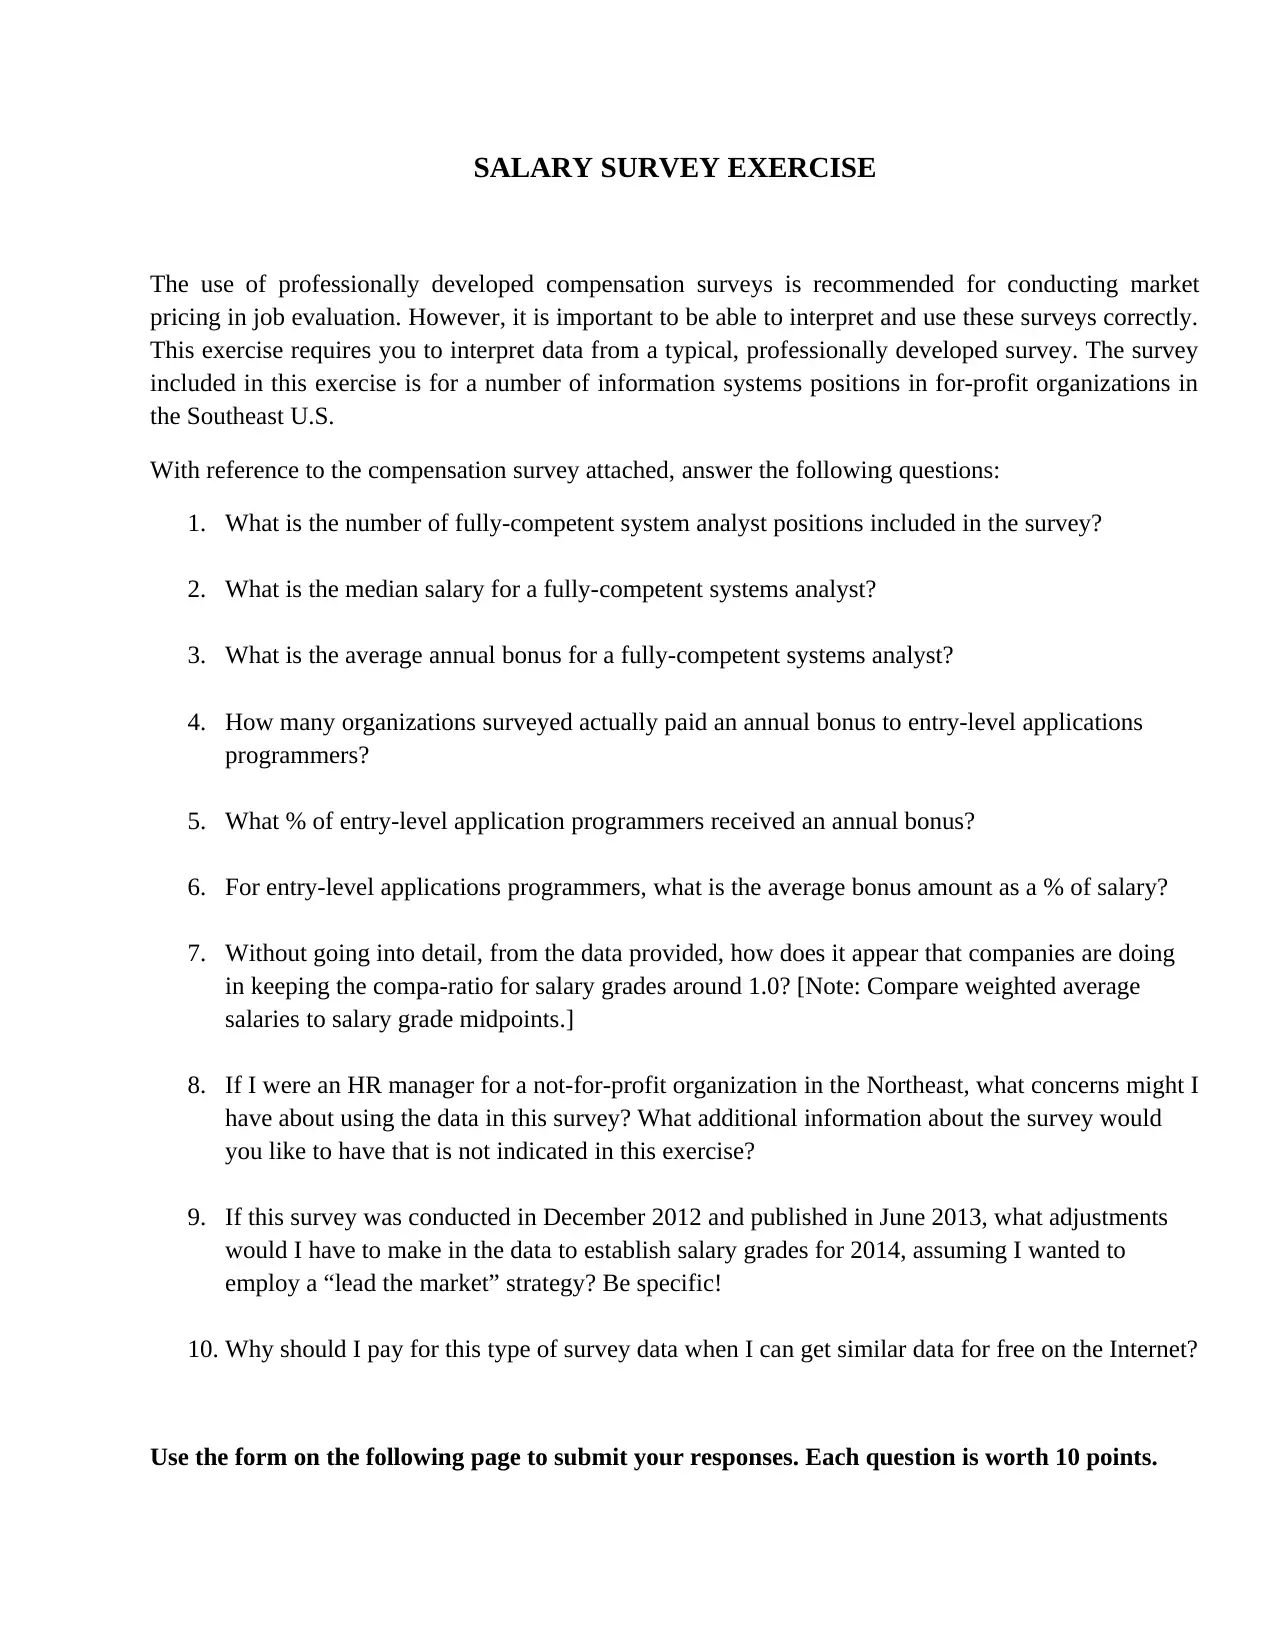
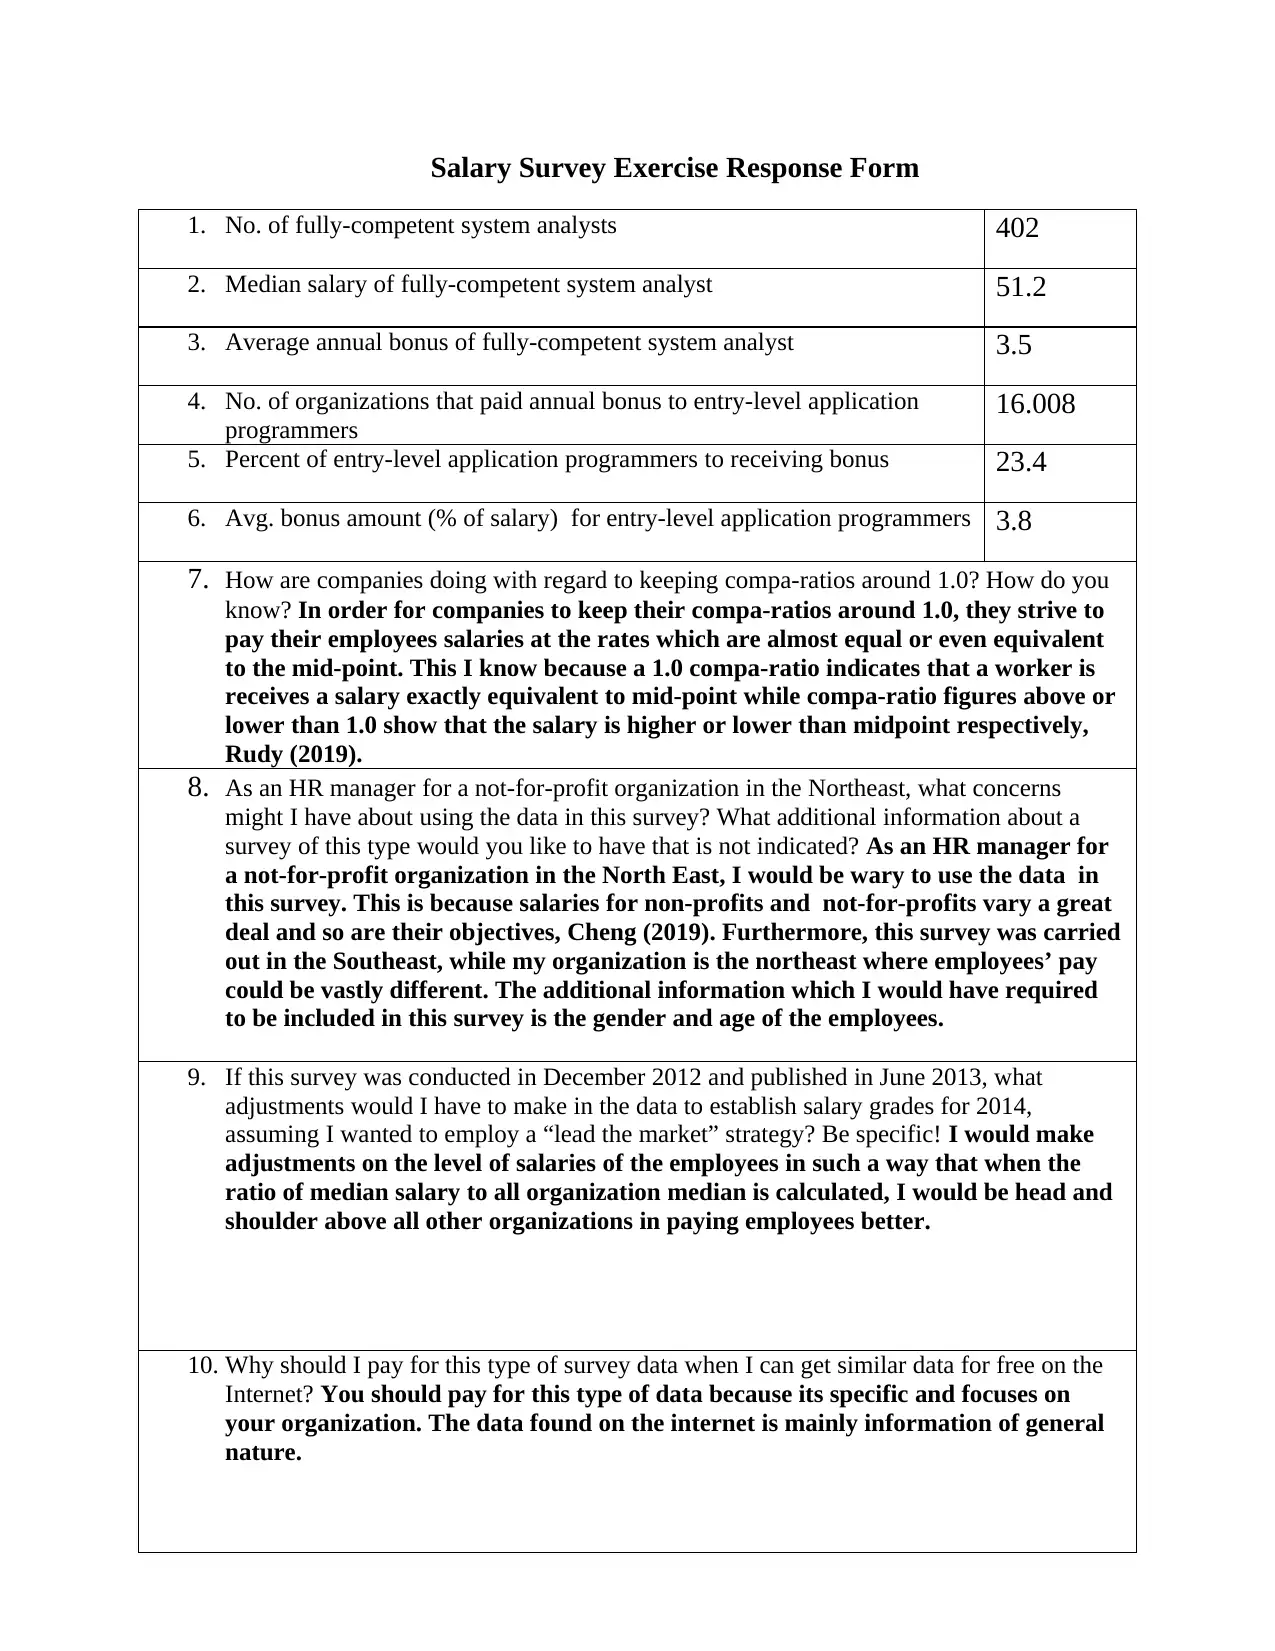
Homework Assignment
AI Summary
This assignment focuses on interpreting data from a compensation survey for information systems positions in the Southeast U.S. It requires the analysis of salary data, including the number of system analyst positions, median salaries, and average bonuses. The exercise involves calculating percentages of employees receiving bonuses, understanding compa-ratios, and considering the implications of using this data for different organizations and regions, specifically for a not-for-profit organization in the Northeast. The assignment also includes a discussion on making adjustments to the data for future salary grades and the value of paying for professional survey data versus using free online resources. The student's response provides specific answers to the questions, referencing the provided survey data and external sources for context.
1 out of 3
Your All-in-One AI-Powered Toolkit for Academic Success.
+13062052269
info@desklib.com
Available 24*7 on WhatsApp / Email
![[object Object]](/_next/static/media/star-bottom.7253800d.svg)
Copyright © 2020–2026 A2Z Services. All Rights Reserved. Developed and managed by ZUCOL.