Comprehensive Report on Sales, Cost, and Profit Trend Analysis

Verified

Added on  2023/04/07

|15
|636
|305
Report
AI Summary
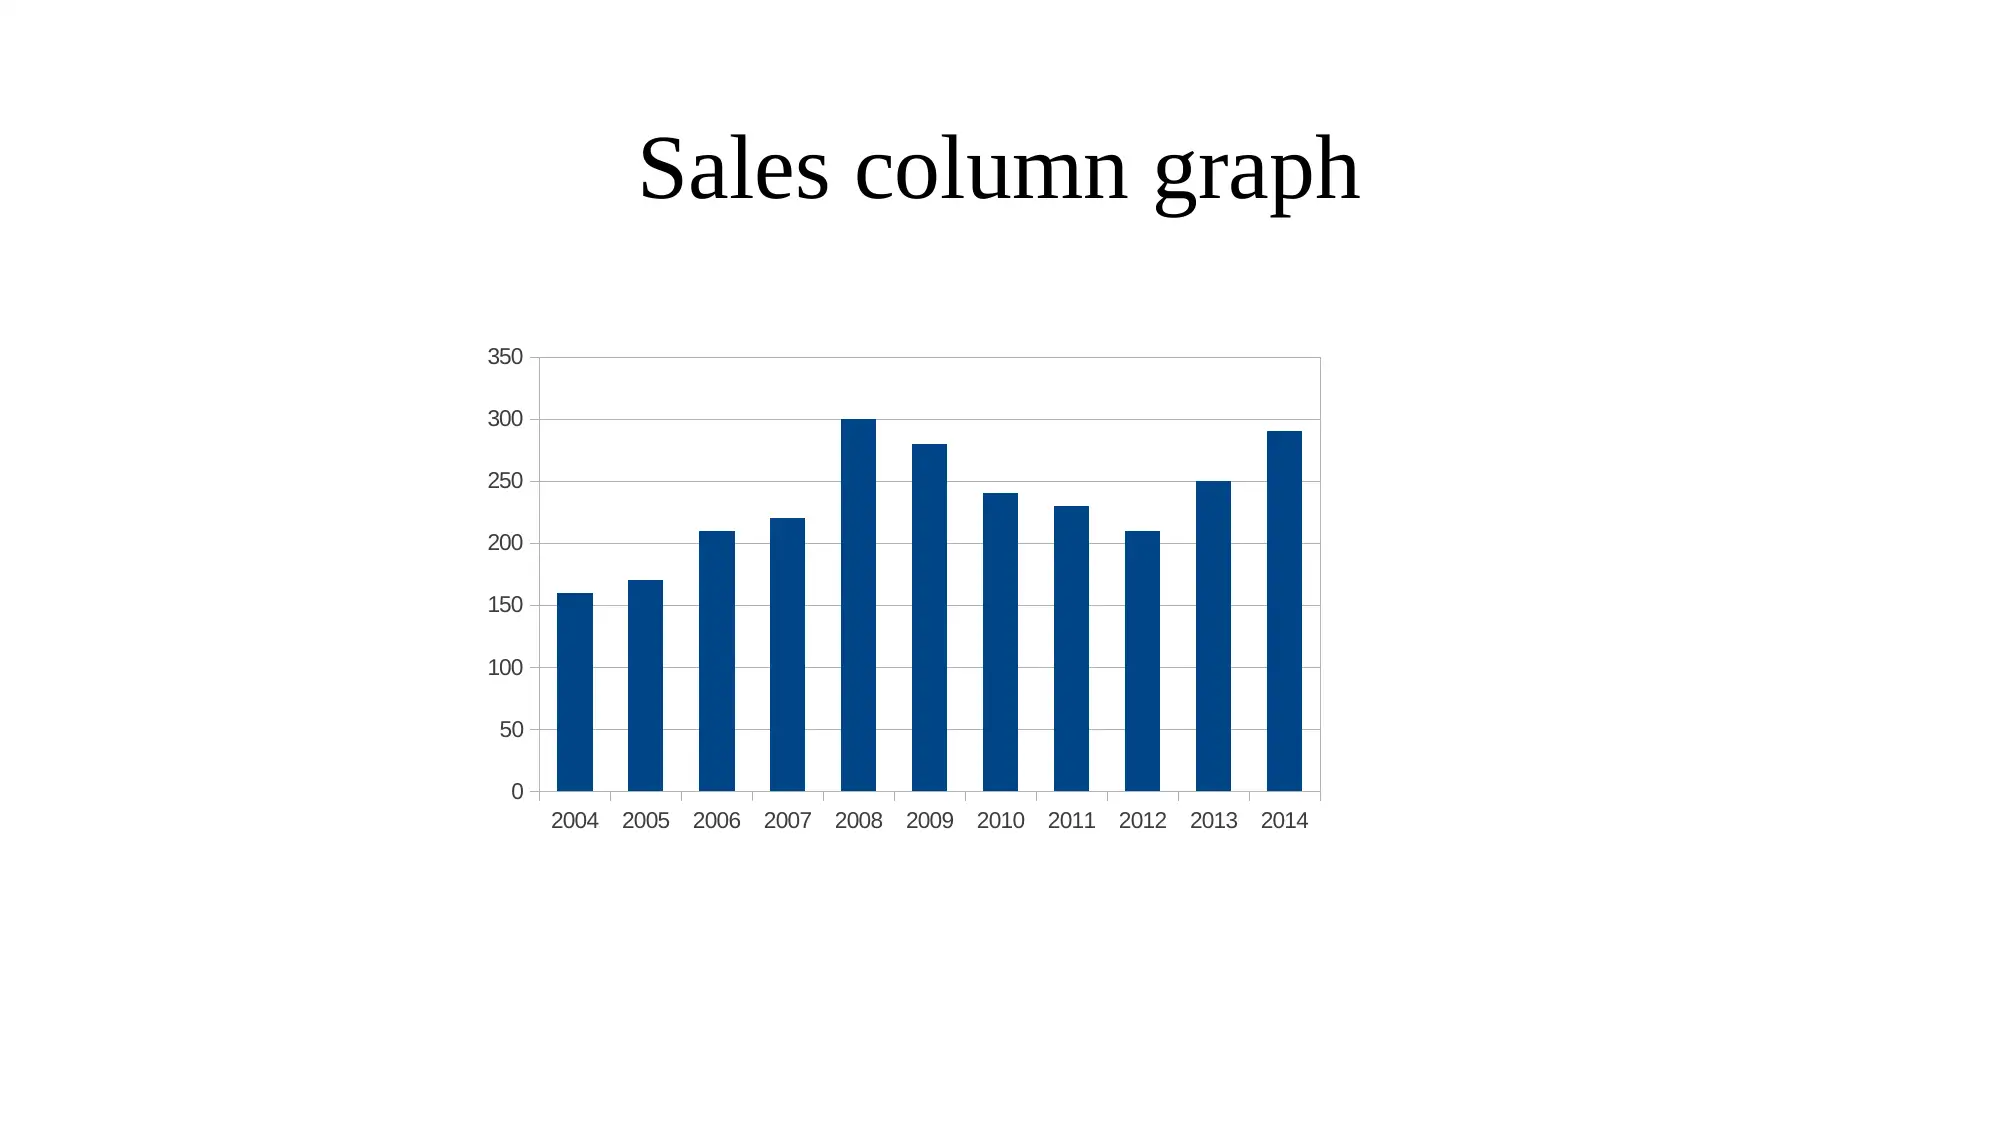
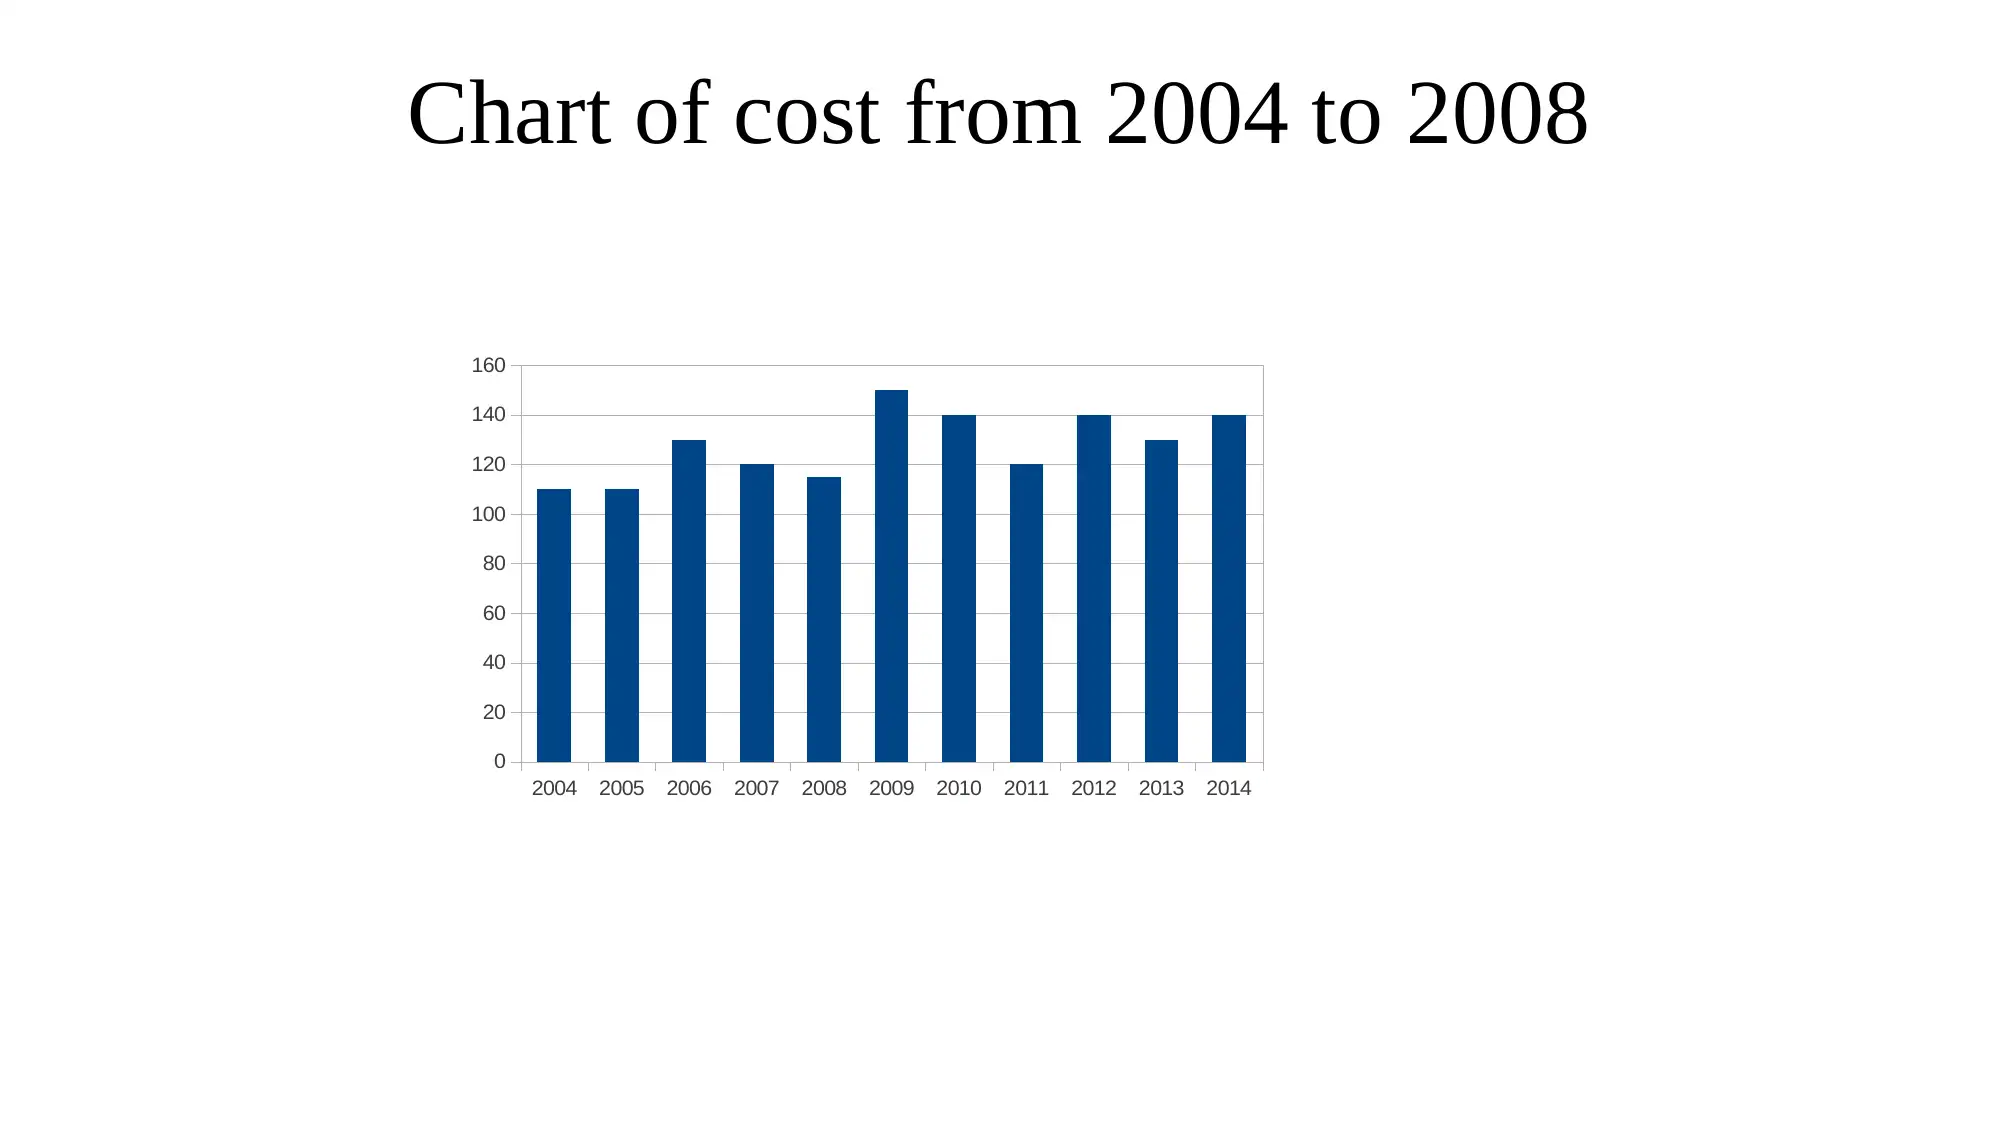
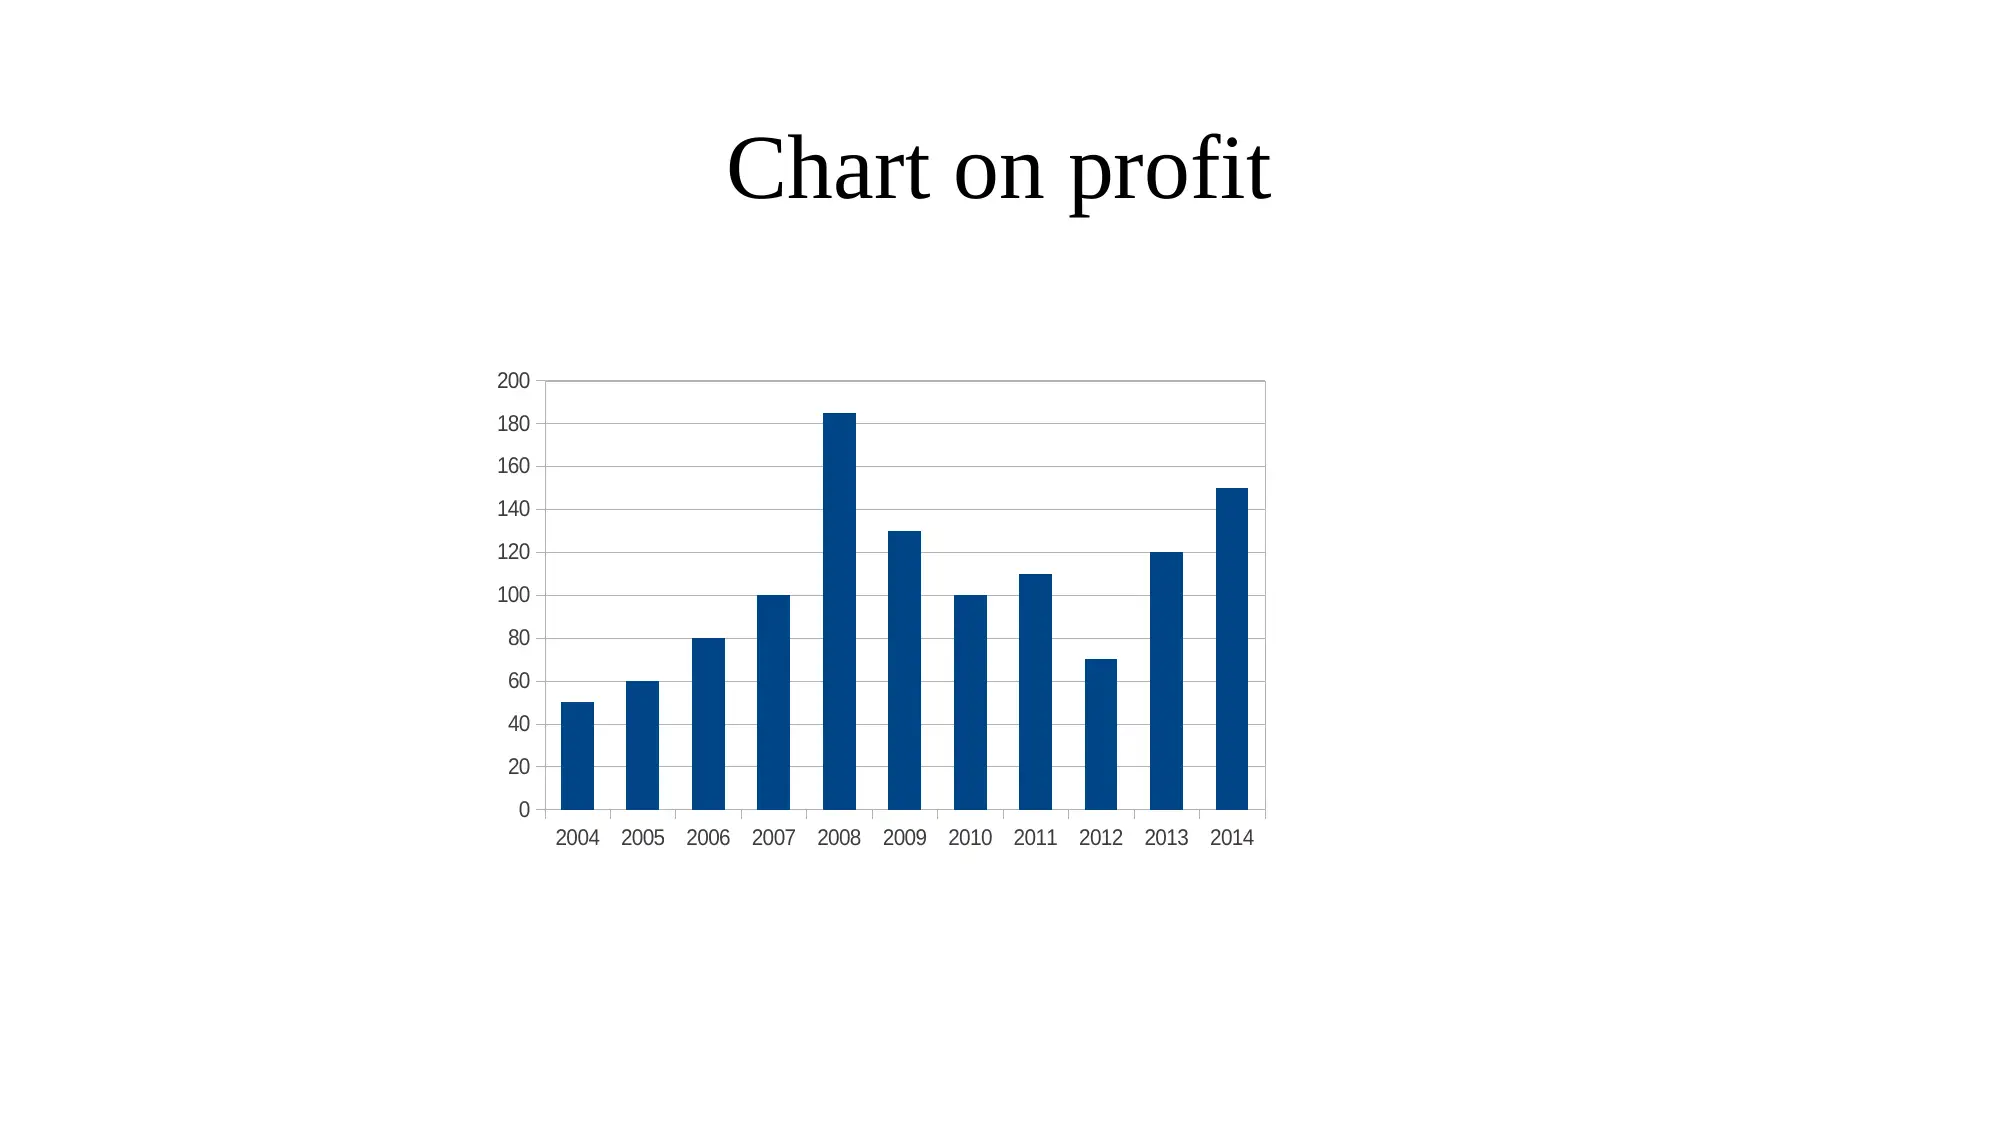
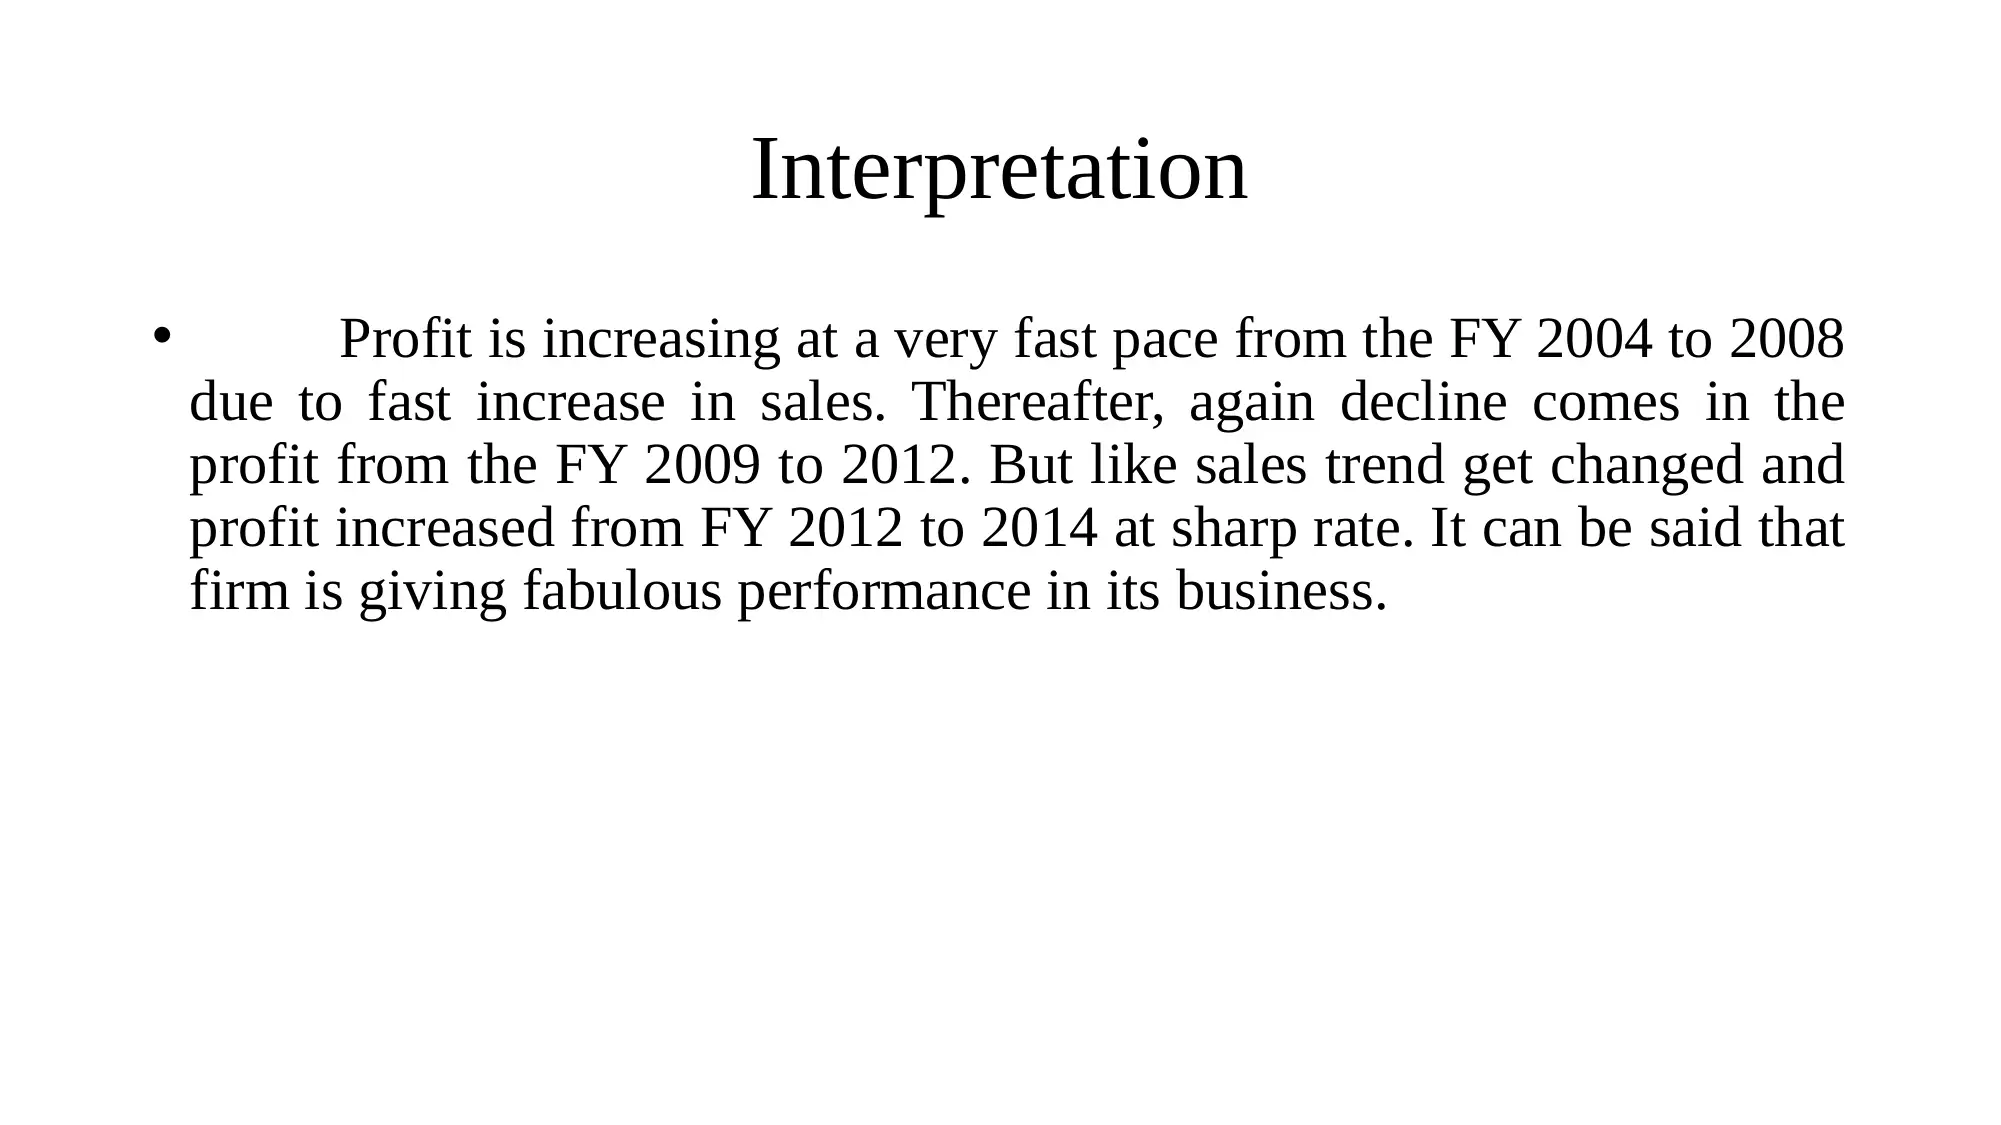
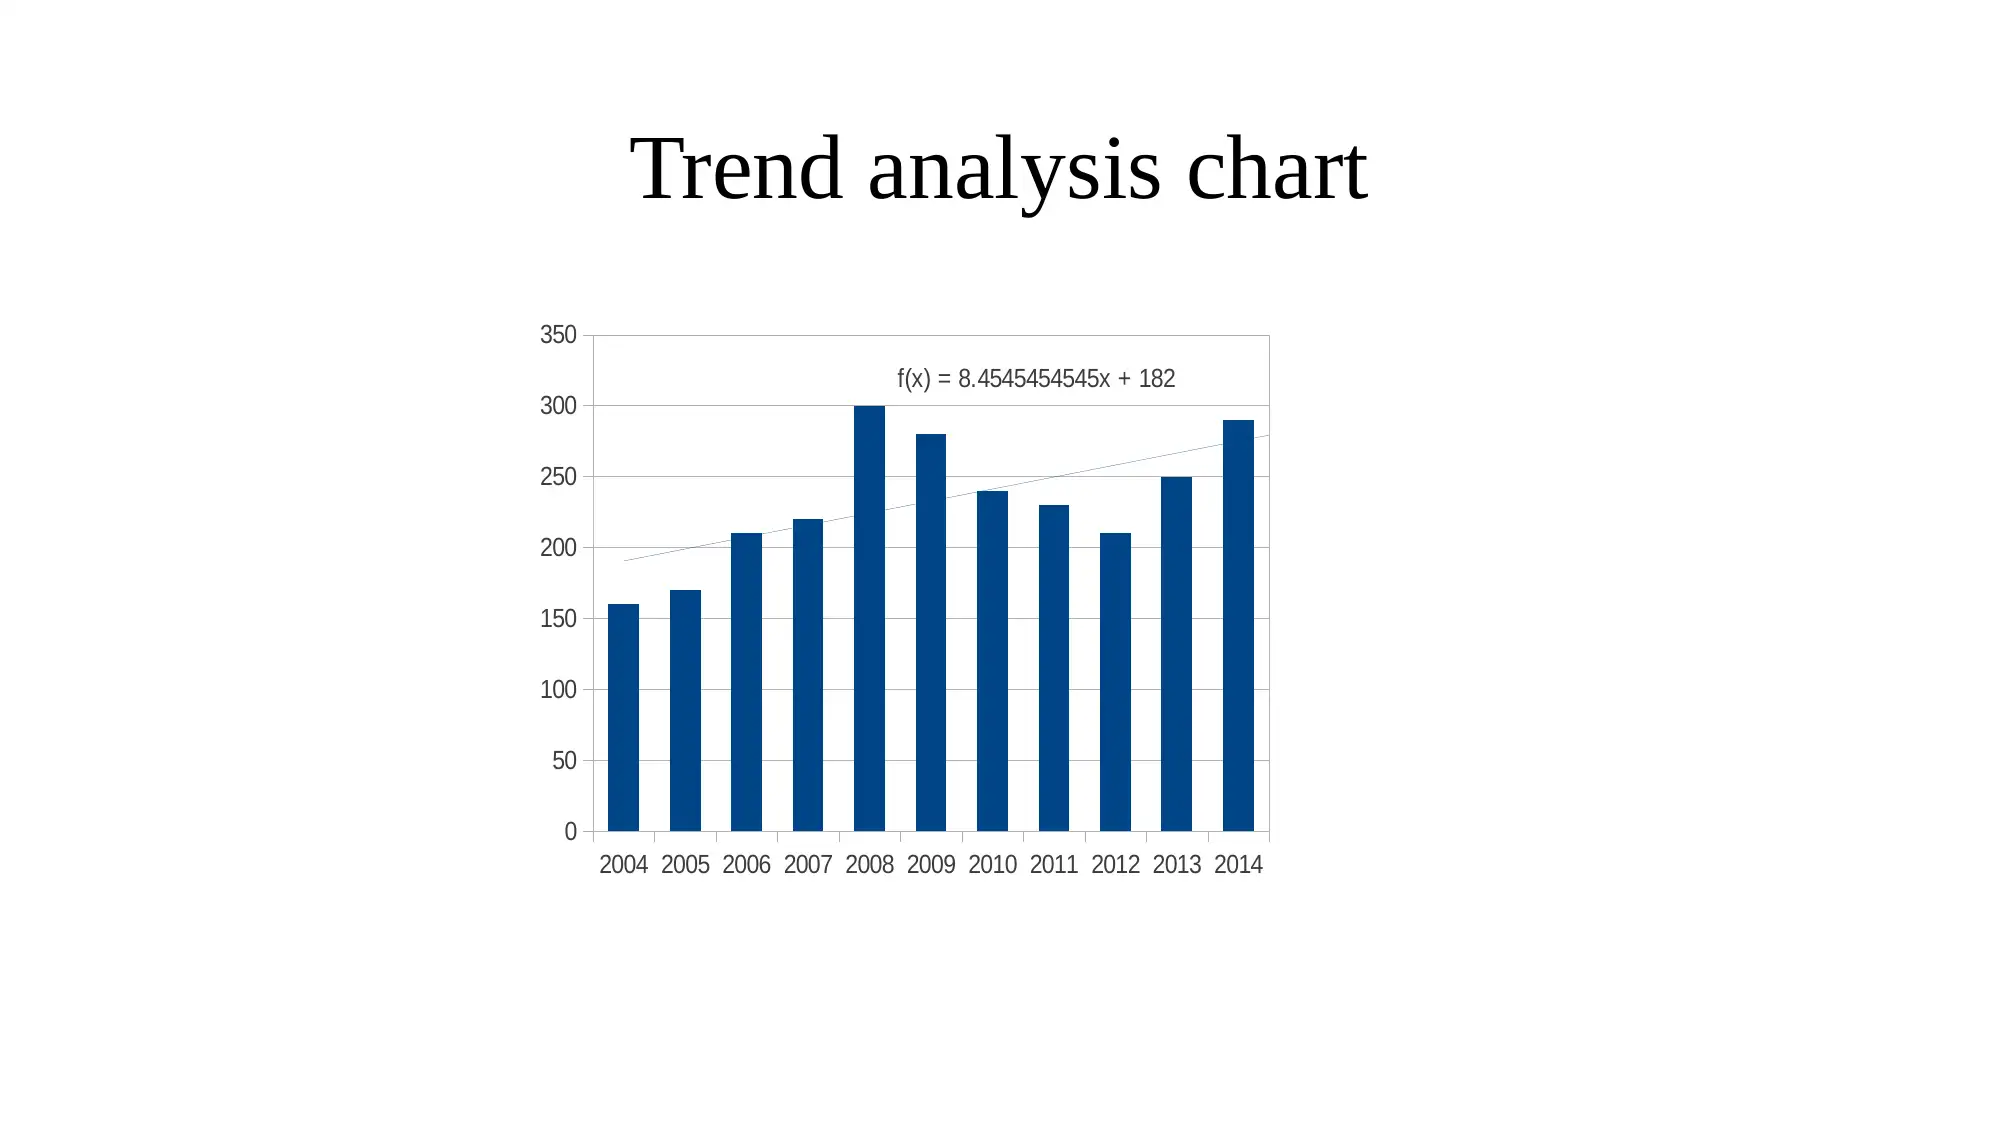
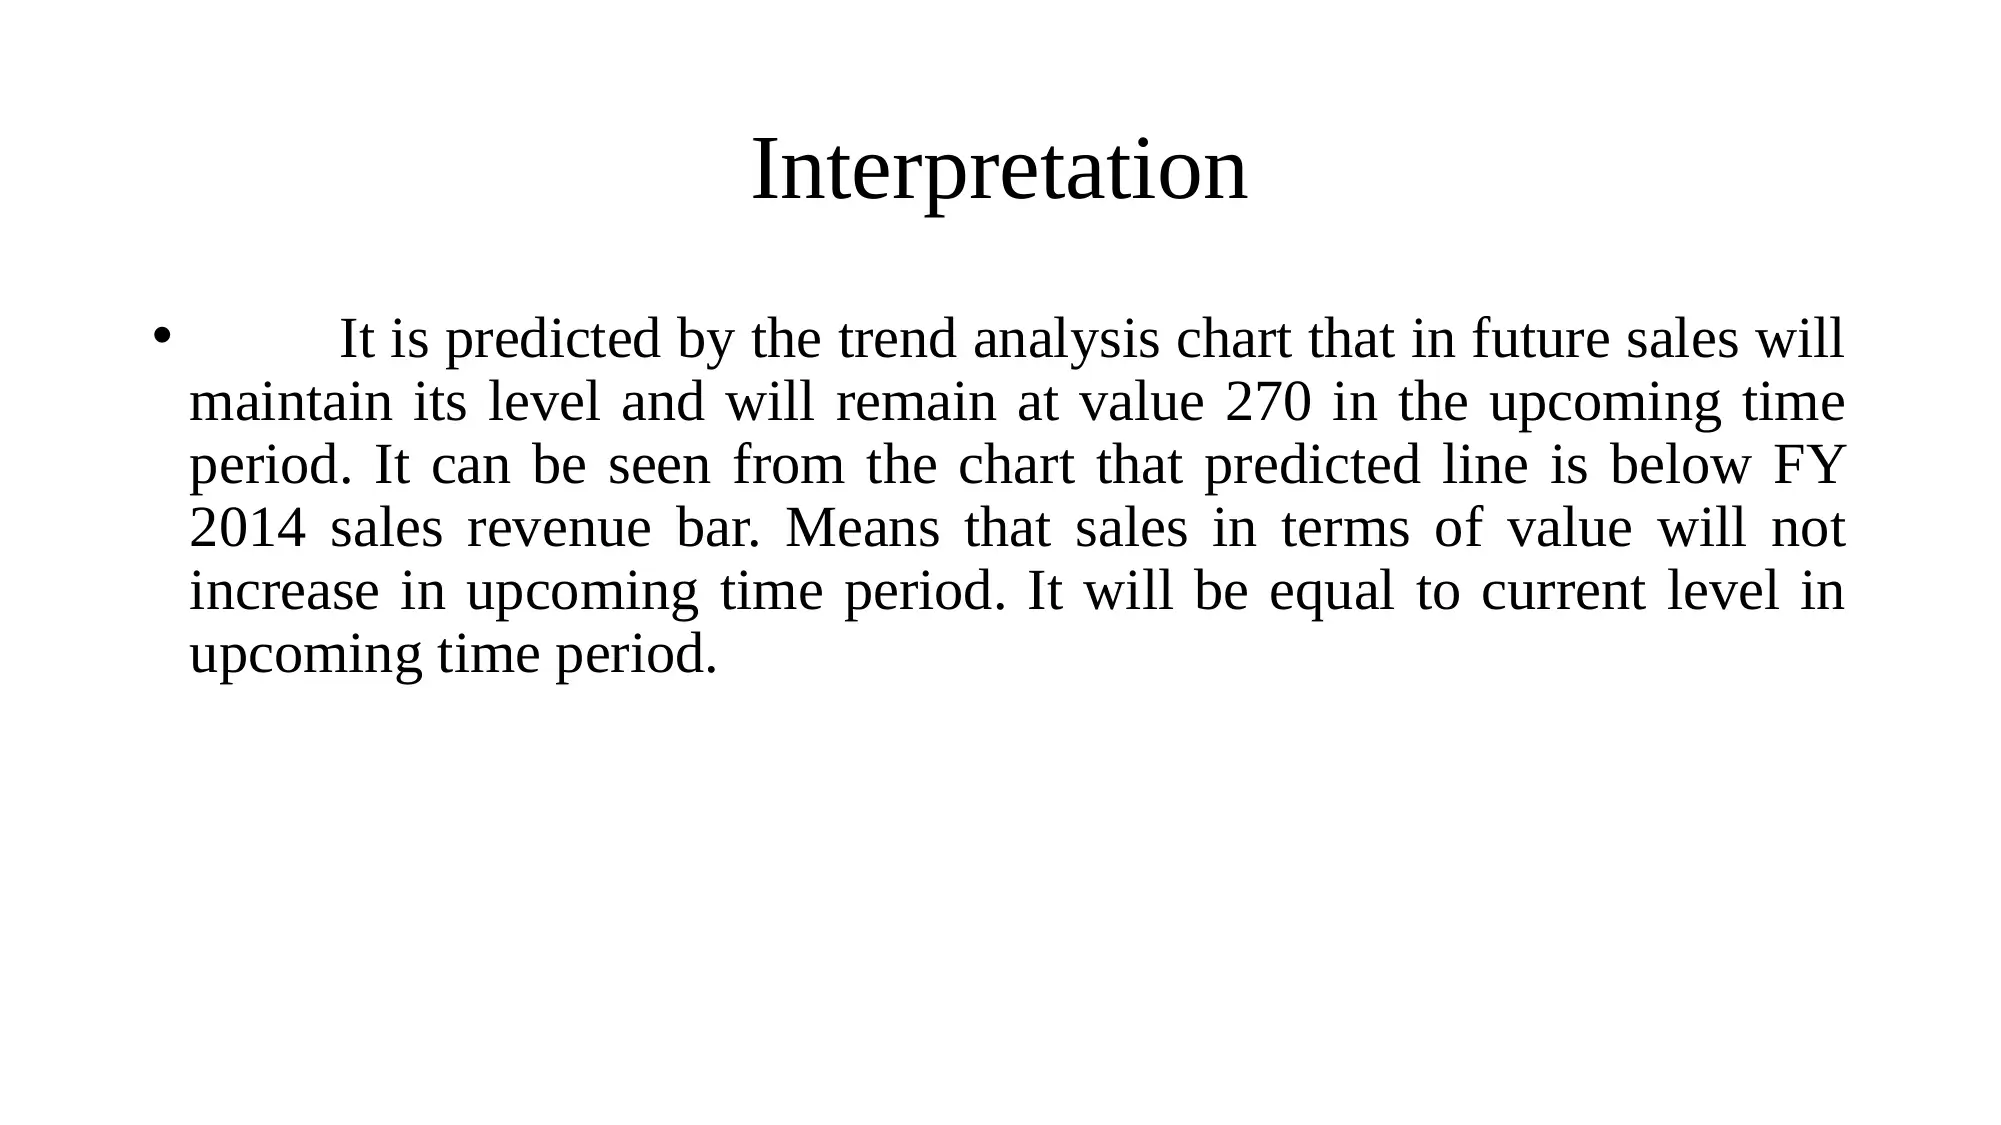
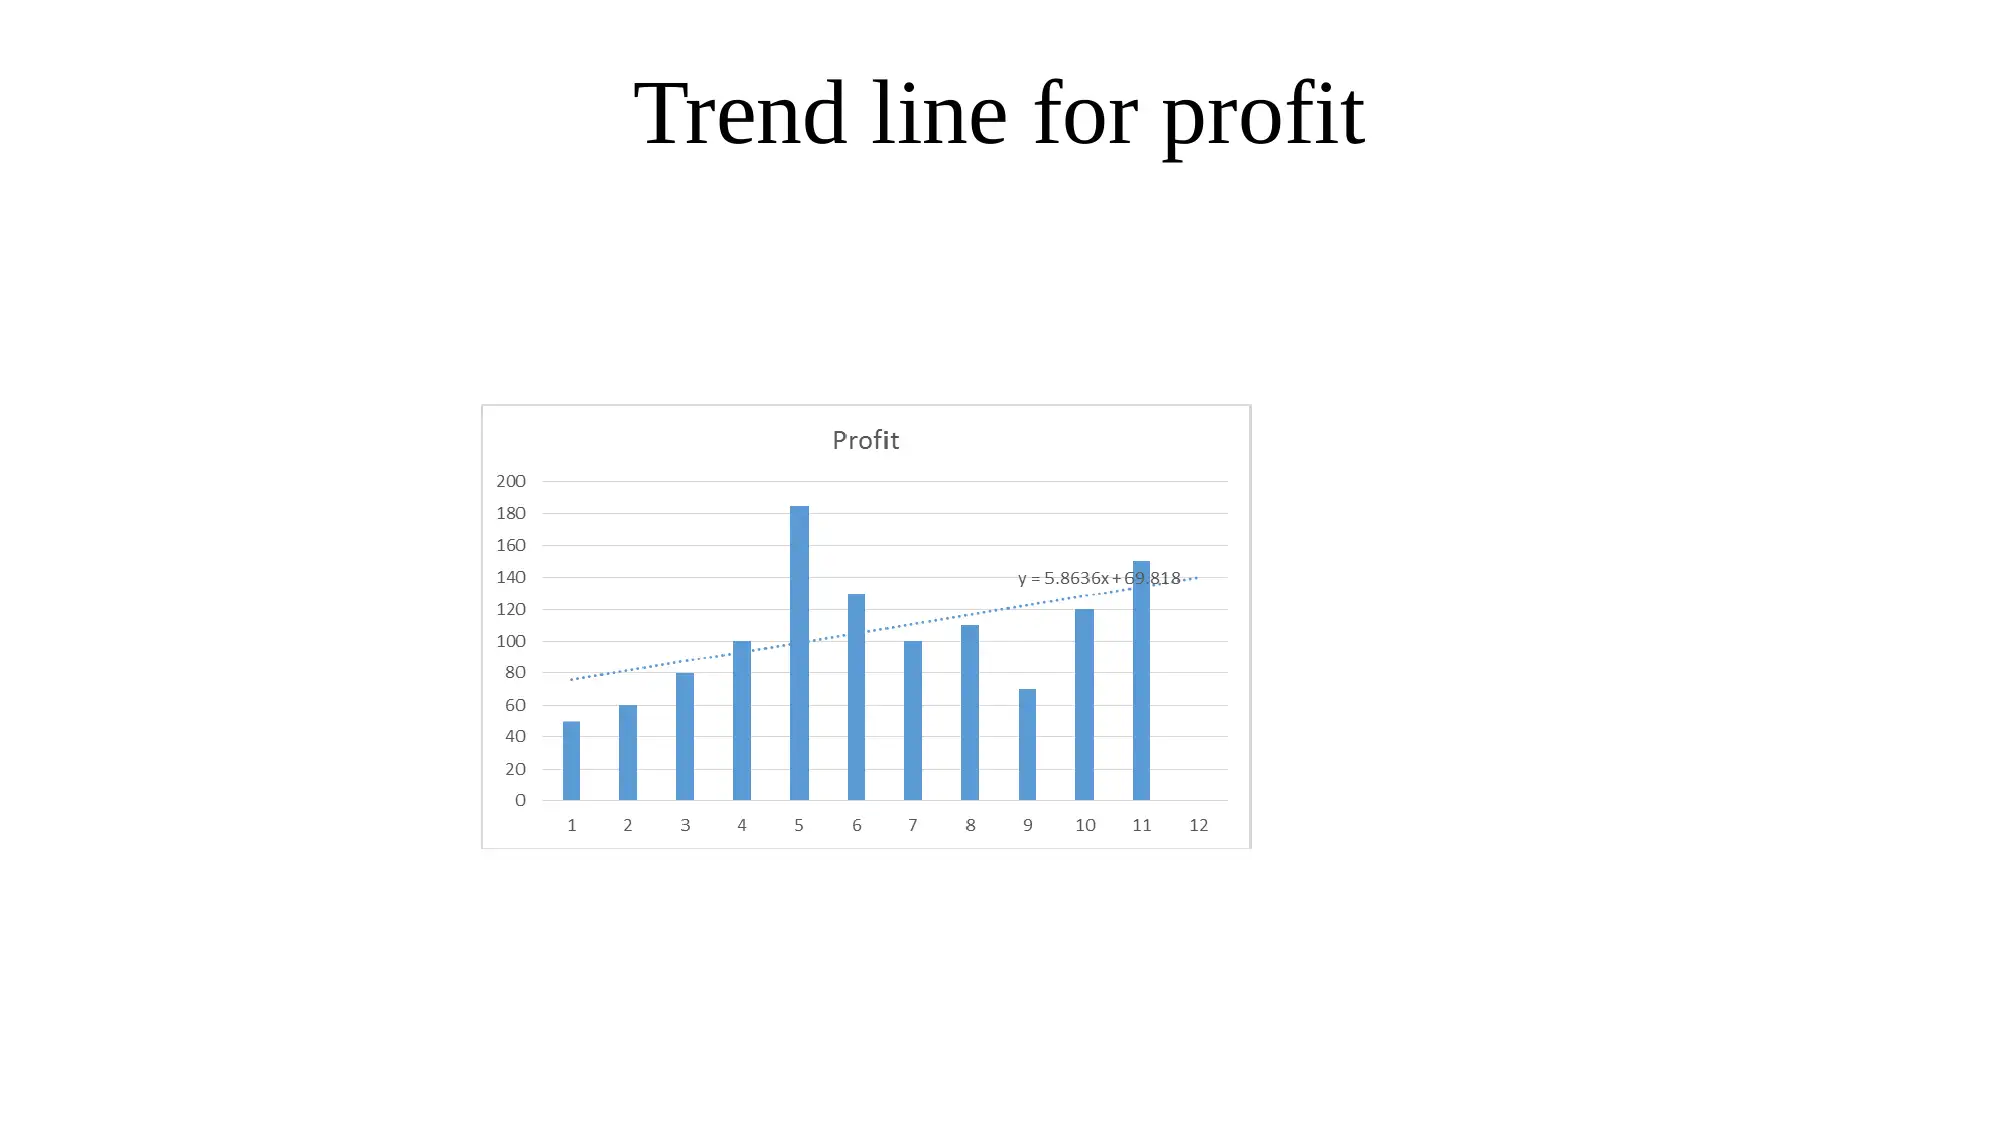
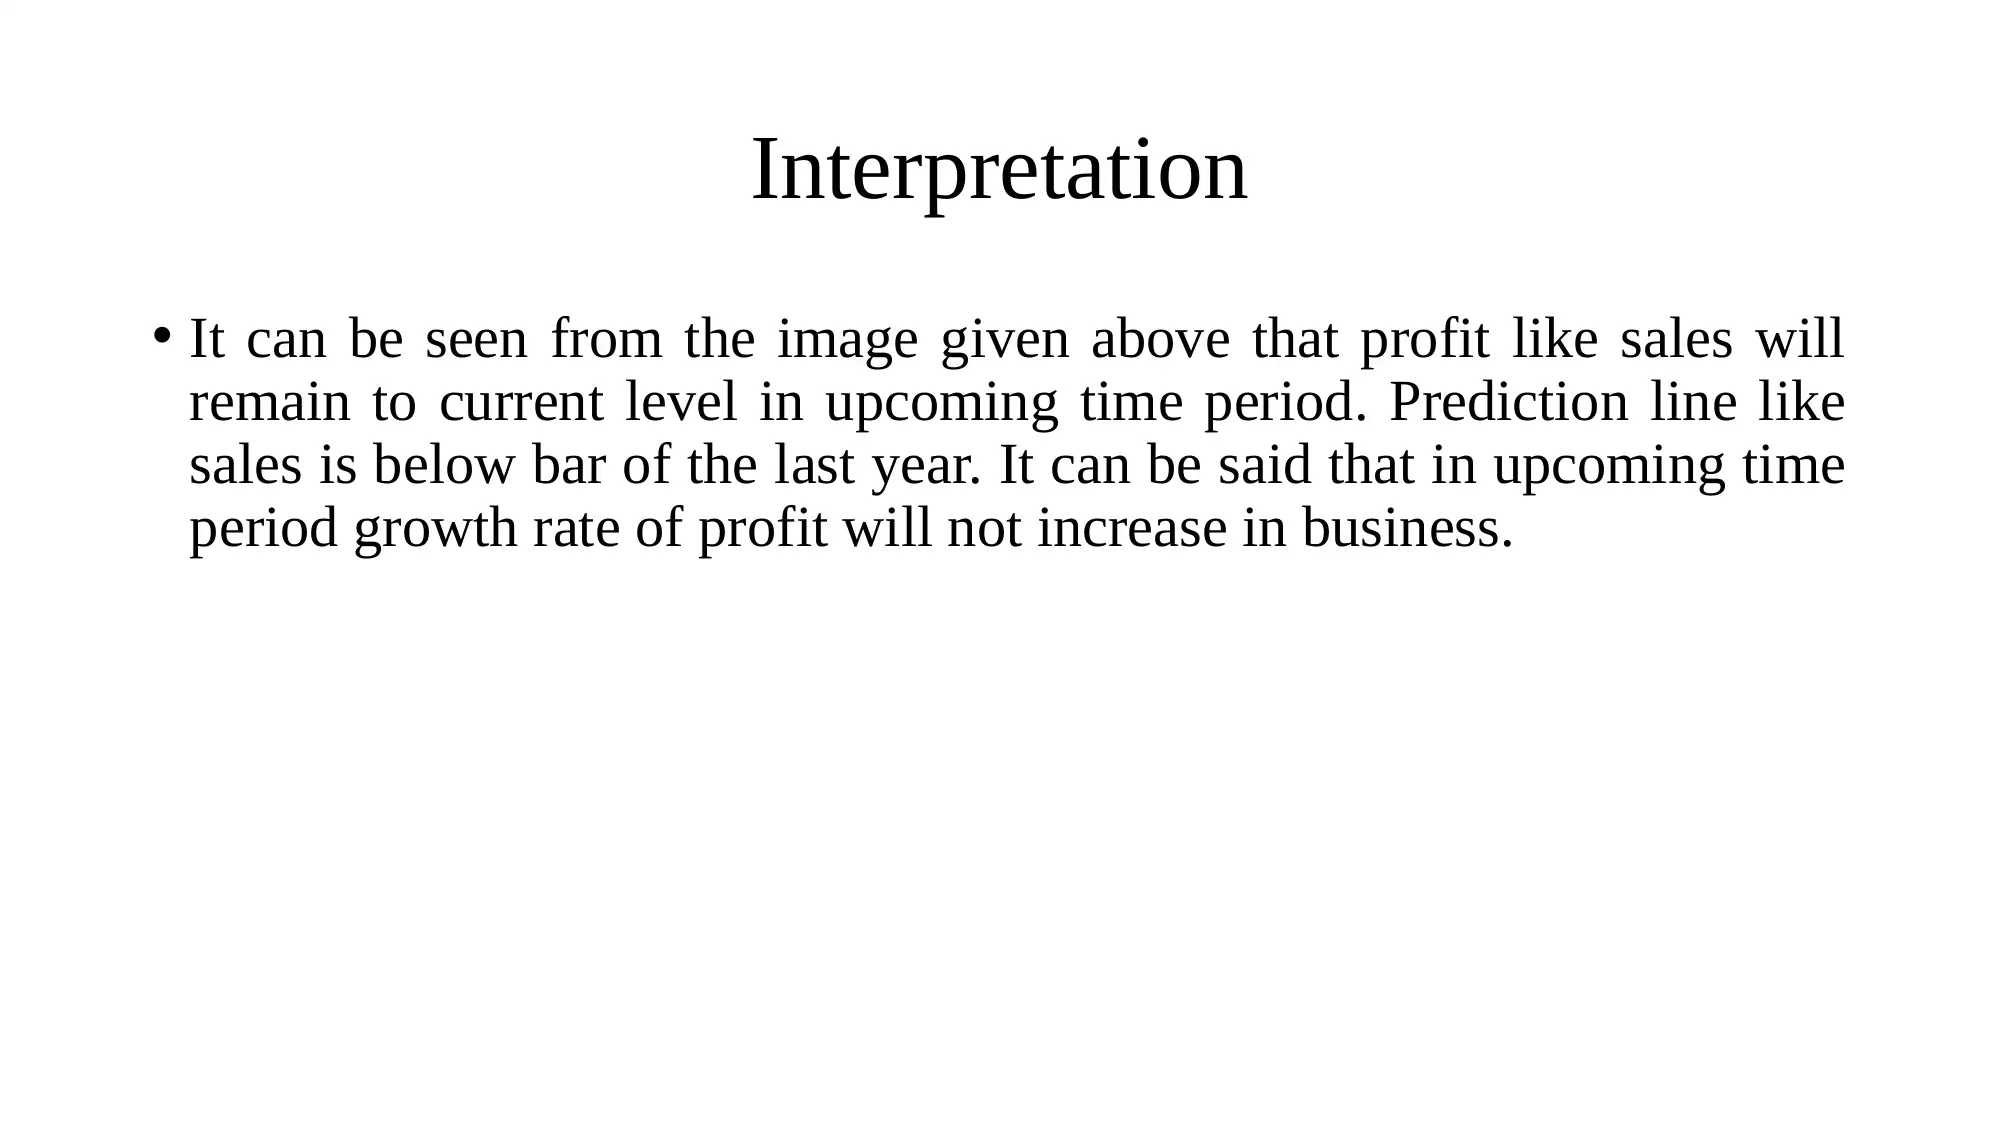
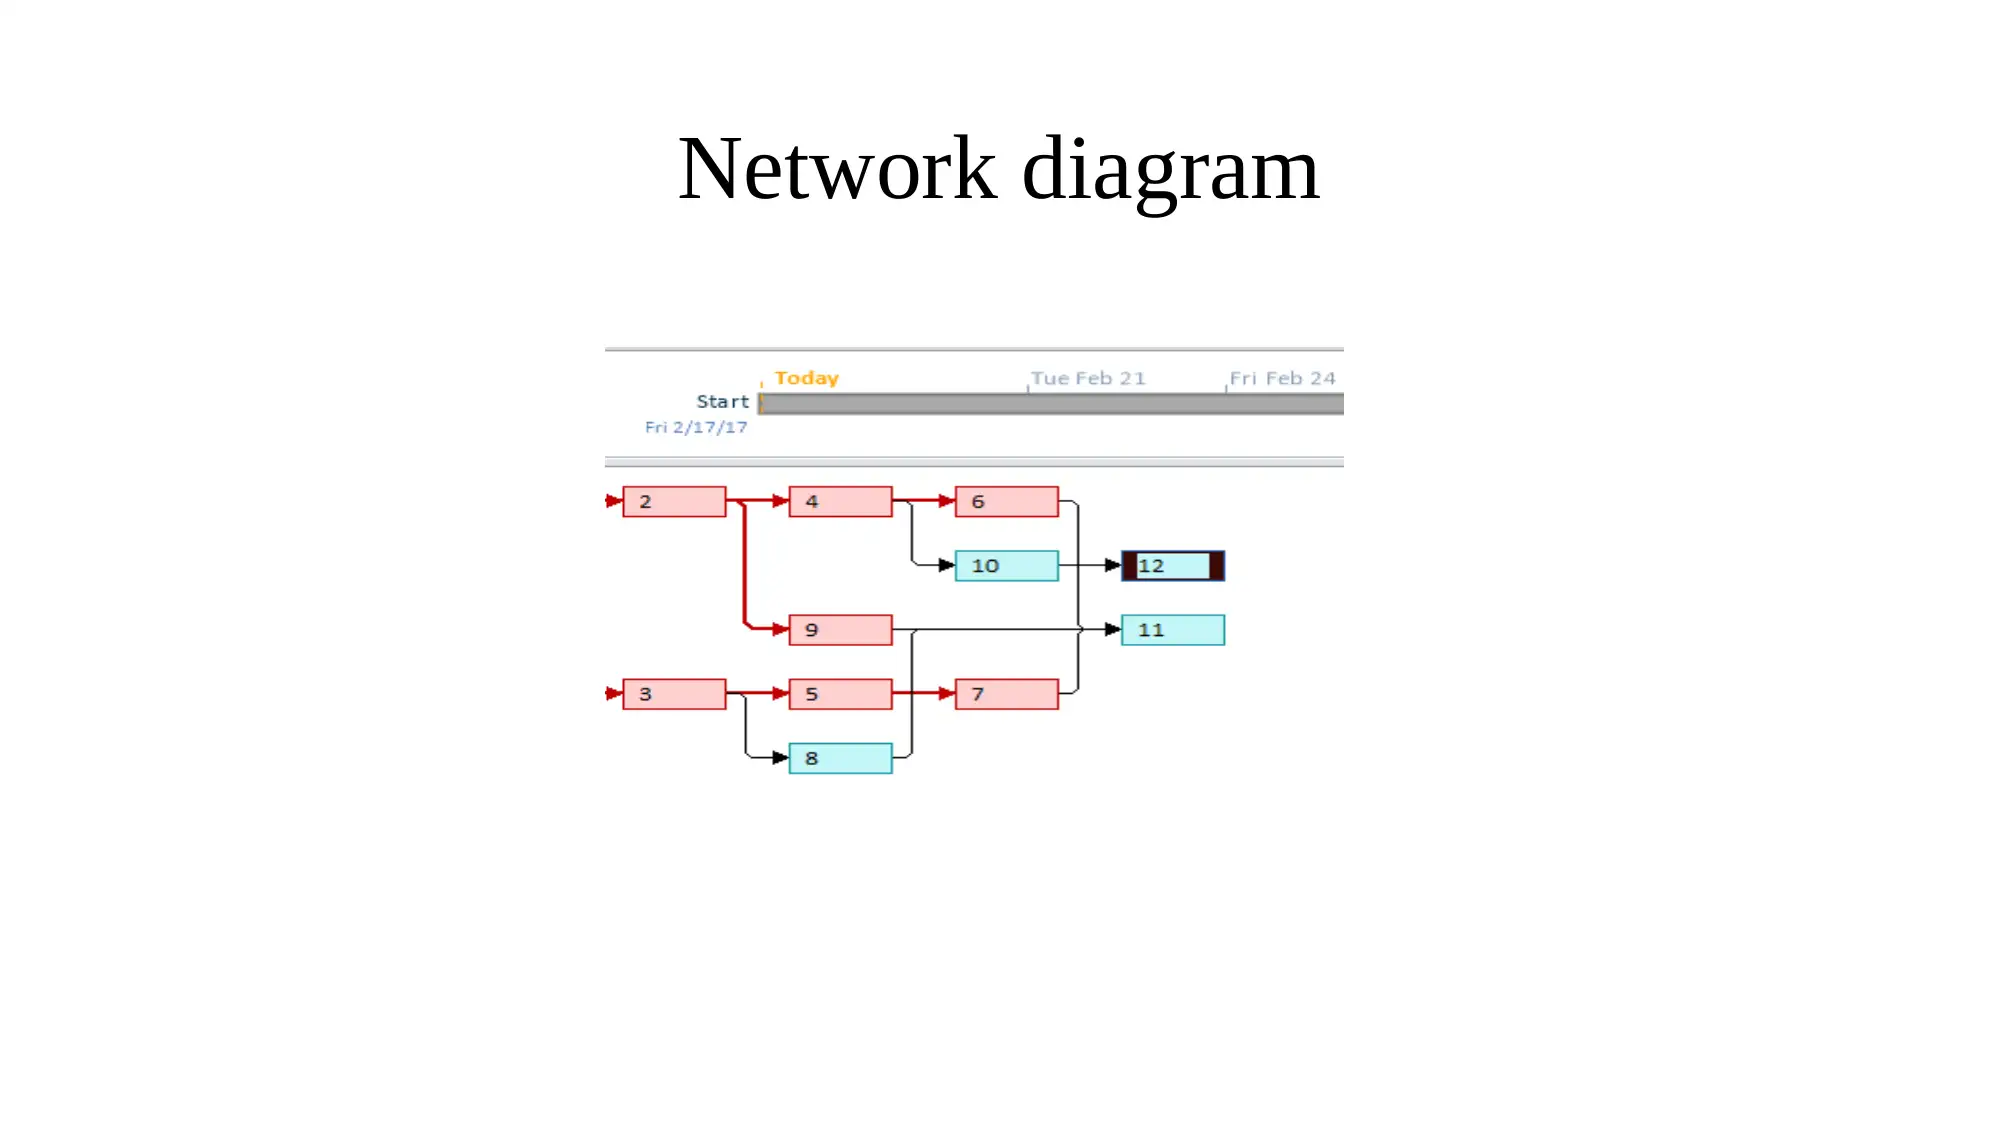
This report provides a detailed analysis of a firm's sales, cost, and profit trends from 2004 to 2014. The sales analysis indicates a significant growth period from 2004 to 2008, followed by a decline and subsequent recovery. Cost analysis reveals a consistent increase in business costs, with potential issues in cost control. Profit trends mirror sales trends, with rapid growth followed by a decline and then a sharp increase. Trend analysis predicts that future sales and profit will remain at current levels. The report also includes a network diagram and GANTT chart interpretation, highlighting the critical path for project completion within 81 days, emphasizing the importance of timely execution to avoid increased costs. Overall, the report suggests that management needs to take decisive steps to improve business performance and maintain growth.
tabler-icon-diamond-filled.svg

Contribute Materials

Your contribution can guide someone’s learning journey. Share your documents today.
Document Page
Sales column graph
2004 2005 2006 2007 2008 2009 2010 2011 2012 2013 2014
0
50
100
150
200
250
300
350
tabler-icon-diamond-filled.svg

Secure Best Marks with AI Grader

Need help grading? Try our AI Grader for instant feedback on your assignments.
Document Page
Interpretation
It is depicted by the chart that sales of the firm products increased from the FY
2004 to the FY2008. During this time period sales growth rate was very high.
During the tenure of 2004 to 2008 sales value become double from 150 to 300.
However, after this level sales get declined from 300 to 200.
This trend get break from the FY 2012 from where sales value increased from 200
to nearby to 300. It can be said that many ups and down comes in the firm sales
revenue during the entire time period of 2004 to 2014. Firm failed to obtain
growth rate that it observed during the time period of 2004-08.
Overall, it can be said that management needs to take some important and decisive
steps in order to improve their business performance.
Document Page
Chart of cost from 2004 to 2008
2004 2005 2006 2007 2008 2009 2010 2011 2012 2013 2014
0
20
40
60
80
100
120
140
160
Document Page
Interpretation
It is observed from the image given above that cost of the business is
increasing consistently from the FY 2004 to FY 2006. Thereafter, sales
declined during the FY 2007 and 2008. In the FY 2009 sudden
increase comes in the cost.
Comparison of trend of the FY 2007 and 2008 reflects that cost and
sales are not increasing at same pace. It can be said that firm have less
control on its cost and due to this reason even sales decline cost
increase or vice versa.
tabler-icon-diamond-filled.svg

Secure Best Marks with AI Grader

Need help grading? Try our AI Grader for instant feedback on your assignments.
Document Page
Chart on profit
2004 2005 2006 2007 2008 2009 2010 2011 2012 2013 2014
0
20
40
60
80
100
120
140
160
180
200
Document Page
Interpretation
Profit is increasing at a very fast pace from the FY 2004 to 2008
due to fast increase in sales. Thereafter, again decline comes in the
profit from the FY 2009 to 2012. But like sales trend get changed and
profit increased from FY 2012 to 2014 at sharp rate. It can be said that
firm is giving fabulous performance in its business.
Document Page
Trend analysis chart
2004 2005 2006 2007 2008 2009 2010 2011 2012 2013 2014
0
50
100
150
200
250
300
350
f(x) = 8.4545454545x + 182
tabler-icon-diamond-filled.svg

Paraphrase This Document

Need a fresh take? Get an instant paraphrase of this document with our AI Paraphraser
Document Page
Interpretation
It is predicted by the trend analysis chart that in future sales will
maintain its level and will remain at value 270 in the upcoming time
period. It can be seen from the chart that predicted line is below FY
2014 sales revenue bar. Means that sales in terms of value will not
increase in upcoming time period. It will be equal to current level in
upcoming time period.
Document Page
Trend line for profit
Document Page
Interpretation
It can be seen from the image given above that profit like sales will
remain to current level in upcoming time period. Prediction line like
sales is below bar of the last year. It can be said that in upcoming time
period growth rate of profit will not increase in business.
tabler-icon-diamond-filled.svg

Secure Best Marks with AI Grader

Need help grading? Try our AI Grader for instant feedback on your assignments.
Document Page
Network diagram
Document Page
GANTT chart
Document Page
Interpretation
Network diagram is the method that is used in the project planning in
order to determine the way that must be followed by using which it
can be ensured that project will be completed on time.
Usually, in this method order of activities is determined and same is
followed in order to determine the activity that must be performed
further for completing a project.
It can be seen that critical path for the proposed project is
2+4+6+9+3+5+7 which meant that project must be completed in 81
days. If project will get delayed even by single day cost will increased
in project.
tabler-icon-diamond-filled.svg

Paraphrase This Document

Need a fresh take? Get an instant paraphrase of this document with our AI Paraphraser
Document Page
REFERENCES
Document Page
Thank you
chevron_up_icon
1 out of 15
circle_padding
hide_on_mobile
zoom_out_icon
logo.png

Your All-in-One AI-Powered Toolkit for Academic Success.

Available 24*7 on WhatsApp / Email

[object Object]