Data Analysis Report: Insights from Sales Dataset - MBA504 Project

Verified

Added on  2022/10/06

|6
|1070
|22
Report
AI Summary
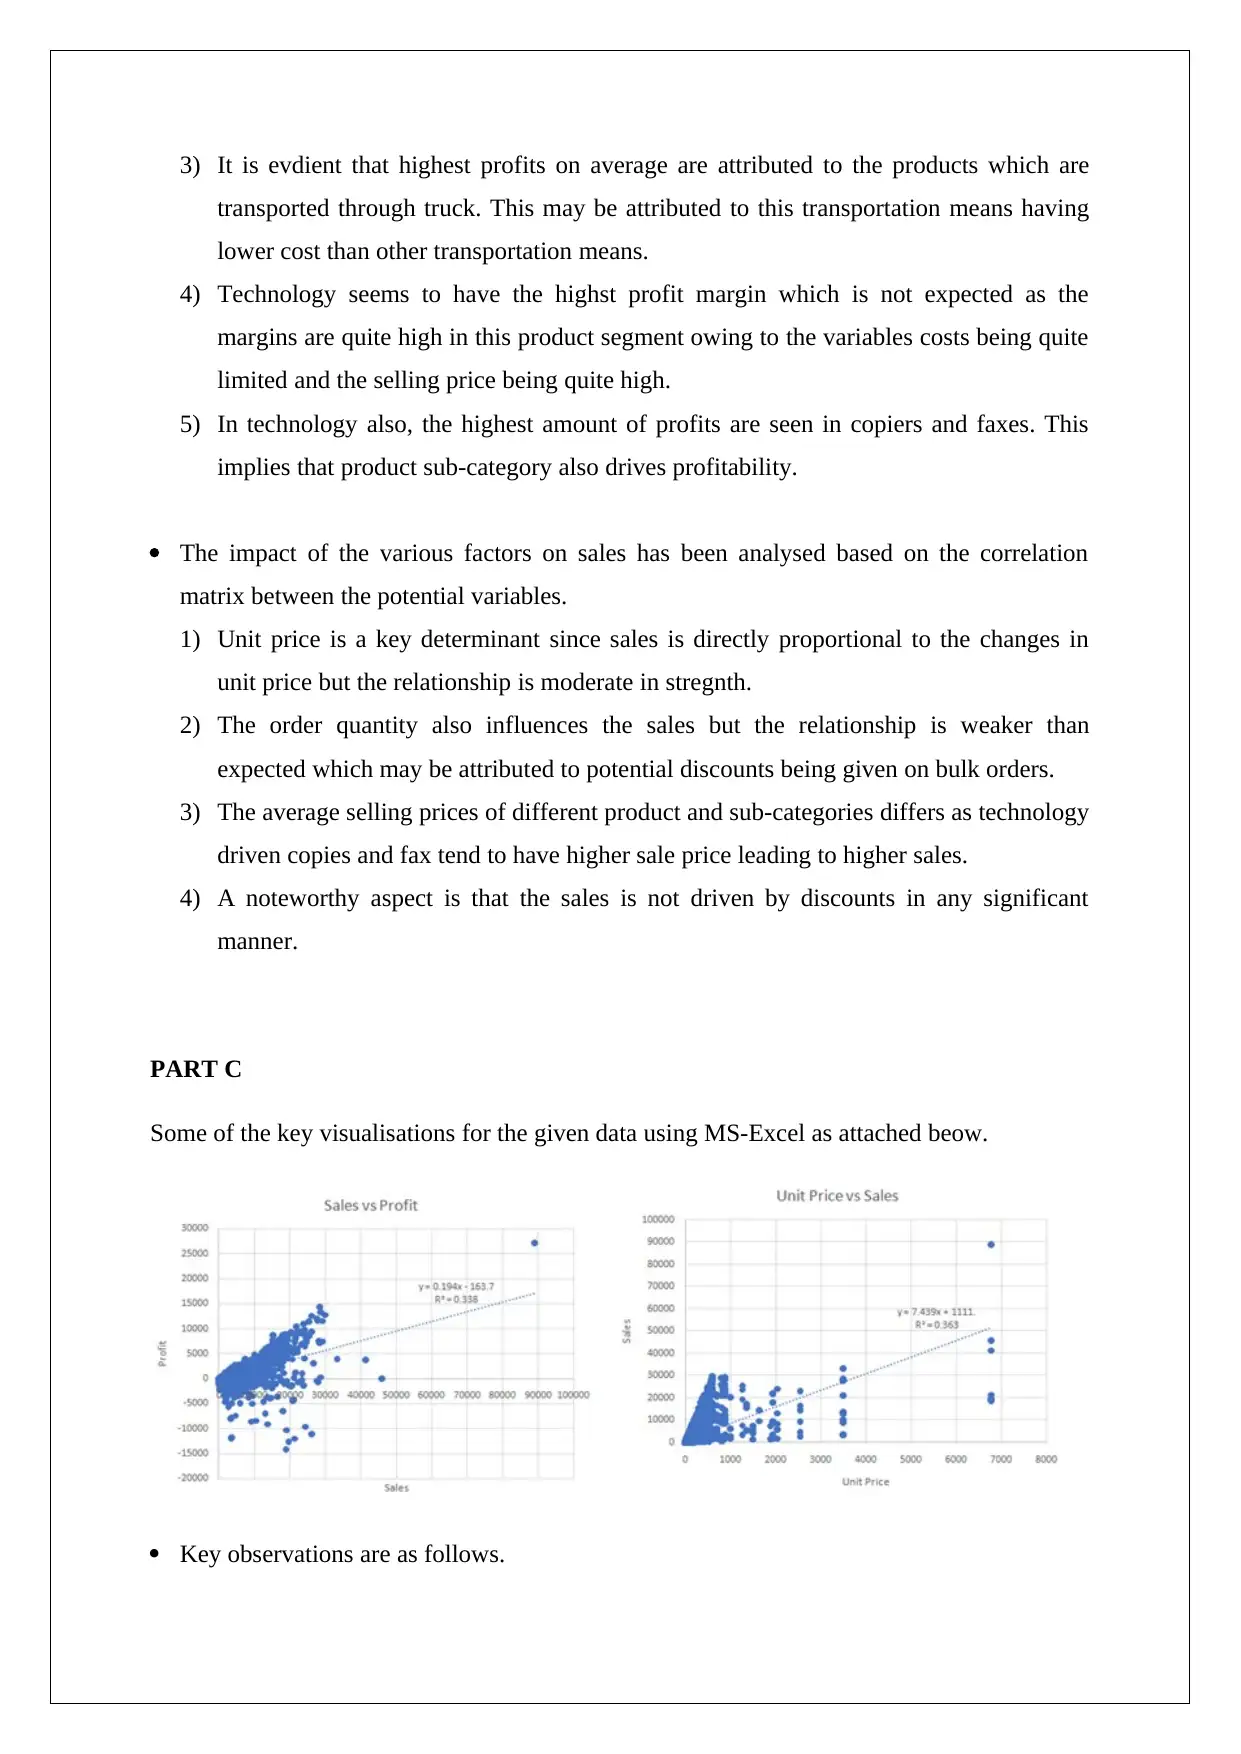
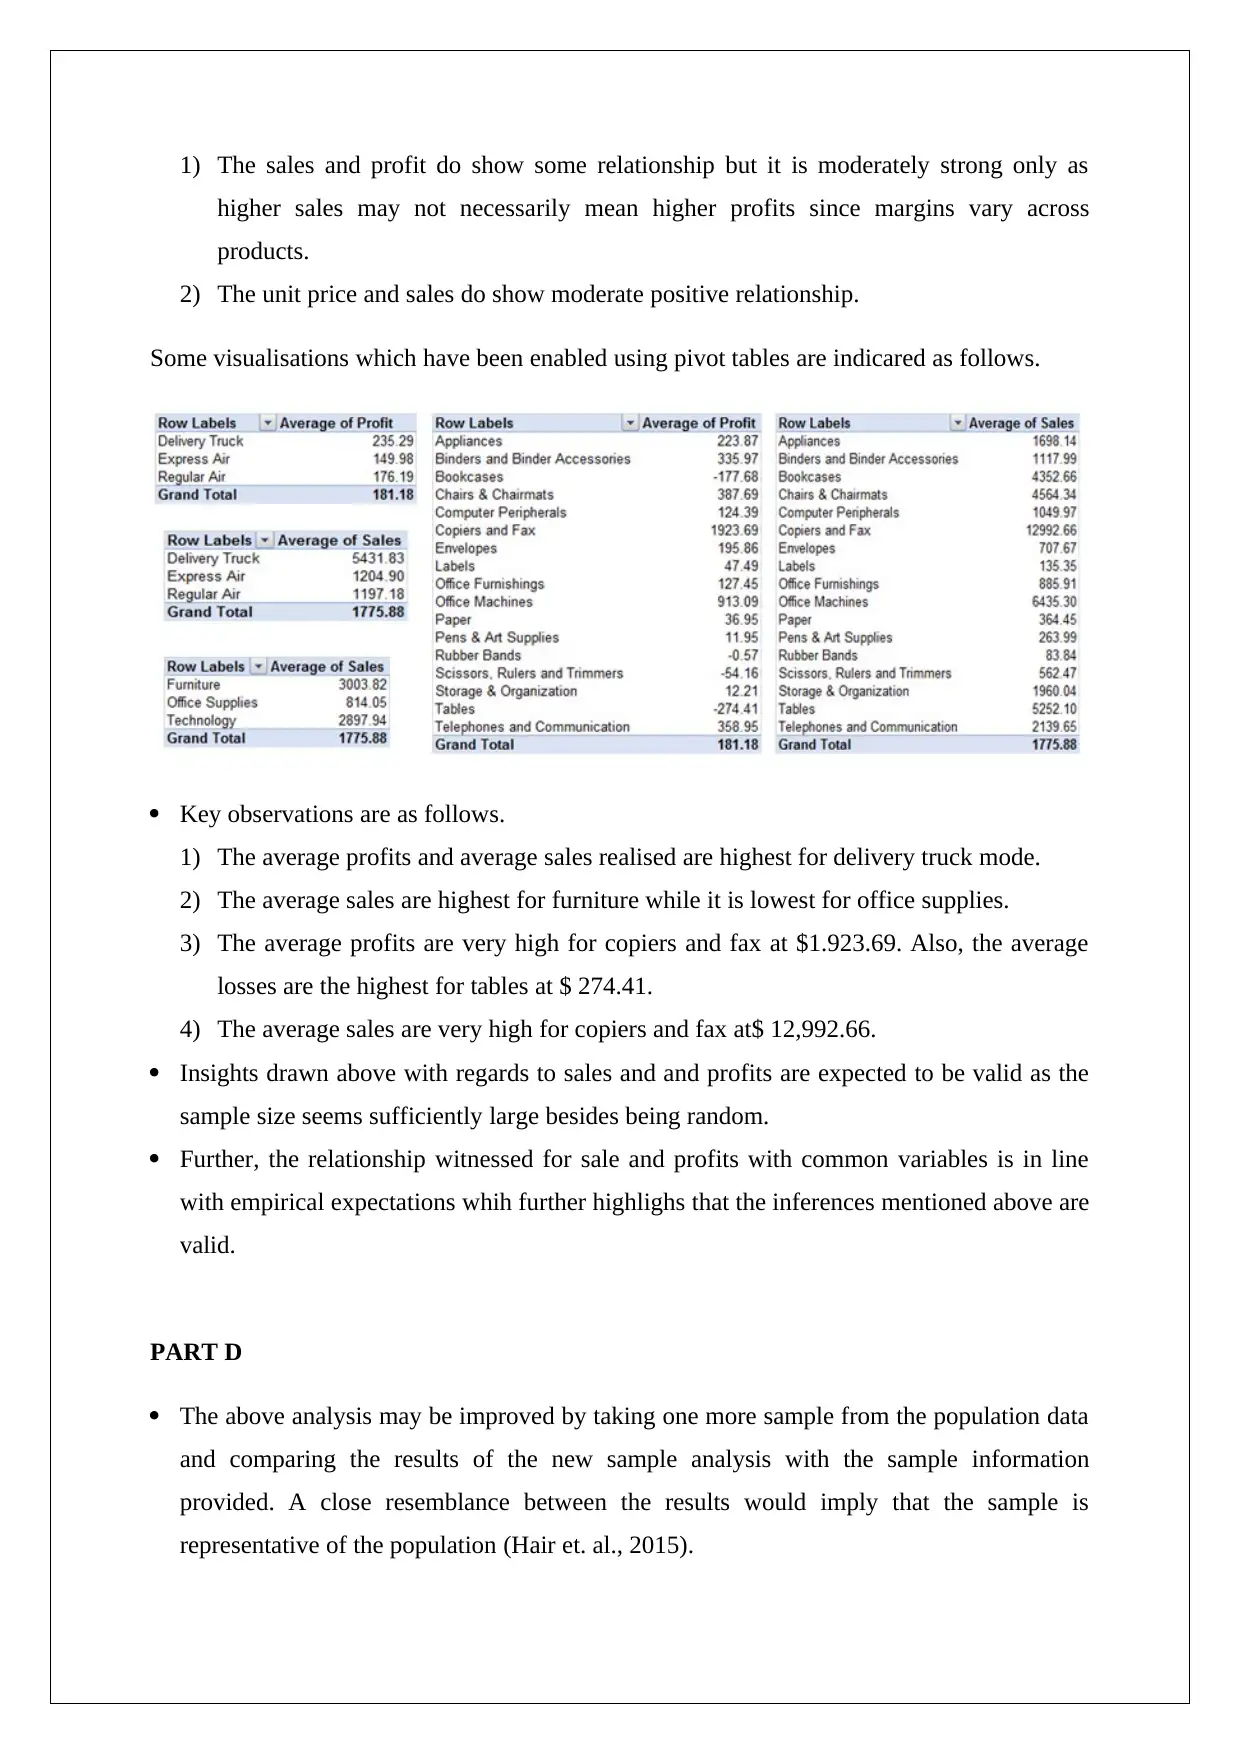
This report analyzes a sales dataset from a retail organization, focusing on deriving insights to improve operations and profitability. The analysis includes assessing data quality, identifying key variables, and examining their relationships through correlation matrices and visualizations. The report explores the impact of various factors, such as order quantity, unit price, product category, and shipping mode, on sales and profits. Key findings reveal moderate relationships between sales and profit, highlighting the influence of product sub-categories and delivery methods on profitability. The report utilizes MS-Excel for data visualization, presenting insights through pivot tables and charts. Recommendations for improvement include optimizing the product mix, refining delivery strategies, and comparing results with peer companies and literature to ensure validity and accuracy. The analysis provides a foundation for future strategies, aiming to enhance sales and overall business performance. The report is a response to an MBA504 assignment.
Document Page
PROJECT MANAGEMENT
STUDENT ID:
[Pick the date]
tabler-icon-diamond-filled.svg

Paraphrase This Document

Need a fresh take? Get an instant paraphrase of this document with our AI Paraphraser
Document Page
PART A
The following are the key attributes related to the given dataset (Eriksson and Kovalainen,
2015).
1) There are very few values which are missing in the data which implies that this
problem can be resolved without impacting the original data set in any significant
manner. Also, the missing values seem to be random only.
2) The sample size considered by the dataset is quite large which allows better
comparison and relationship building across the given variables.
3) The relevant variables which would be of interest to the user such as sales and profit
have been included. Additionally, the variables influencing these two have also been
reflected in the dataset.
4) Considering that the dataset is not skewed towards the use of a particualr type of data
i.e. quantitiative or qualitative, hence the range of tools available for analysis
increases.
Considering the above reasons, the data quality does not pose much concerns and hence
has a superior quality.
The given data provides information on randomly selected 8399 customer purchases.
The data presented for each of these customer purchases has used qualitative as well as
quantitative variables which provides extensive information about the transactions.
Some of the qualitative variables included in the dataset are producr category, mode of
shipping, product sub-category, order priority etc.
Some of the quantiative variables included in the dataset are are unit sales, profit, sales,
discount, order quantity etc.
PART B
The impact of the various factors on profitbaility has been analysed based on the
correlation matrix between the potential variables.
1) It would be expected that higher order quantity would typcially lead to higher profits
but the relationship witnessed based on given data is weak in strength despite being
positive. This may be attributed to lower pricing for bulk orders.
2) The sales and profits tend to have a moderately strong positive relationship which is
not surprising.
Document Page
3) It is evdient that highest profits on average are attributed to the products which are
transported through truck. This may be attributed to this transportation means having
lower cost than other transportation means.
4) Technology seems to have the highst profit margin which is not expected as the
margins are quite high in this product segment owing to the variables costs being quite
limited and the selling price being quite high.
5) In technology also, the highest amount of profits are seen in copiers and faxes. This
implies that product sub-category also drives profitability.
The impact of the various factors on sales has been analysed based on the correlation
matrix between the potential variables.
1) Unit price is a key determinant since sales is directly proportional to the changes in
unit price but the relationship is moderate in stregnth.
2) The order quantity also influences the sales but the relationship is weaker than
expected which may be attributed to potential discounts being given on bulk orders.
3) The average selling prices of different product and sub-categories differs as technology
driven copies and fax tend to have higher sale price leading to higher sales.
4) A noteworthy aspect is that the sales is not driven by discounts in any significant
manner.
PART C
Some of the key visualisations for the given data using MS-Excel as attached beow.
Key observations are as follows.
Document Page
1) The sales and profit do show some relationship but it is moderately strong only as
higher sales may not necessarily mean higher profits since margins vary across
products.
2) The unit price and sales do show moderate positive relationship.
Some visualisations which have been enabled using pivot tables are indicared as follows.
Key observations are as follows.
1) The average profits and average sales realised are highest for delivery truck mode.
2) The average sales are highest for furniture while it is lowest for office supplies.
3) The average profits are very high for copiers and fax at $1.923.69. Also, the average
losses are the highest for tables at $ 274.41.
4) The average sales are very high for copiers and fax at$ 12,992.66.
Insights drawn above with regards to sales and and profits are expected to be valid as the
sample size seems sufficiently large besides being random.
Further, the relationship witnessed for sale and profits with common variables is in line
with empirical expectations whih further highlighs that the inferences mentioned above are
valid.
PART D
The above analysis may be improved by taking one more sample from the population data
and comparing the results of the new sample analysis with the sample information
provided. A close resemblance between the results would imply that the sample is
representative of the population (Hair et. al., 2015).
tabler-icon-diamond-filled.svg

Paraphrase This Document

Need a fresh take? Get an instant paraphrase of this document with our AI Paraphraser
Document Page
Further, external validity of the results witnessed would need to be assured through
comparison with peer companies. This is because if the results are similar for other peer
companies as well, then the results are most likely to be accurate (Flick, 2015).
Additionally, literature review on retail sales ought to be considered to determine if the
results are correct or not.
Possible future strategies are as follows.
1) The company needs to focus in improving the travel mode and delivery mix so as to
lower the costs and improve the profitability.
2) The product mix ought to be focused on considering that profitability is different for
various product categories. This would enable higher profits.
3) The company should focus on products which would increase the overall sales and
therefore can lead to higher profits.
Document Page
References
Eriksson, P. and Kovalainen, A. (2015) Quantitative methods in business research. 3rd ed.
London: Sage Publications.
Flick, U. (2015) Introducing research methodology: A beginner's guide to doing a research
project. 4th ed. New York: Sage Publications.
Hair, J. F., Wolfinbarger, M., Money, A. H., Samouel, P., and Page, M. J. (2015) Essentials
of business research methods. 2nd ed. New York: Routledge.
chevron_up_icon
1 out of 6
circle_padding
hide_on_mobile
zoom_out_icon
[object Object]