Monthly Demand Review: Action Plan for Forecast Improvement

Verified

Added on  2023/06/11

|7
|379
|95
Report
AI Summary
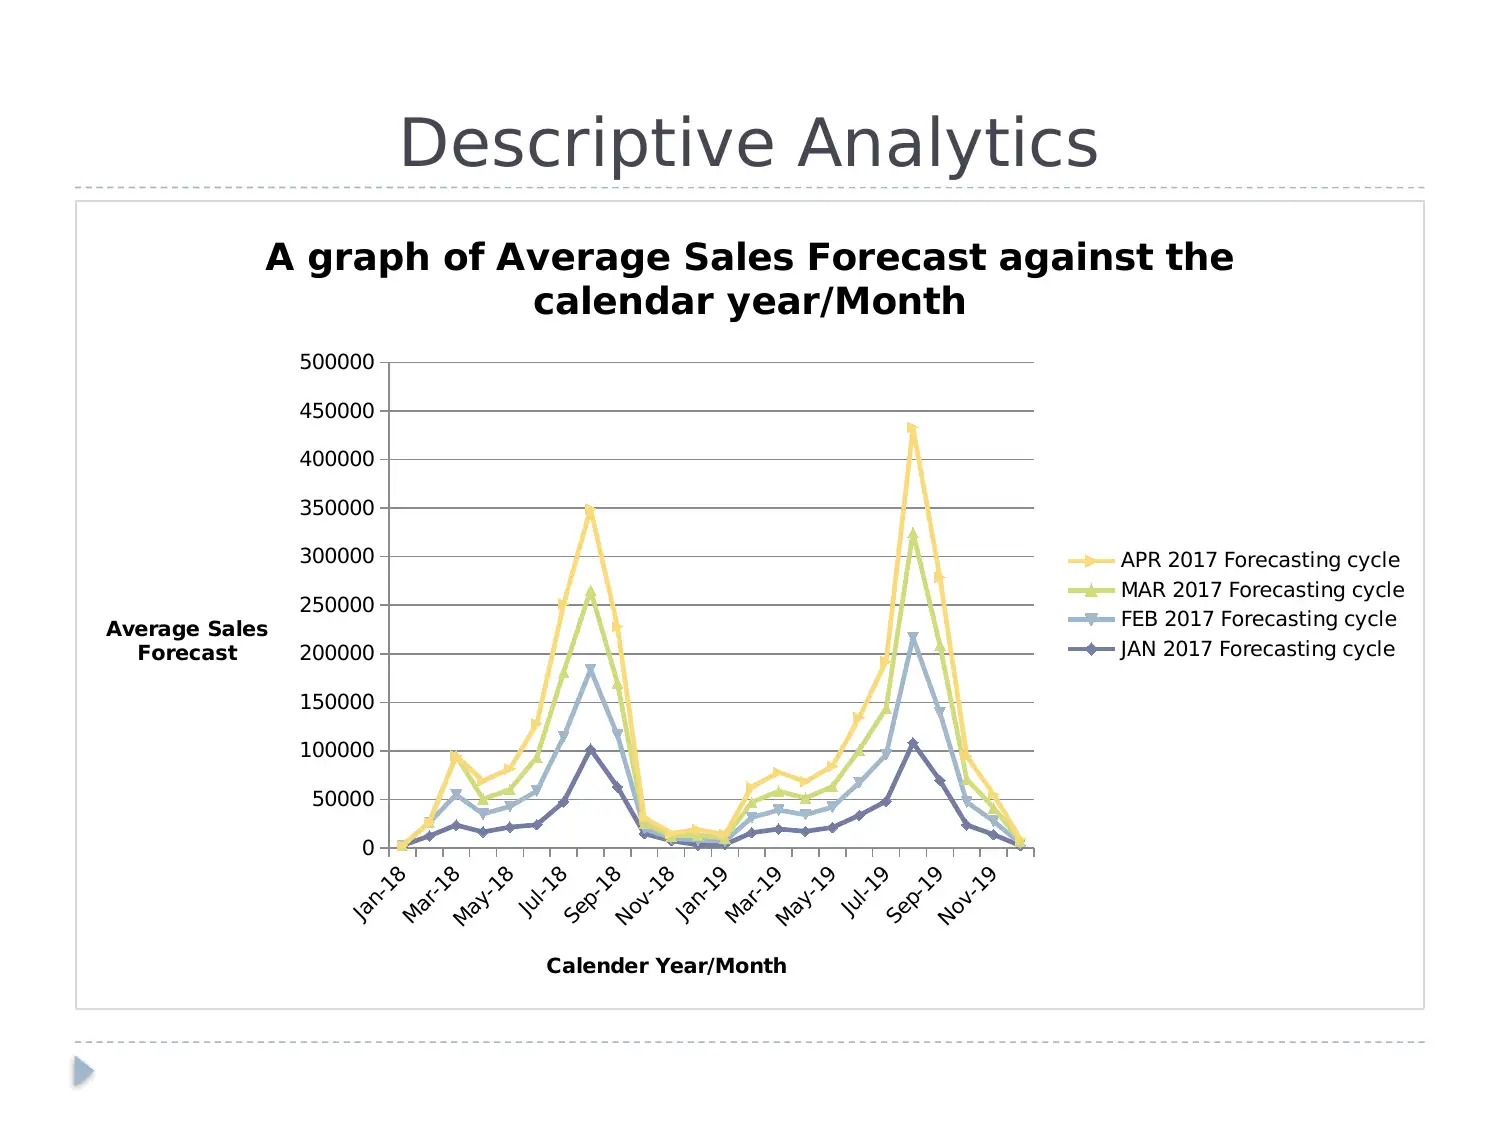
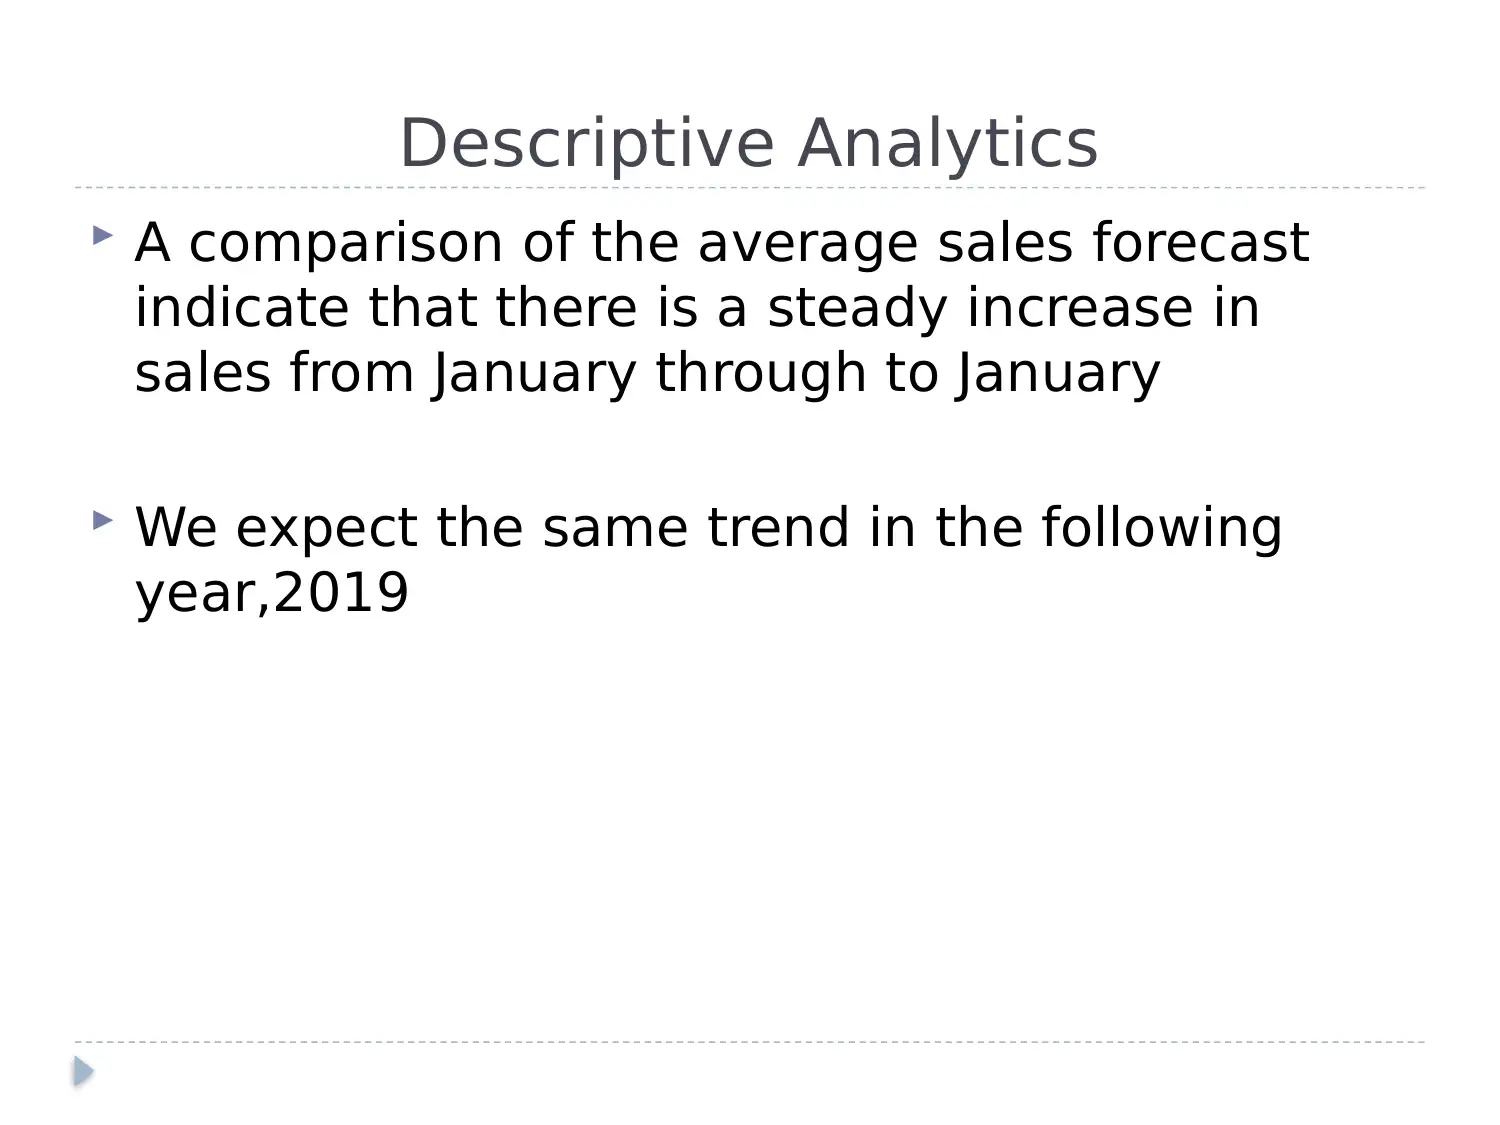
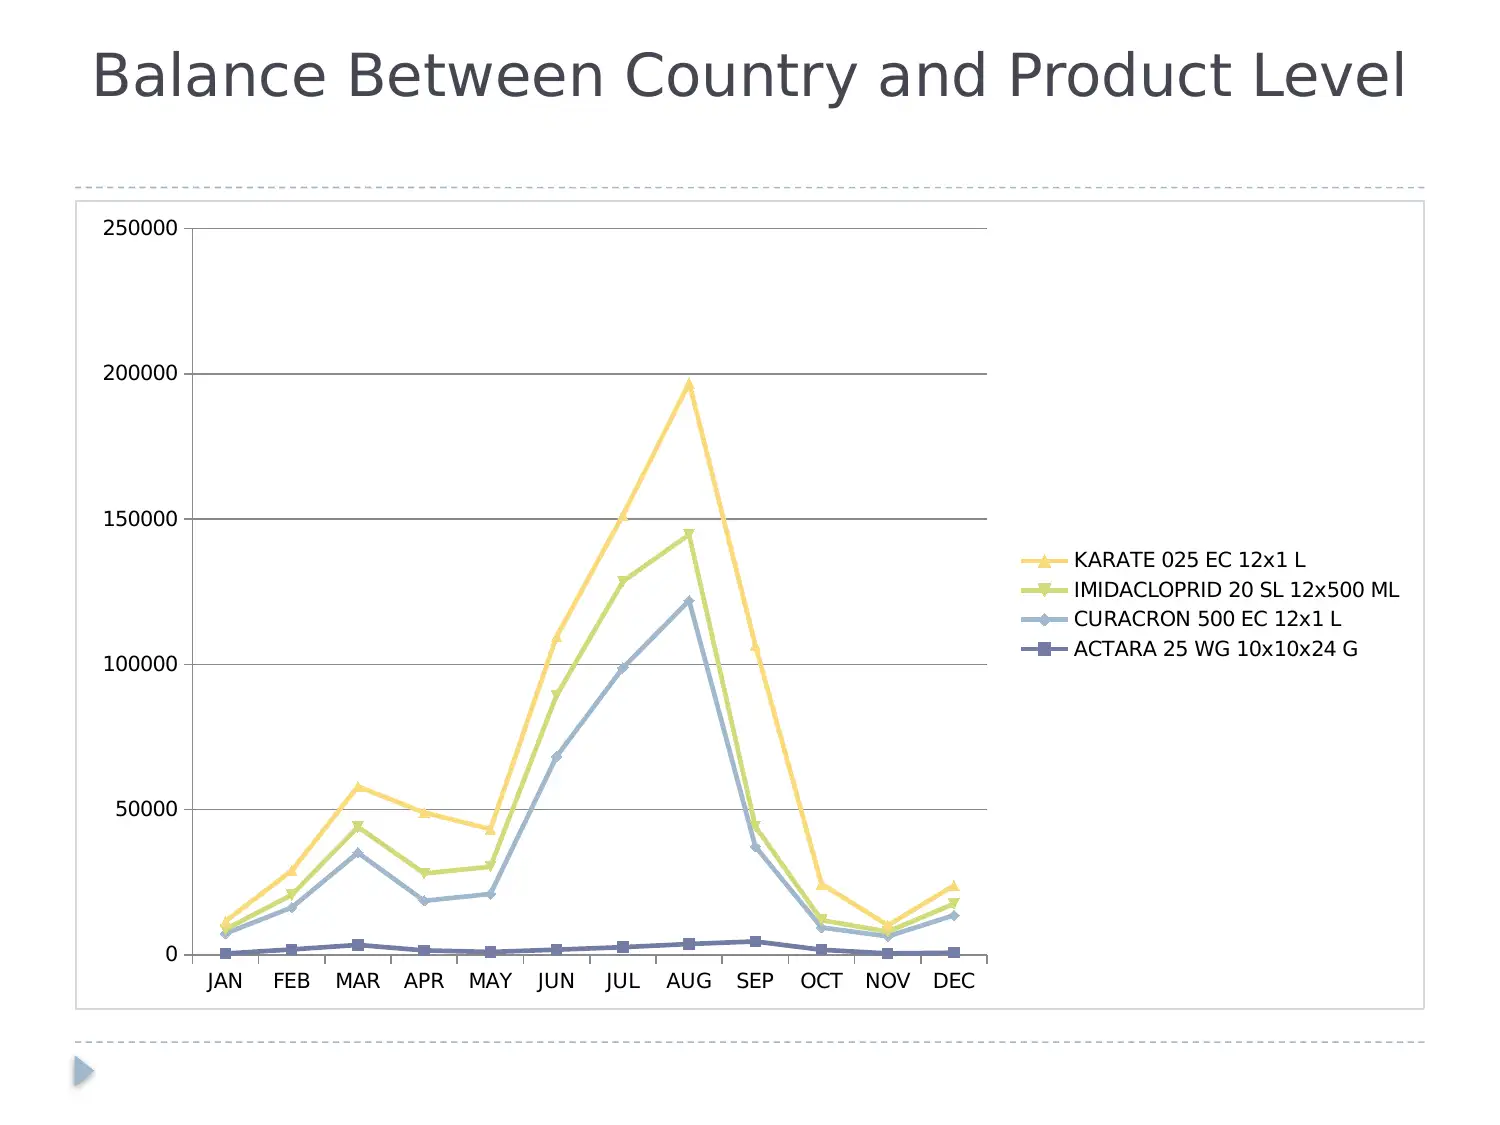
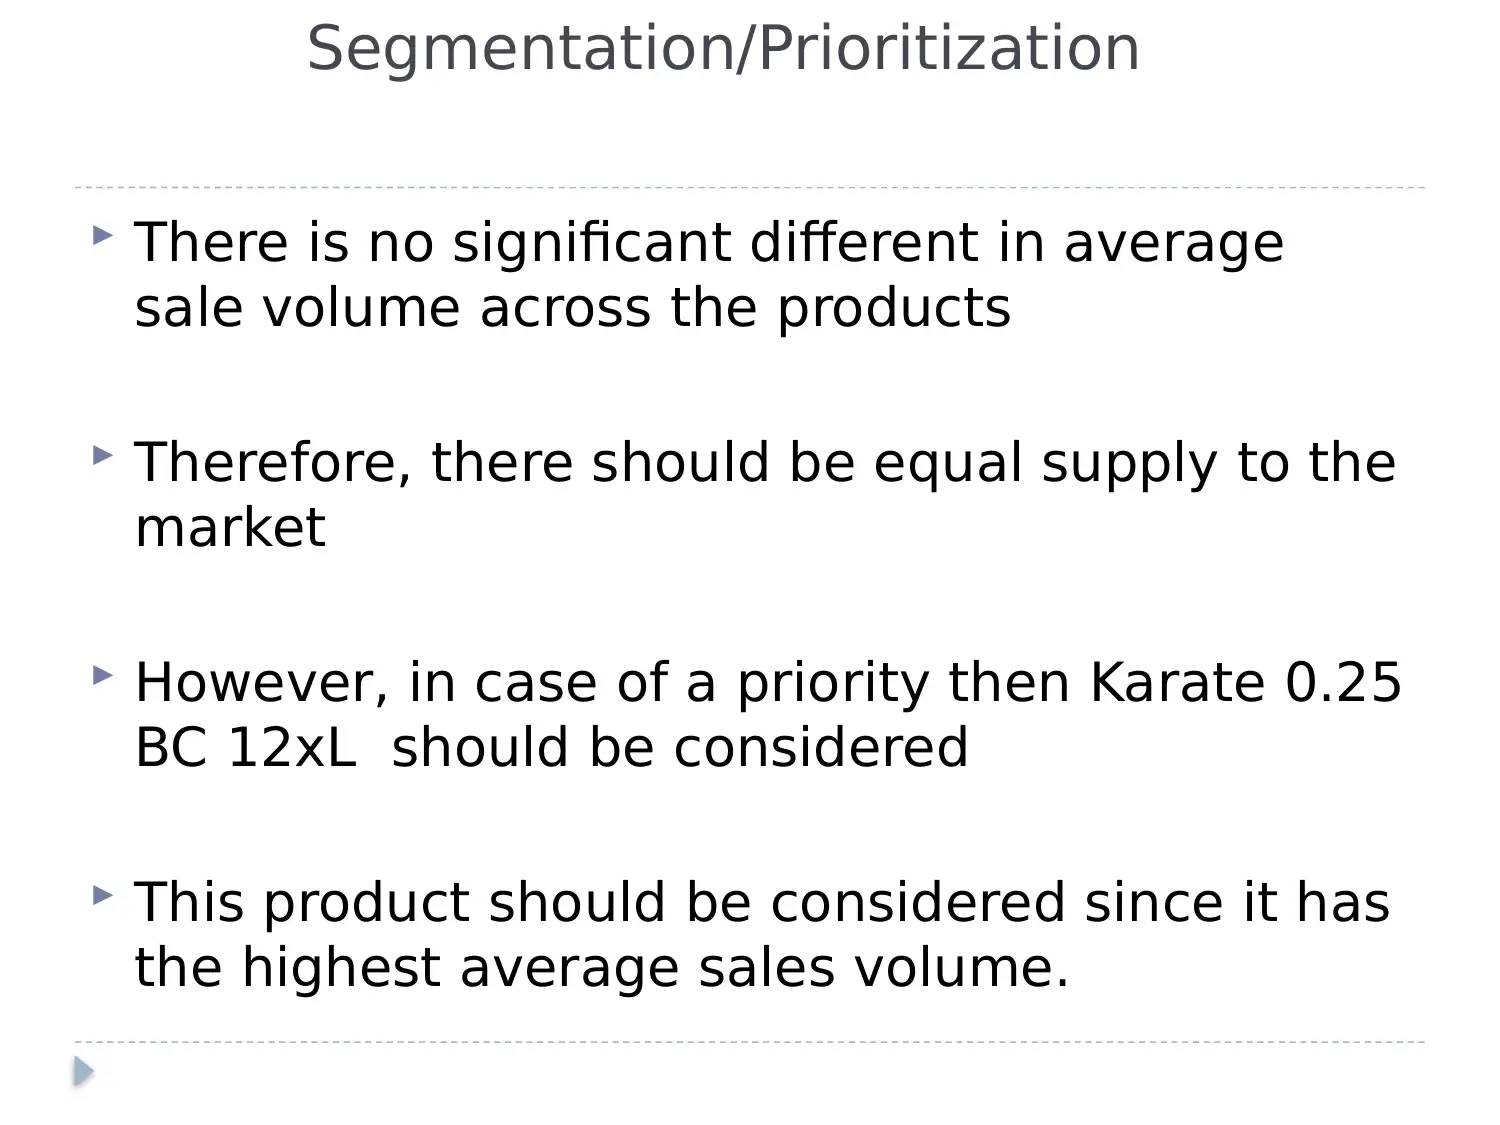
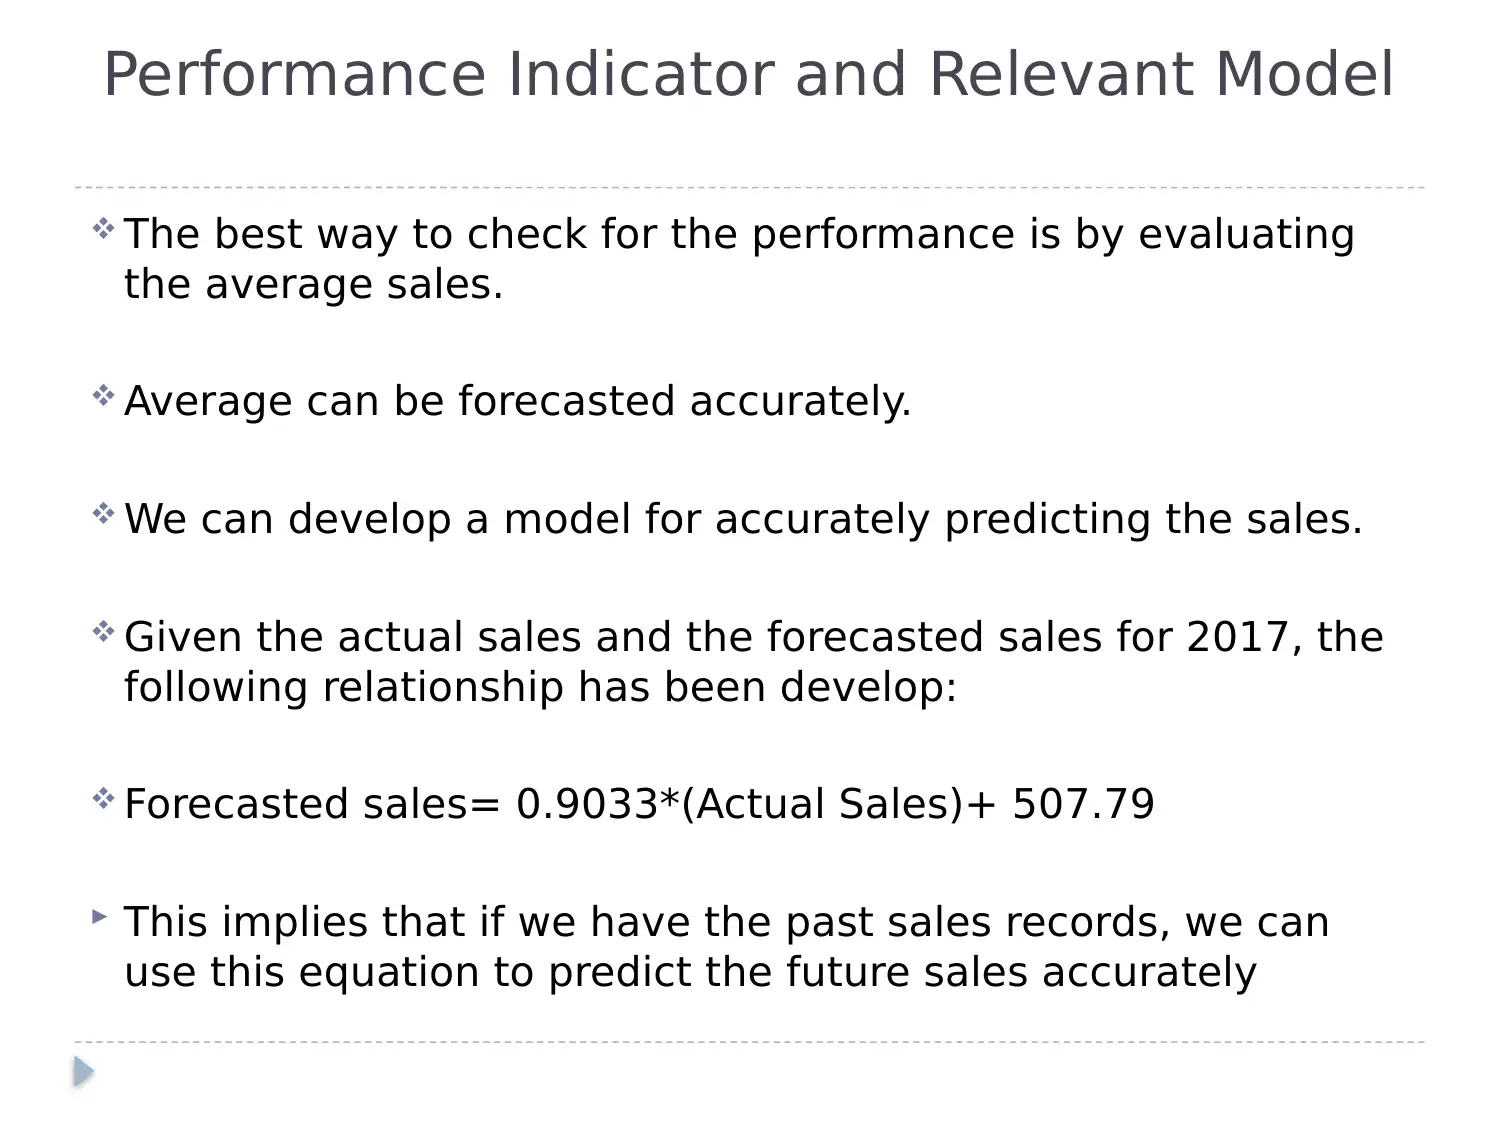
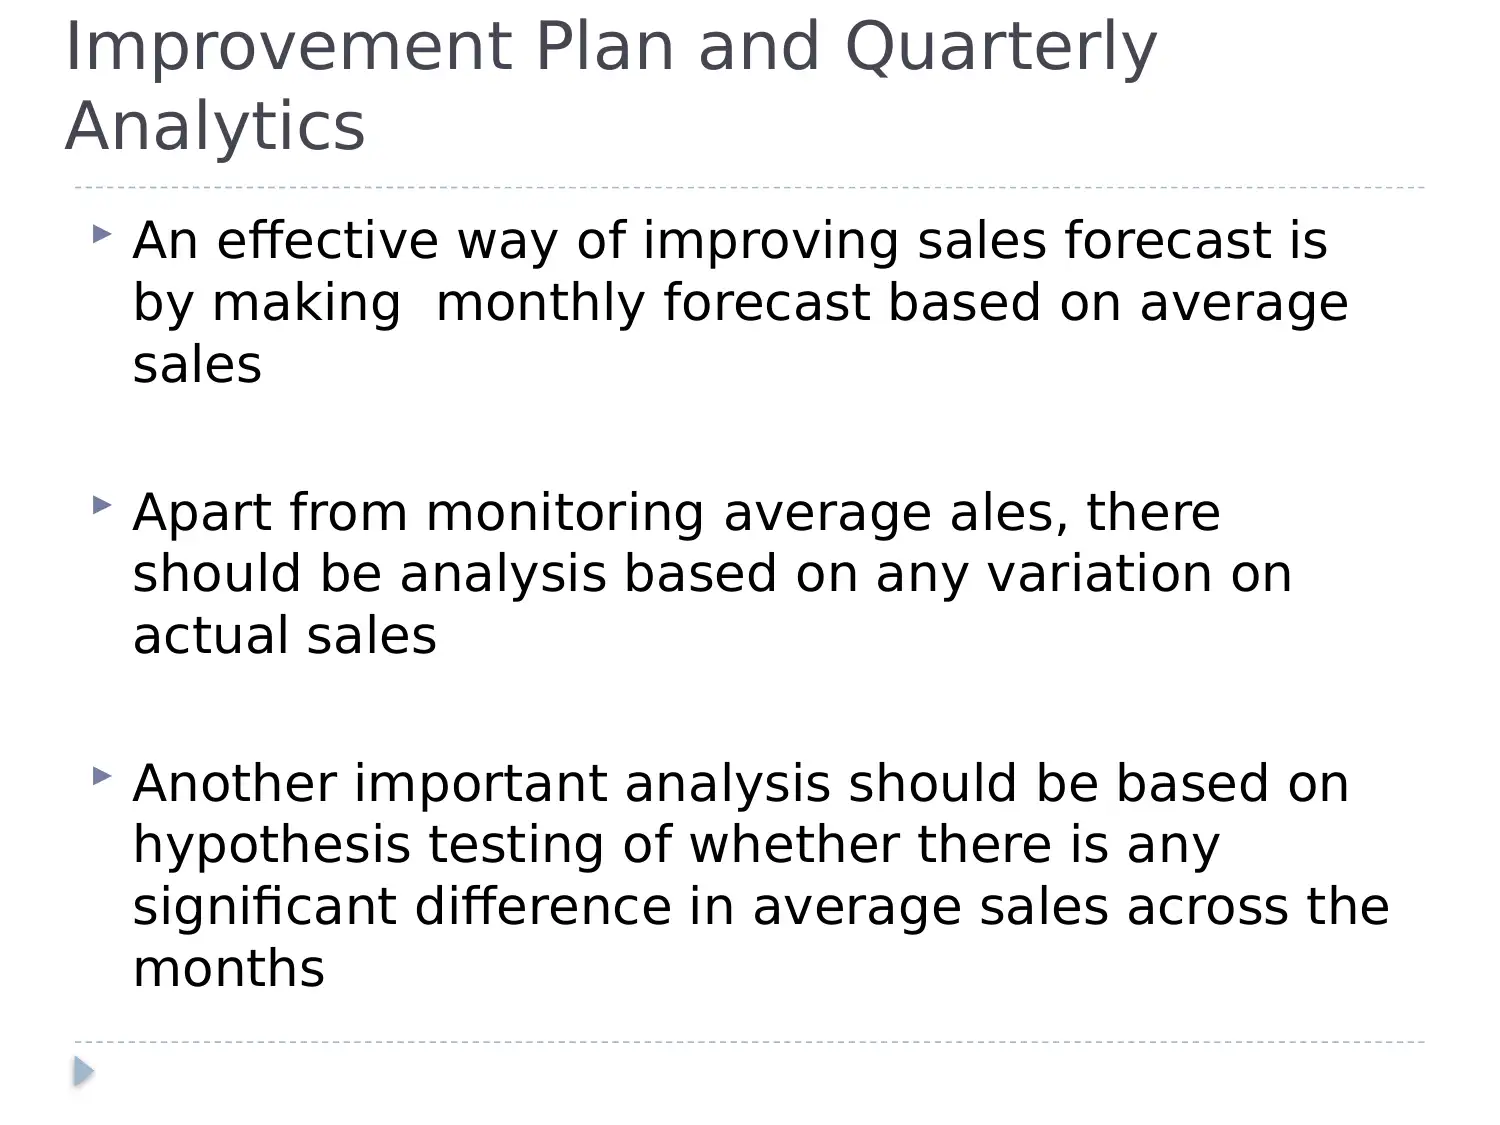
This report provides an action plan for enhancing sales forecast effectiveness, focusing on a monthly demand review process implemented in May 2018. Descriptive analytics are used to analyze average sales forecasts over a calendar year, revealing a steady increase from January to January, with expectations of a similar trend in 2019. The report assesses the balance between country and product levels, noting no significant difference in average sales volume across products, suggesting equal supply to the market, although Karate 0.25 BC 12xL is highlighted as a priority due to its highest average sales volume. A performance indicator model is developed, forecasting sales based on past records using the equation: Forecasted sales = 0.9033*(Actual Sales) + 507.79. The improvement plan involves making monthly forecasts based on average sales, monitoring variations in actual sales, and hypothesis testing for significant differences in average sales across months.
Document Page
Action Plan for Forecast
effectiveness Improvement
Monthly Demand Review Meeting May 2018
tabler-icon-diamond-filled.svg

Paraphrase This Document

Need a fresh take? Get an instant paraphrase of this document with our AI Paraphraser
Document Page
Descriptive Analytics
Jan-18
Mar-18
May-18
Jul-18
Sep-18
Nov-18
Jan-19
Mar-19
May-19
Jul-19
Sep-19
Nov-19
0
50000
100000
150000
200000
250000
300000
350000
400000
450000
500000
A graph of Average Sales Forecast against the
calendar year/Month
APR 2017 Forecasting cycle
MAR 2017 Forecasting cycle
FEB 2017 Forecasting cycle
JAN 2017 Forecasting cycle
Calender Year/Month
Average Sales
Forecast
Document Page
Descriptive Analytics
A comparison of the average sales forecast
indicate that there is a steady increase in
sales from January through to January
We expect the same trend in the following
year,2019
Document Page
Balance Between Country and Product Level
JAN FEB MAR APR MAY JUN JUL AUG SEP OCT NOV DEC
0
50000
100000
150000
200000
250000
KARATE 025 EC 12x1 L
IMIDACLOPRID 20 SL 12x500 ML
CURACRON 500 EC 12x1 L
ACTARA 25 WG 10x10x24 G
tabler-icon-diamond-filled.svg

Paraphrase This Document

Need a fresh take? Get an instant paraphrase of this document with our AI Paraphraser
Document Page
Segmentation/Prioritization
There is no significant different in average
sale volume across the products
Therefore, there should be equal supply to the
market
However, in case of a priority then Karate 0.25
BC 12xL should be considered
This product should be considered since it has
the highest average sales volume.
Document Page
Performance Indicator and Relevant Model
The best way to check for the performance is by evaluating
the average sales.
Average can be forecasted accurately.
We can develop a model for accurately predicting the sales.
Given the actual sales and the forecasted sales for 2017, the
following relationship has been develop:
Forecasted sales= 0.9033*(Actual Sales)+ 507.79
This implies that if we have the past sales records, we can
use this equation to predict the future sales accurately
Document Page
Improvement Plan and Quarterly
Analytics
An effective way of improving sales forecast is
by making monthly forecast based on average
sales
Apart from monitoring average ales, there
should be analysis based on any variation on
actual sales
Another important analysis should be based on
hypothesis testing of whether there is any
significant difference in average sales across the
months
chevron_up_icon
1 out of 7
circle_padding
hide_on_mobile
zoom_out_icon
[object Object]