Database System Project: Sales and Marketing Management Analysis
VerifiedAdded on 2021/02/20
|28
|1151
|183
Project
AI Summary
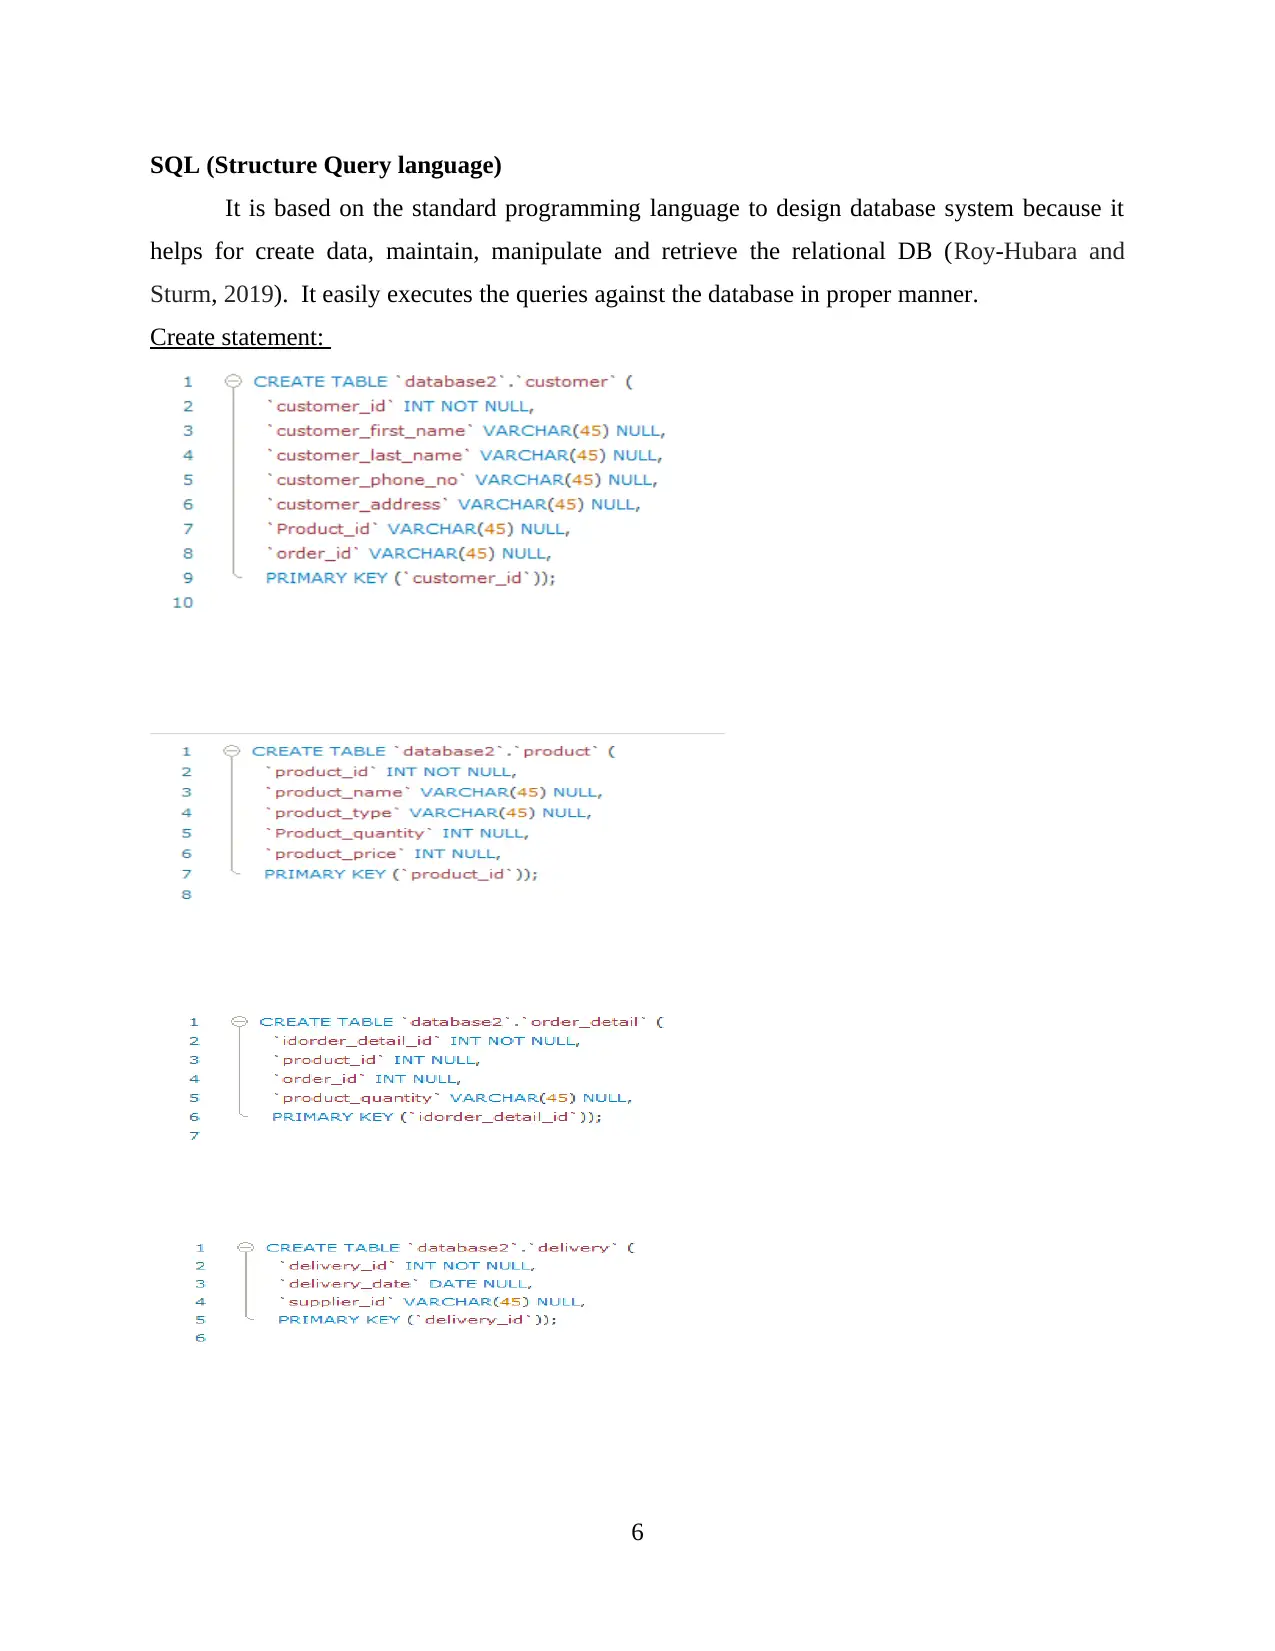
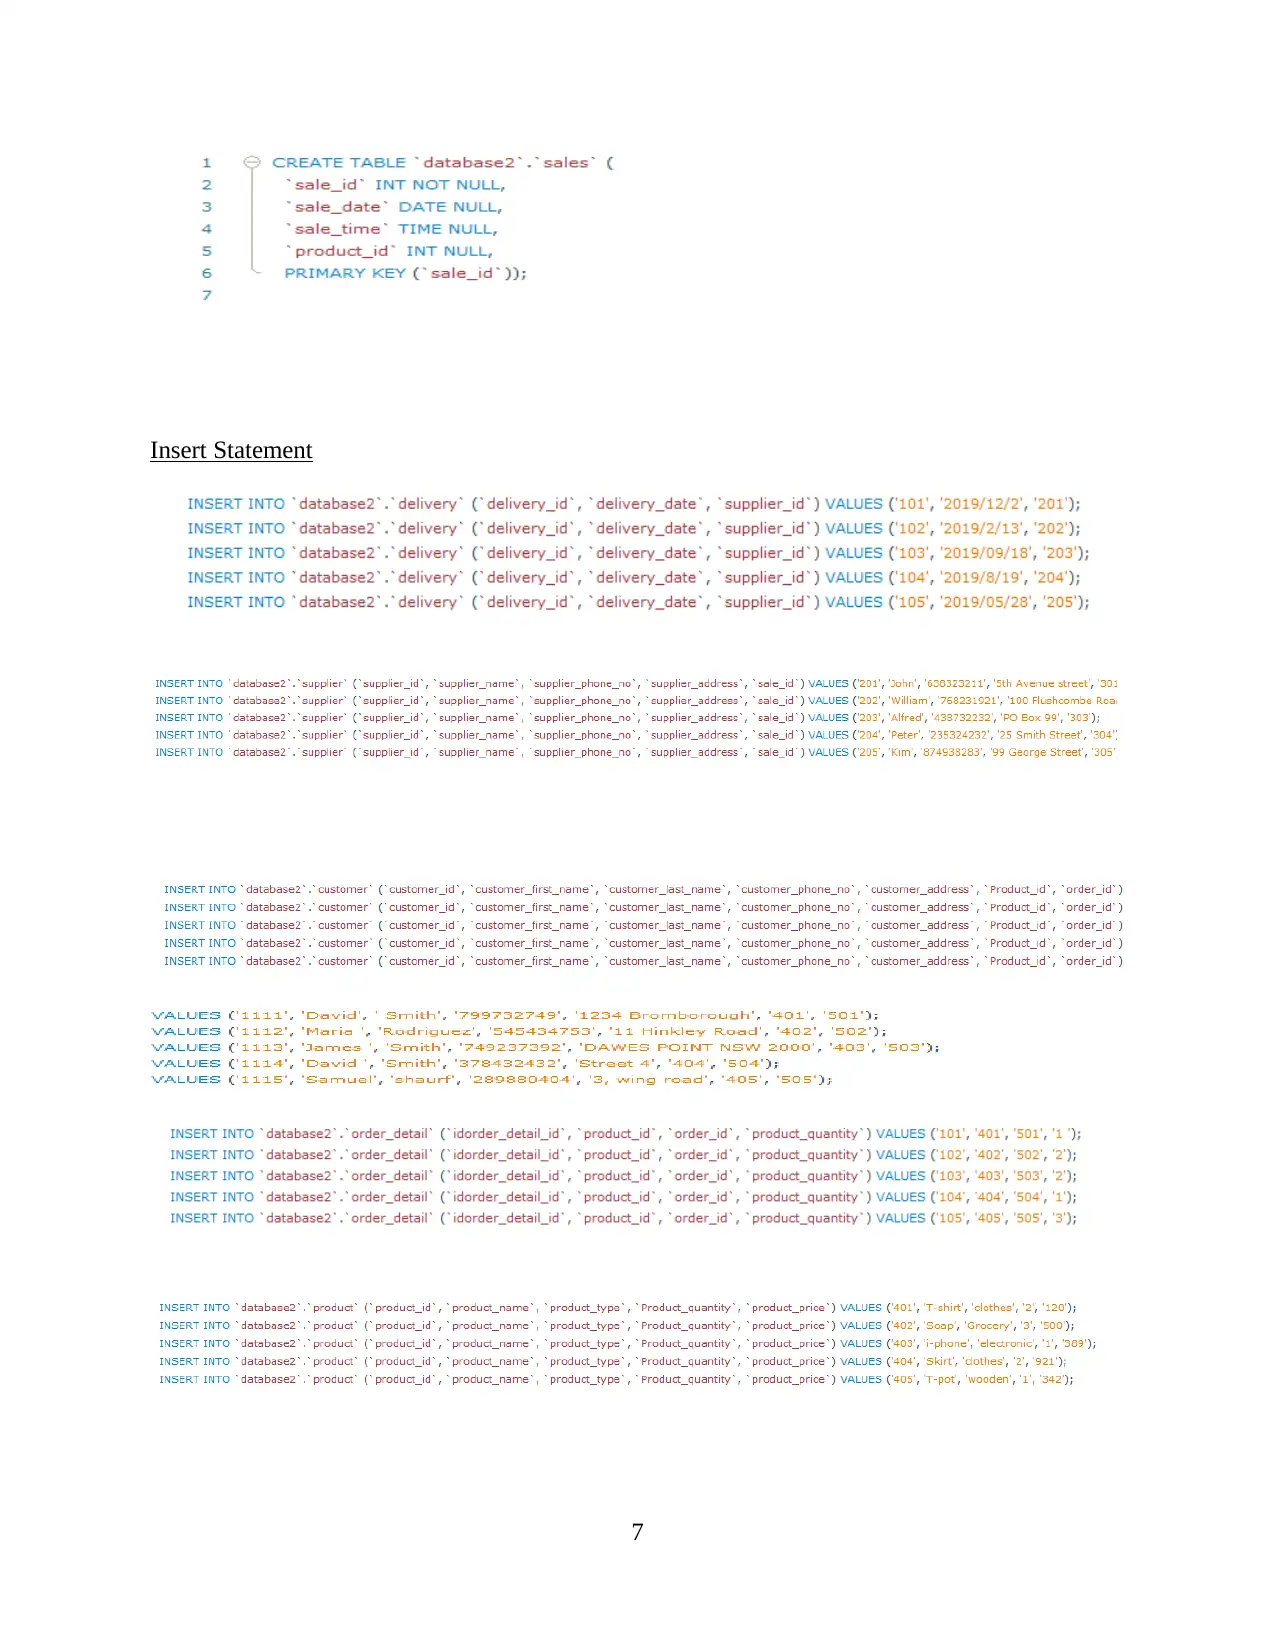
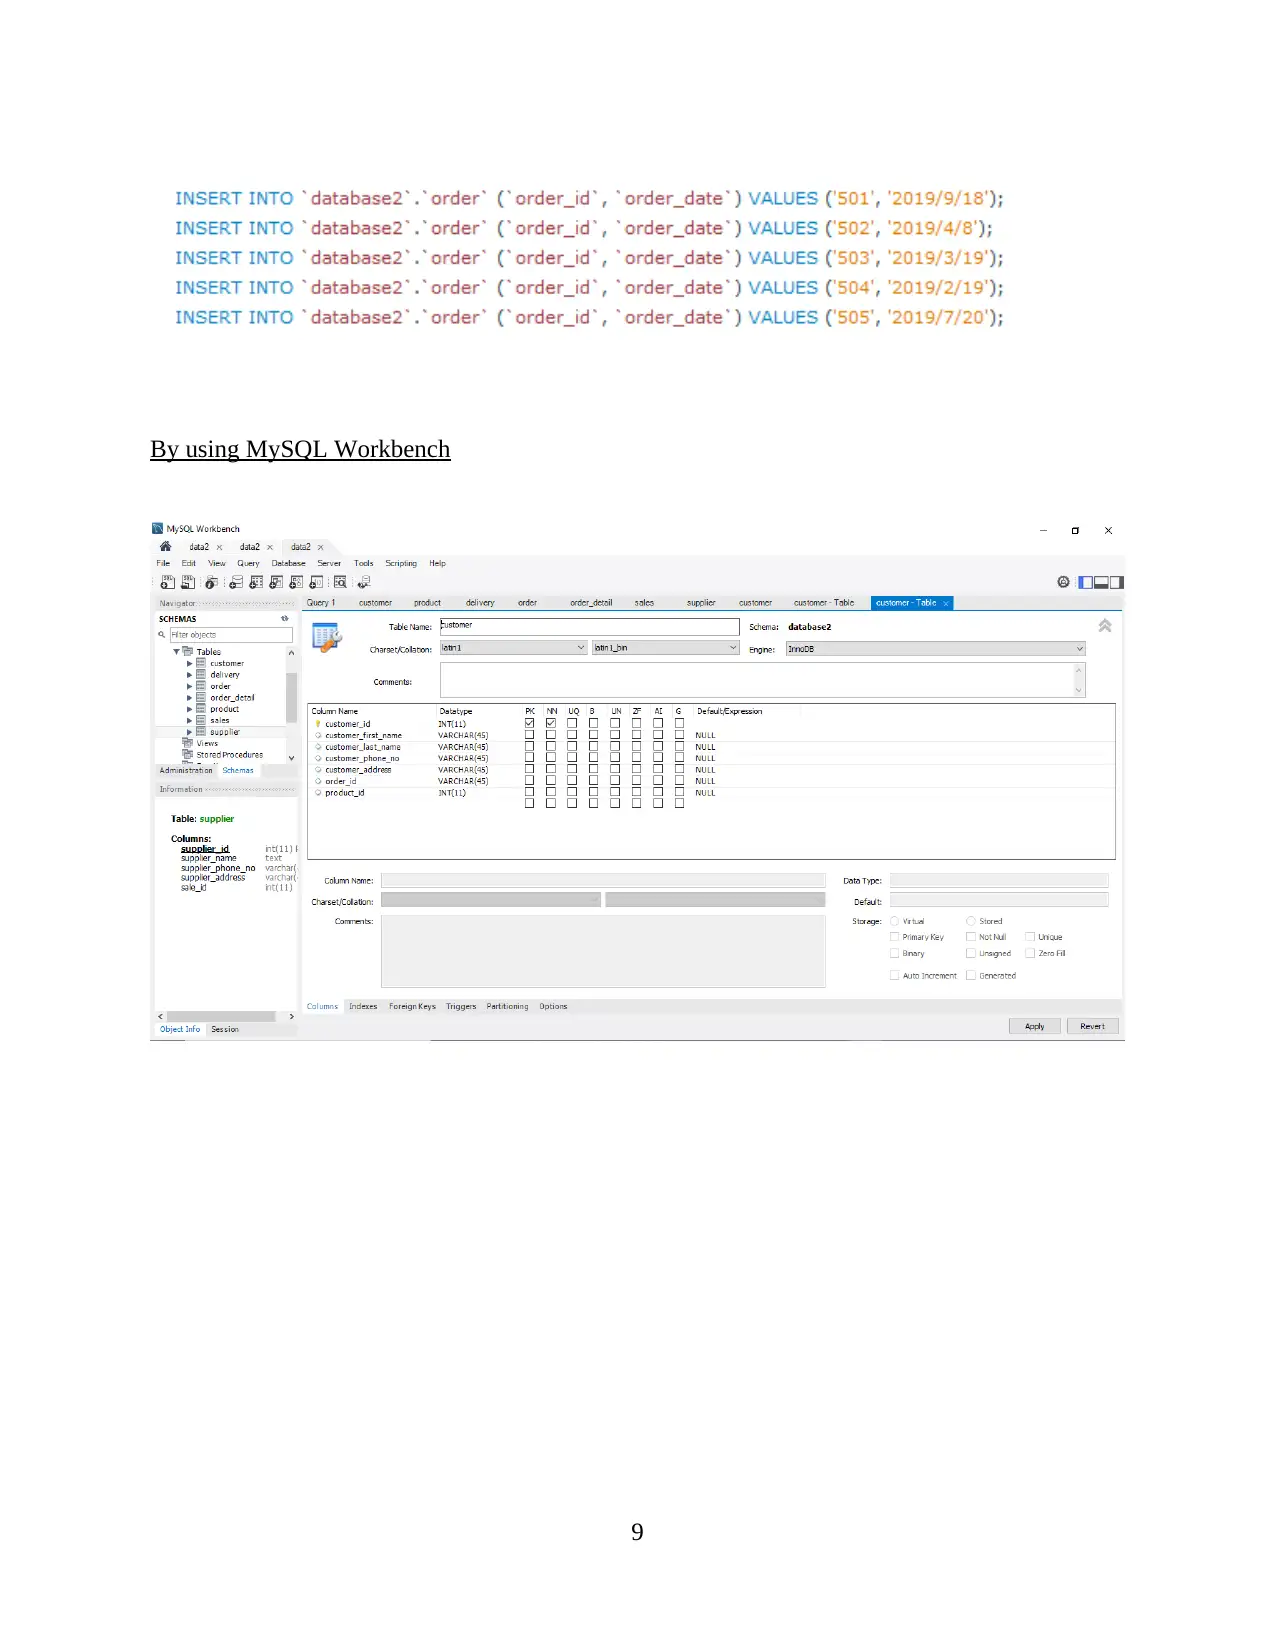
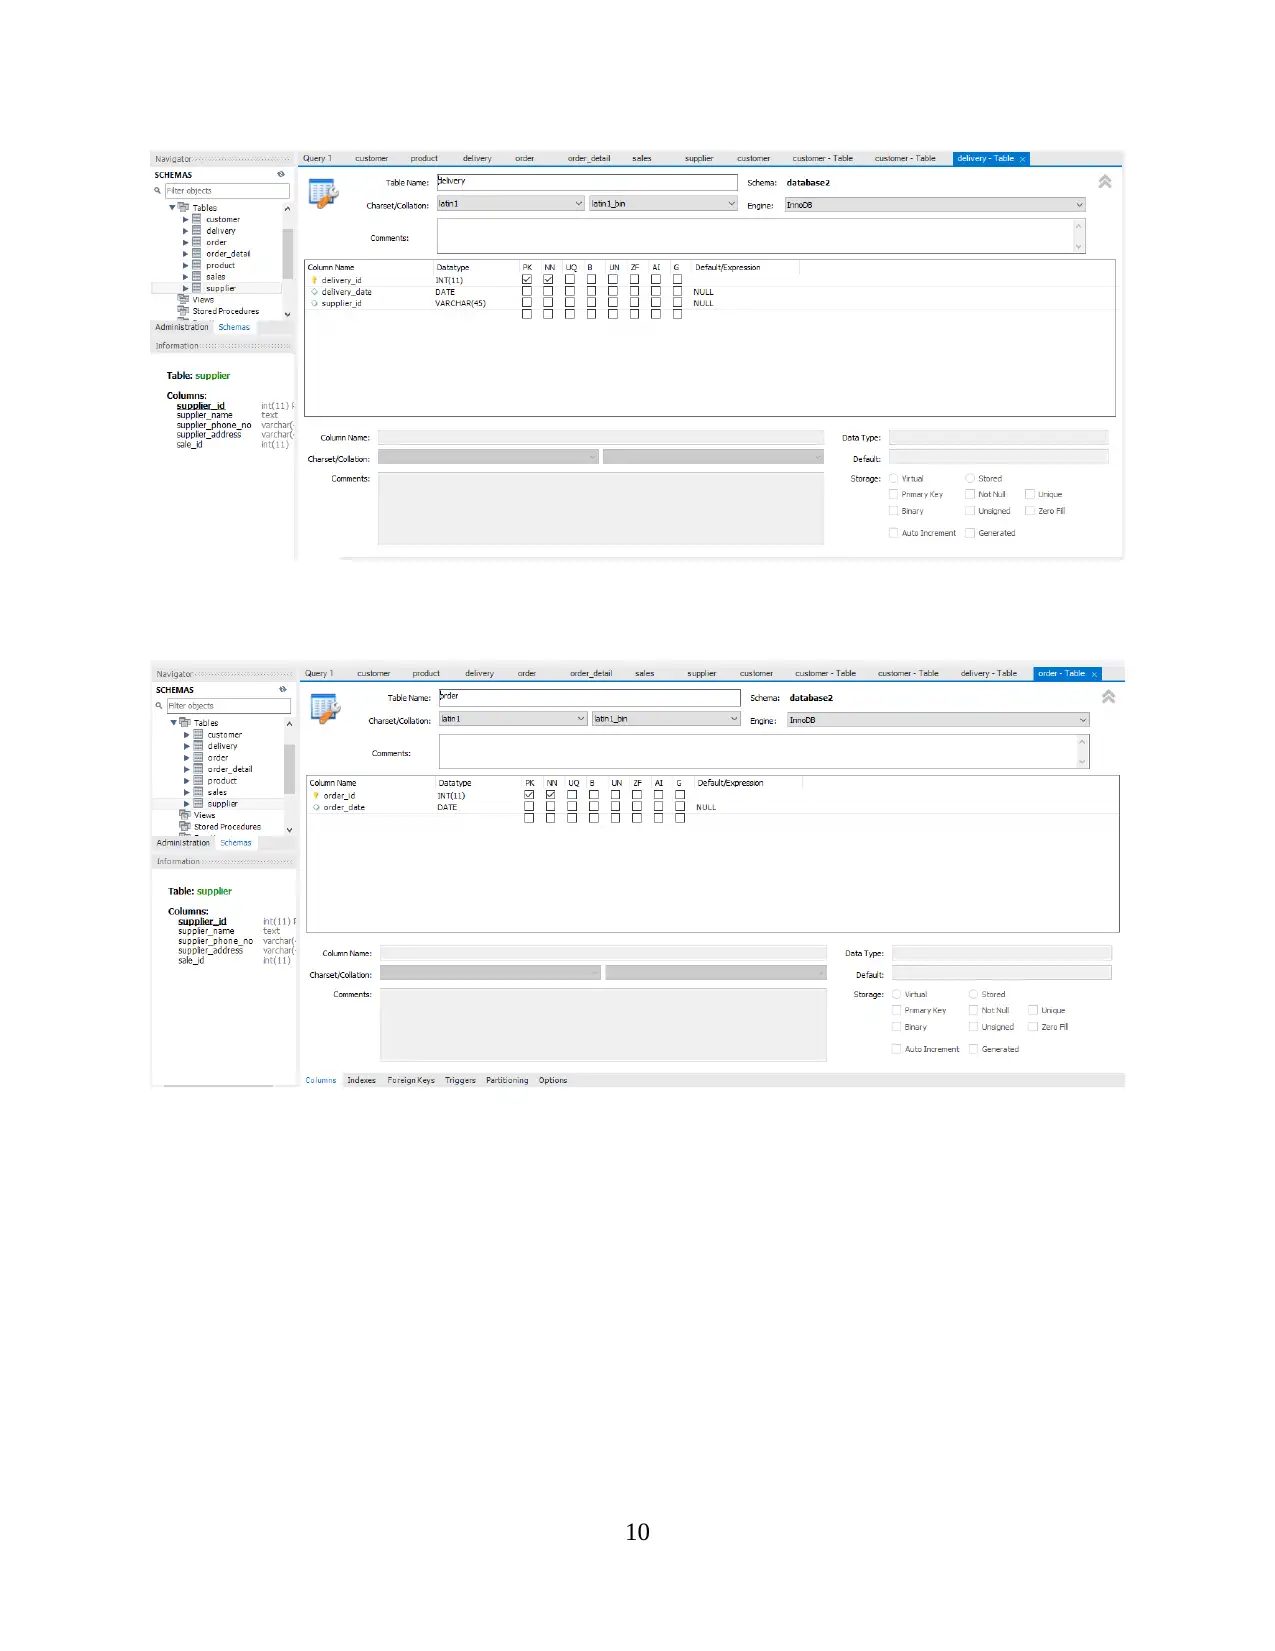
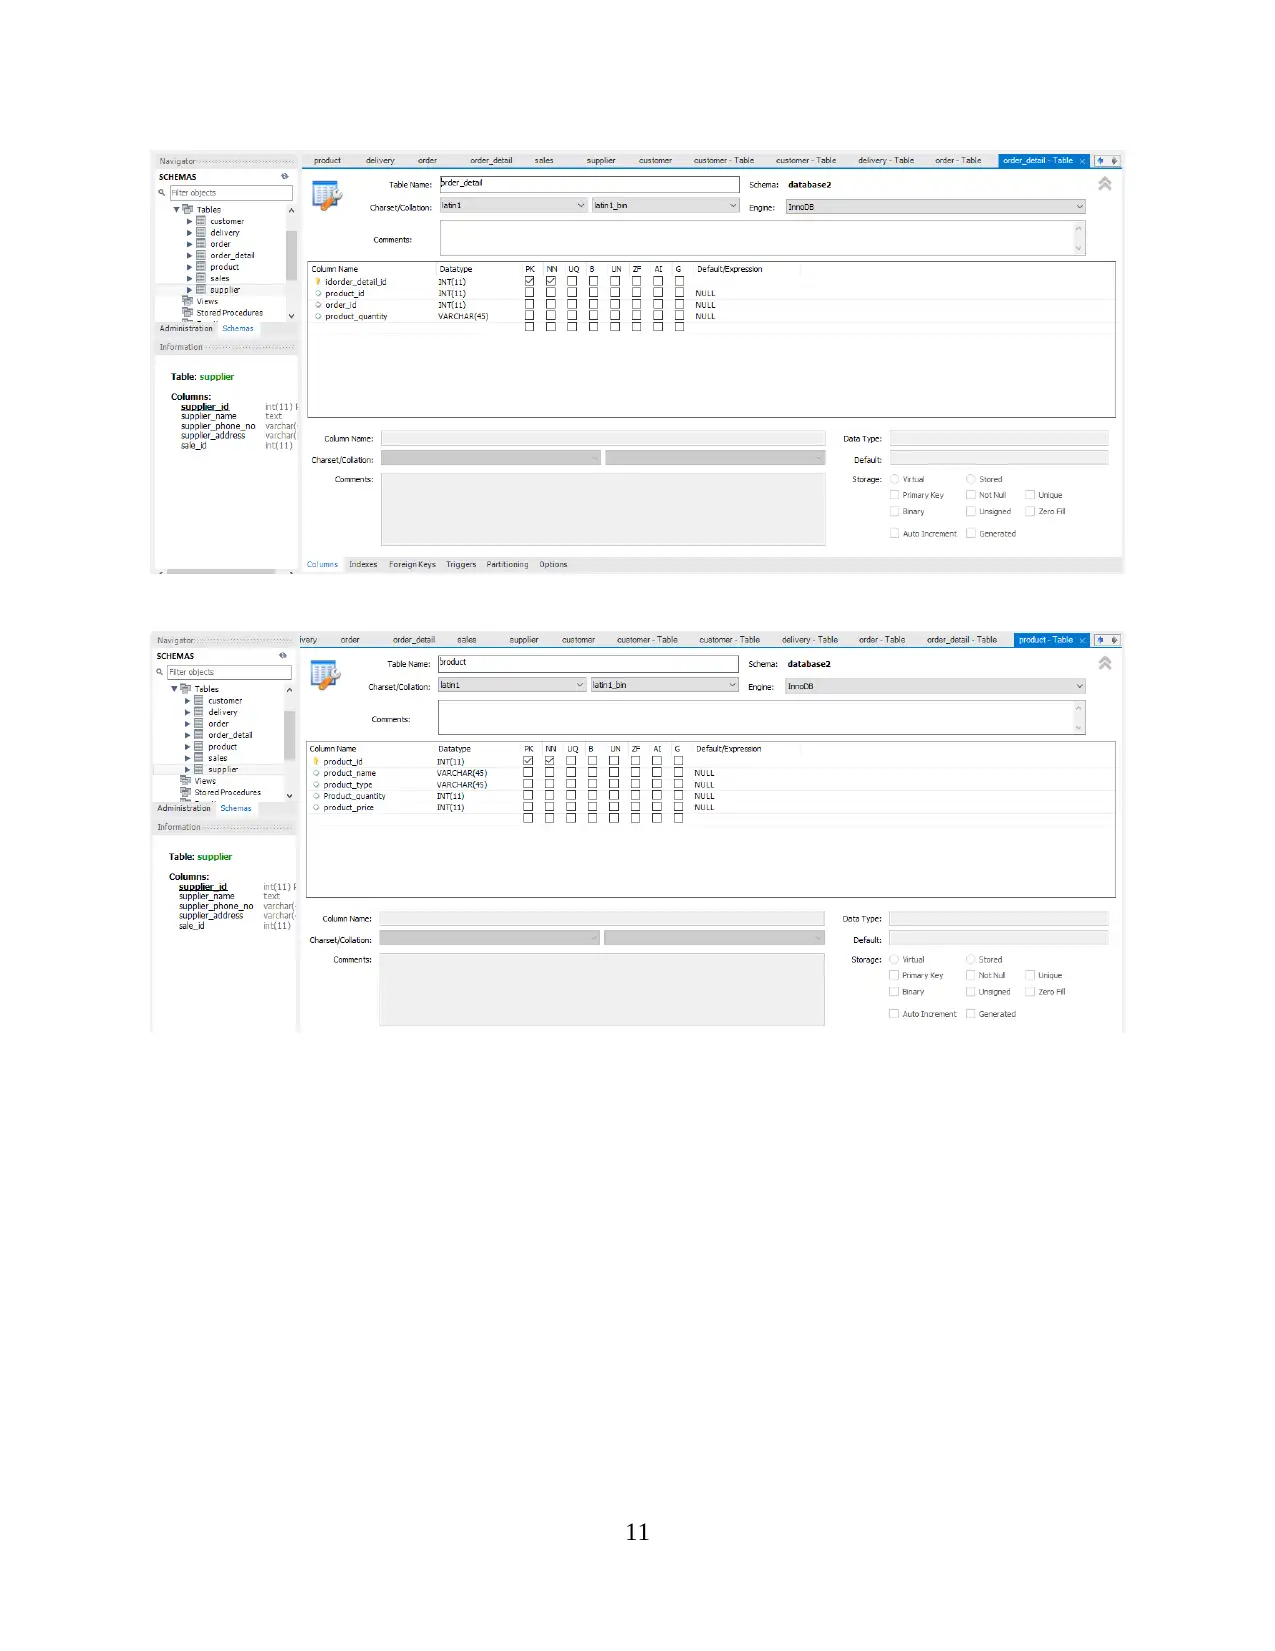
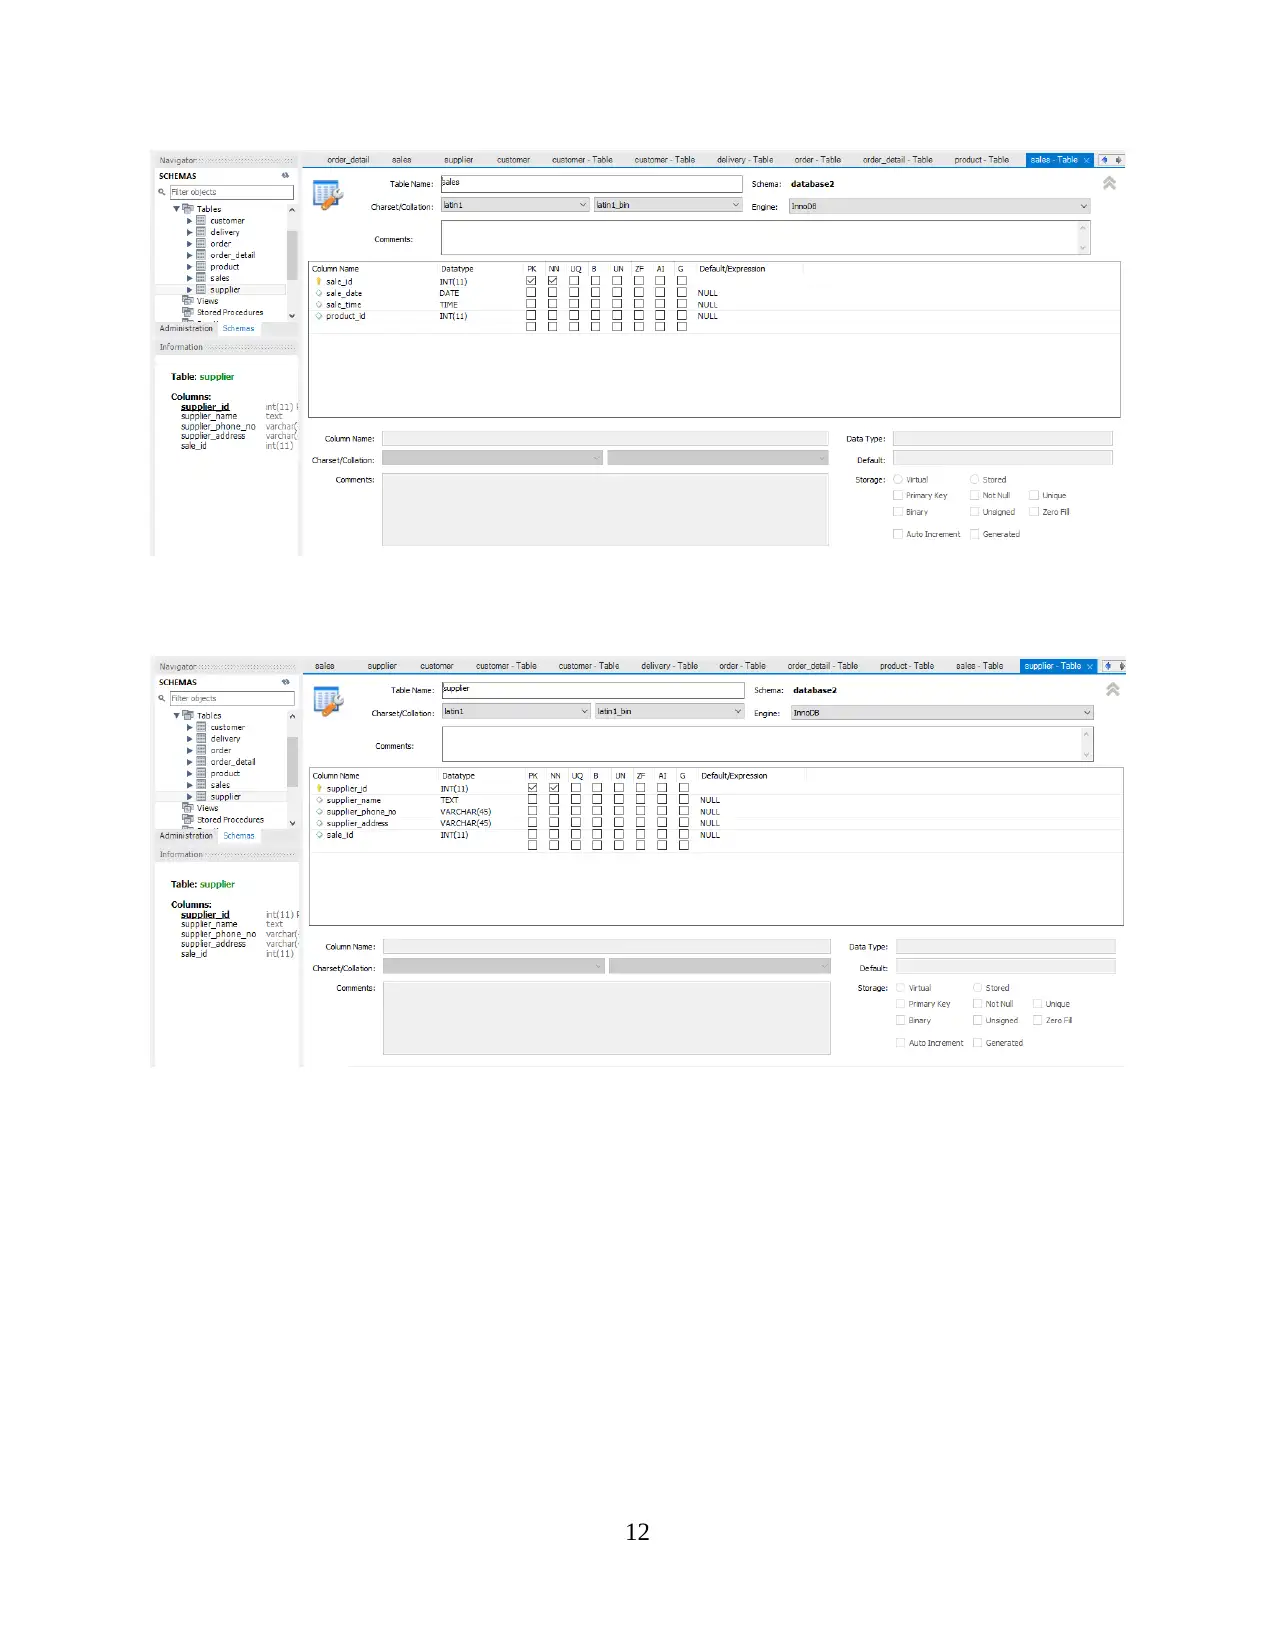
This assignment presents a comprehensive project on designing and analyzing a sales and marketing database system. It begins with an introduction to the importance of critical thinking and technical skills in solving business problems, followed by the creation of an Entity Relationship (ER) diagram to visualize database structure. The project then details the creation of a database using MySQL, including the creation of tables, SQL queries, and the use of MySQL Workbench. Forms are created to enter sales and purchase orders, and the project delves into data analysis using pivot tables and charts on two datasets: employment rates and a public art collection. The analysis includes identifying key findings and insights from the datasets. The project concludes with a discussion of the database design, data analysis and the tools used, referencing relevant sources. The project also uses MS Access to create a relationship diagram and forms. The assignment covers the entire process from database design to data analysis and visualization.


1 out of 28
Related Documents


Your All-in-One AI-Powered Toolkit for Academic Success.
+13062052269
info@desklib.com
Available 24*7 on WhatsApp / Email
![[object Object]](/_next/static/media/star-bottom.7253800d.svg)
Copyright © 2020–2026 A2Z Services. All Rights Reserved. Developed and managed by ZUCOL.