BUS 207 Assignment 6: Analyzing Sales and Advertising Expenditure

Verified

Added on  2023/01/19

|2
|458
|88
Homework Assignment
AI Summary
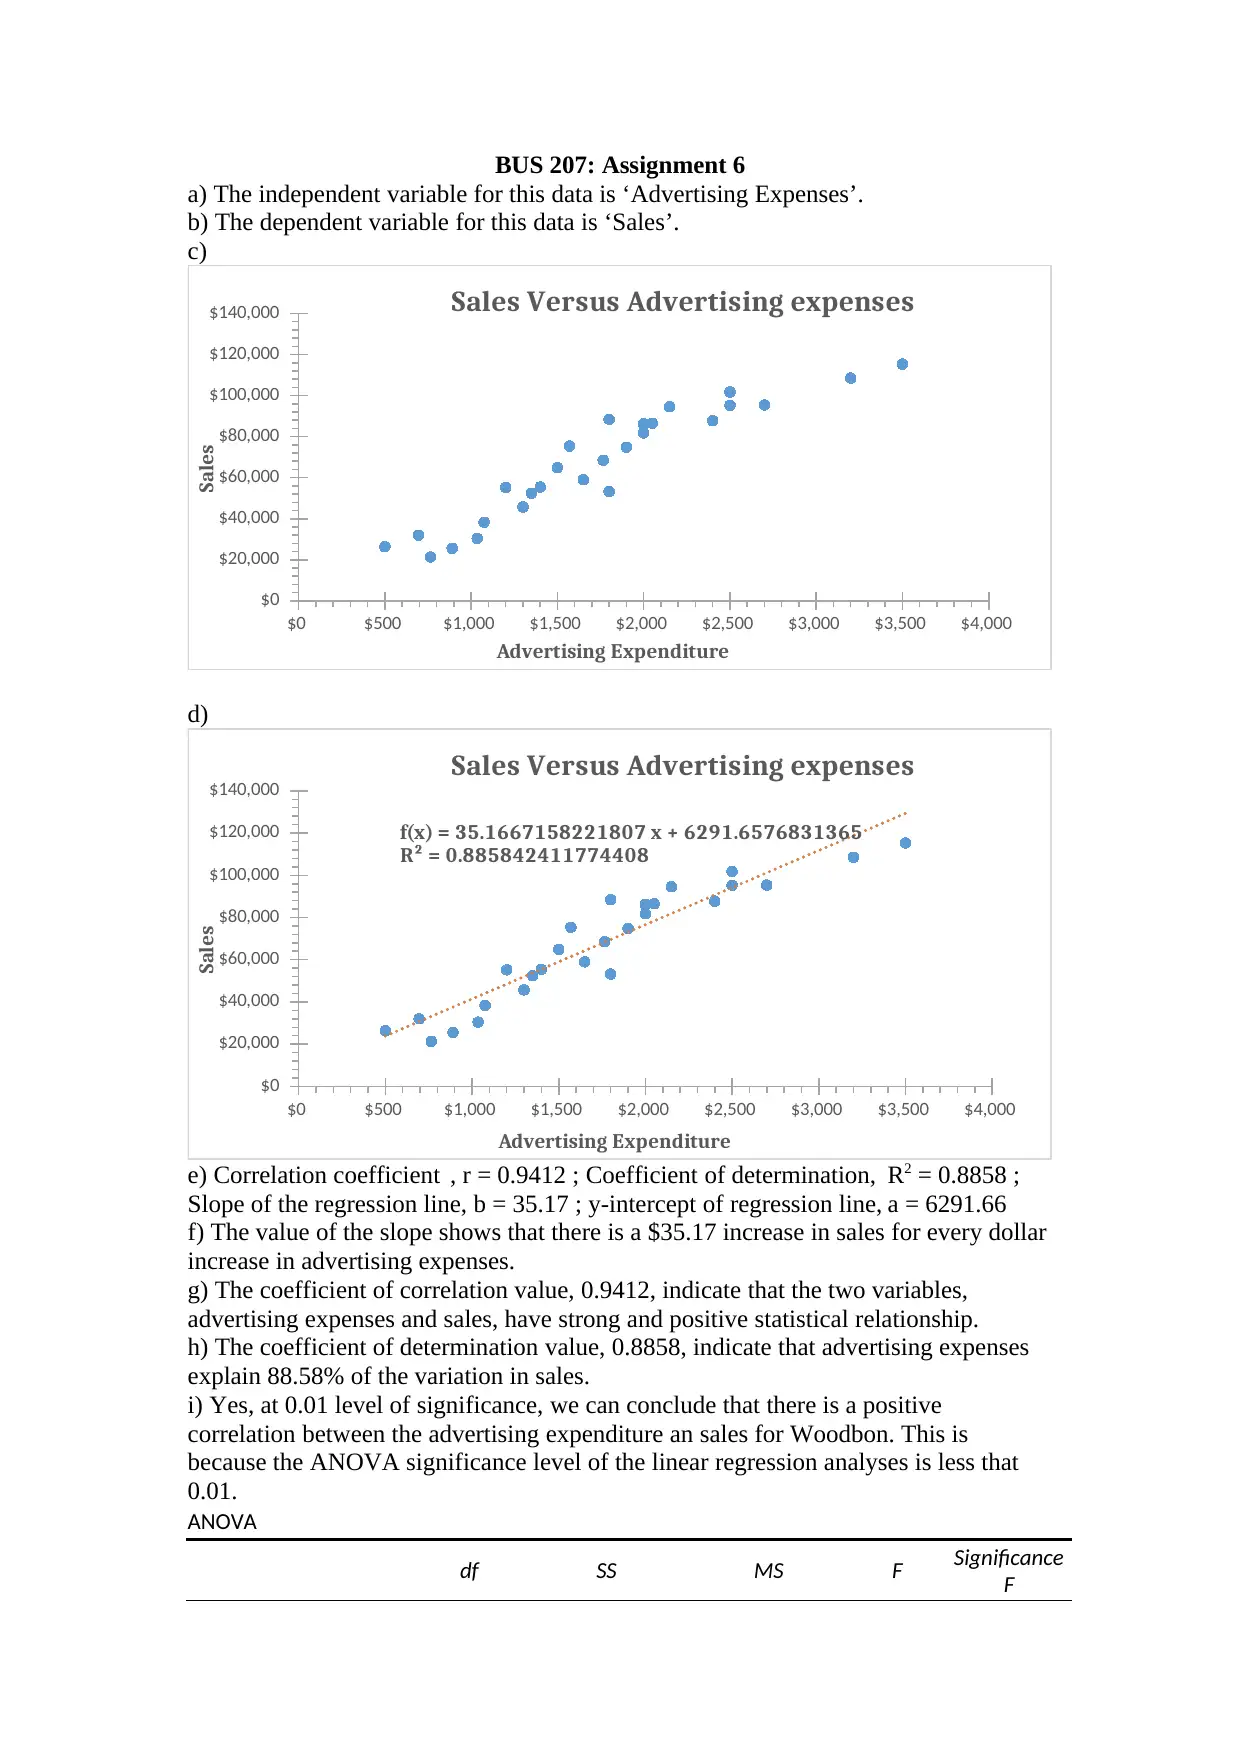
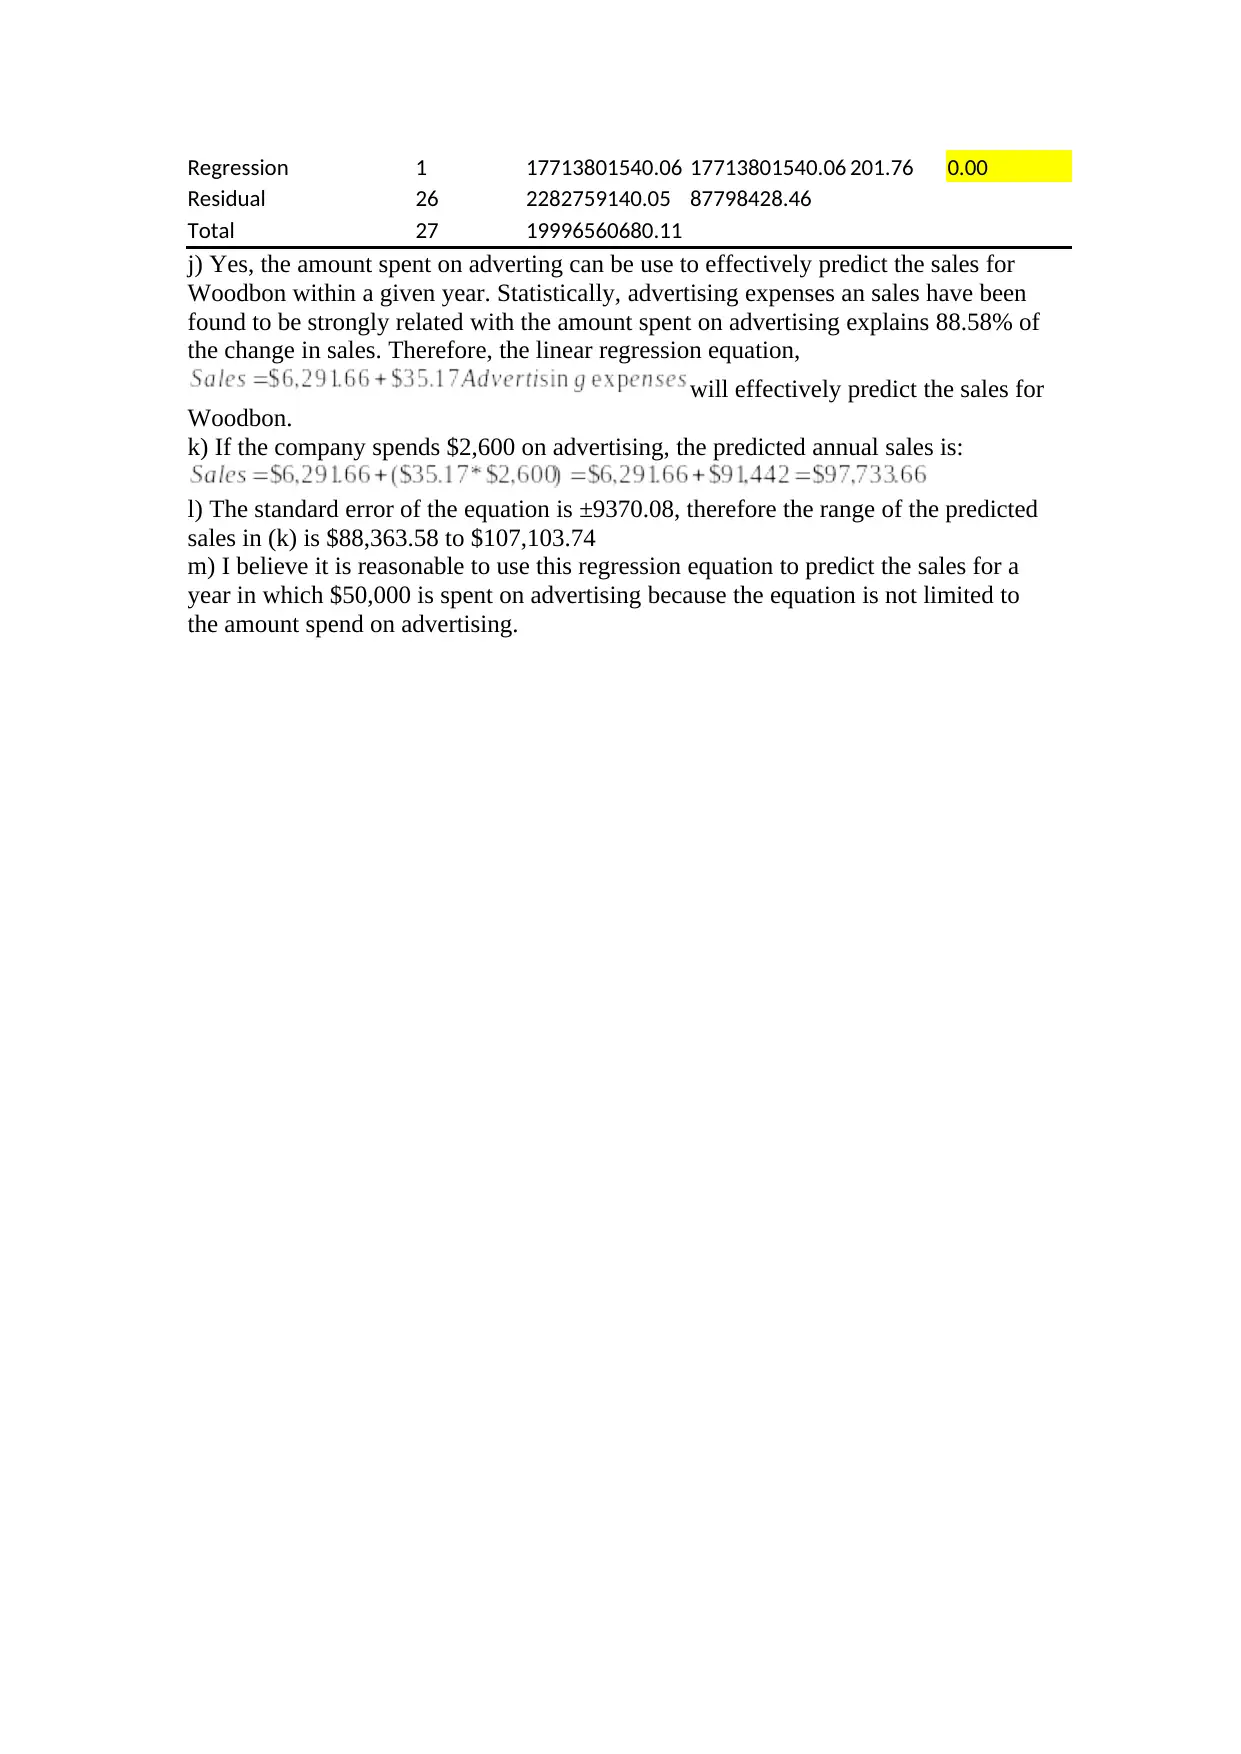
This assignment analyzes the relationship between advertising expenditure and sales for Woodbon, a wooden furniture company. The solution identifies advertising expenses as the independent variable and sales as the dependent variable. It presents a scatter plot illustrating the relationship between the two variables and includes a linear regression equation, correlation coefficient, and coefficient of determination. The analysis reveals a strong positive correlation between advertising expenses and sales, with advertising explaining a significant portion of the variation in sales. The solution also calculates the slope and y-intercept of the regression line, interprets their values, and uses the regression equation to predict sales based on advertising expenditure, including a range of predicted sales based on standard error. Furthermore, the solution uses ANOVA to confirm a positive correlation between advertising expenditure and sales, and concludes that advertising expenditure can be used to effectively predict sales within a given year.
Document Page
BUS 207: Assignment 6
a) The independent variable for this data is ‘Advertising Expenses’.
b) The dependent variable for this data is ‘Sales’.
c)
$0 $500 $1,000 $1,500 $2,000 $2,500 $3,000 $3,500 $4,000
$0
$20,000
$40,000
$60,000
$80,000
$100,000
$120,000
$140,000 Sales Versus Advertising expenses
Advertising Expenditure
Sales
d)
$0 $500 $1,000 $1,500 $2,000 $2,500 $3,000 $3,500 $4,000
$0
$20,000
$40,000
$60,000
$80,000
$100,000
$120,000
$140,000
f(x) = 35.1667158221807 x + 6291.6576831365
R² = 0.885842411774408
Sales Versus Advertising expenses
Advertising Expenditure
Sales
e) Correlation coefficient , r = 0.9412 ; Coefficient of determination, R2 = 0.8858 ;
Slope of the regression line, b = 35.17 ; y-intercept of regression line, a = 6291.66
f) The value of the slope shows that there is a $35.17 increase in sales for every dollar
increase in advertising expenses.
g) The coefficient of correlation value, 0.9412, indicate that the two variables,
advertising expenses and sales, have strong and positive statistical relationship.
h) The coefficient of determination value, 0.8858, indicate that advertising expenses
explain 88.58% of the variation in sales.
i) Yes, at 0.01 level of significance, we can conclude that there is a positive
correlation between the advertising expenditure an sales for Woodbon. This is
because the ANOVA significance level of the linear regression analyses is less that
0.01.
ANOVA
df SS MS F Significance
F
tabler-icon-diamond-filled.svg

Paraphrase This Document

Need a fresh take? Get an instant paraphrase of this document with our AI Paraphraser
Document Page
Regression 1 17713801540.06 17713801540.06 201.76 0.00
Residual 26 2282759140.05 87798428.46
Total 27 19996560680.11
j) Yes, the amount spent on adverting can be use to effectively predict the sales for
Woodbon within a given year. Statistically, advertising expenses an sales have been
found to be strongly related with the amount spent on advertising explains 88.58% of
the change in sales. Therefore, the linear regression equation,
will effectively predict the sales for
Woodbon.
k) If the company spends $2,600 on advertising, the predicted annual sales is:
l) The standard error of the equation is ±9370.08, therefore the range of the predicted
sales in (k) is $88,363.58 to $107,103.74
m) I believe it is reasonable to use this regression equation to predict the sales for a
year in which $50,000 is spent on advertising because the equation is not limited to
the amount spend on advertising.
chevron_up_icon
1 out of 2
circle_padding
hide_on_mobile
zoom_out_icon
[object Object]