Financial Analysis: Sales, Production Budgets, and Costing Methods

Verified

Added on  2019/09/13

|5
|940
|54
Homework Assignment
AI Summary
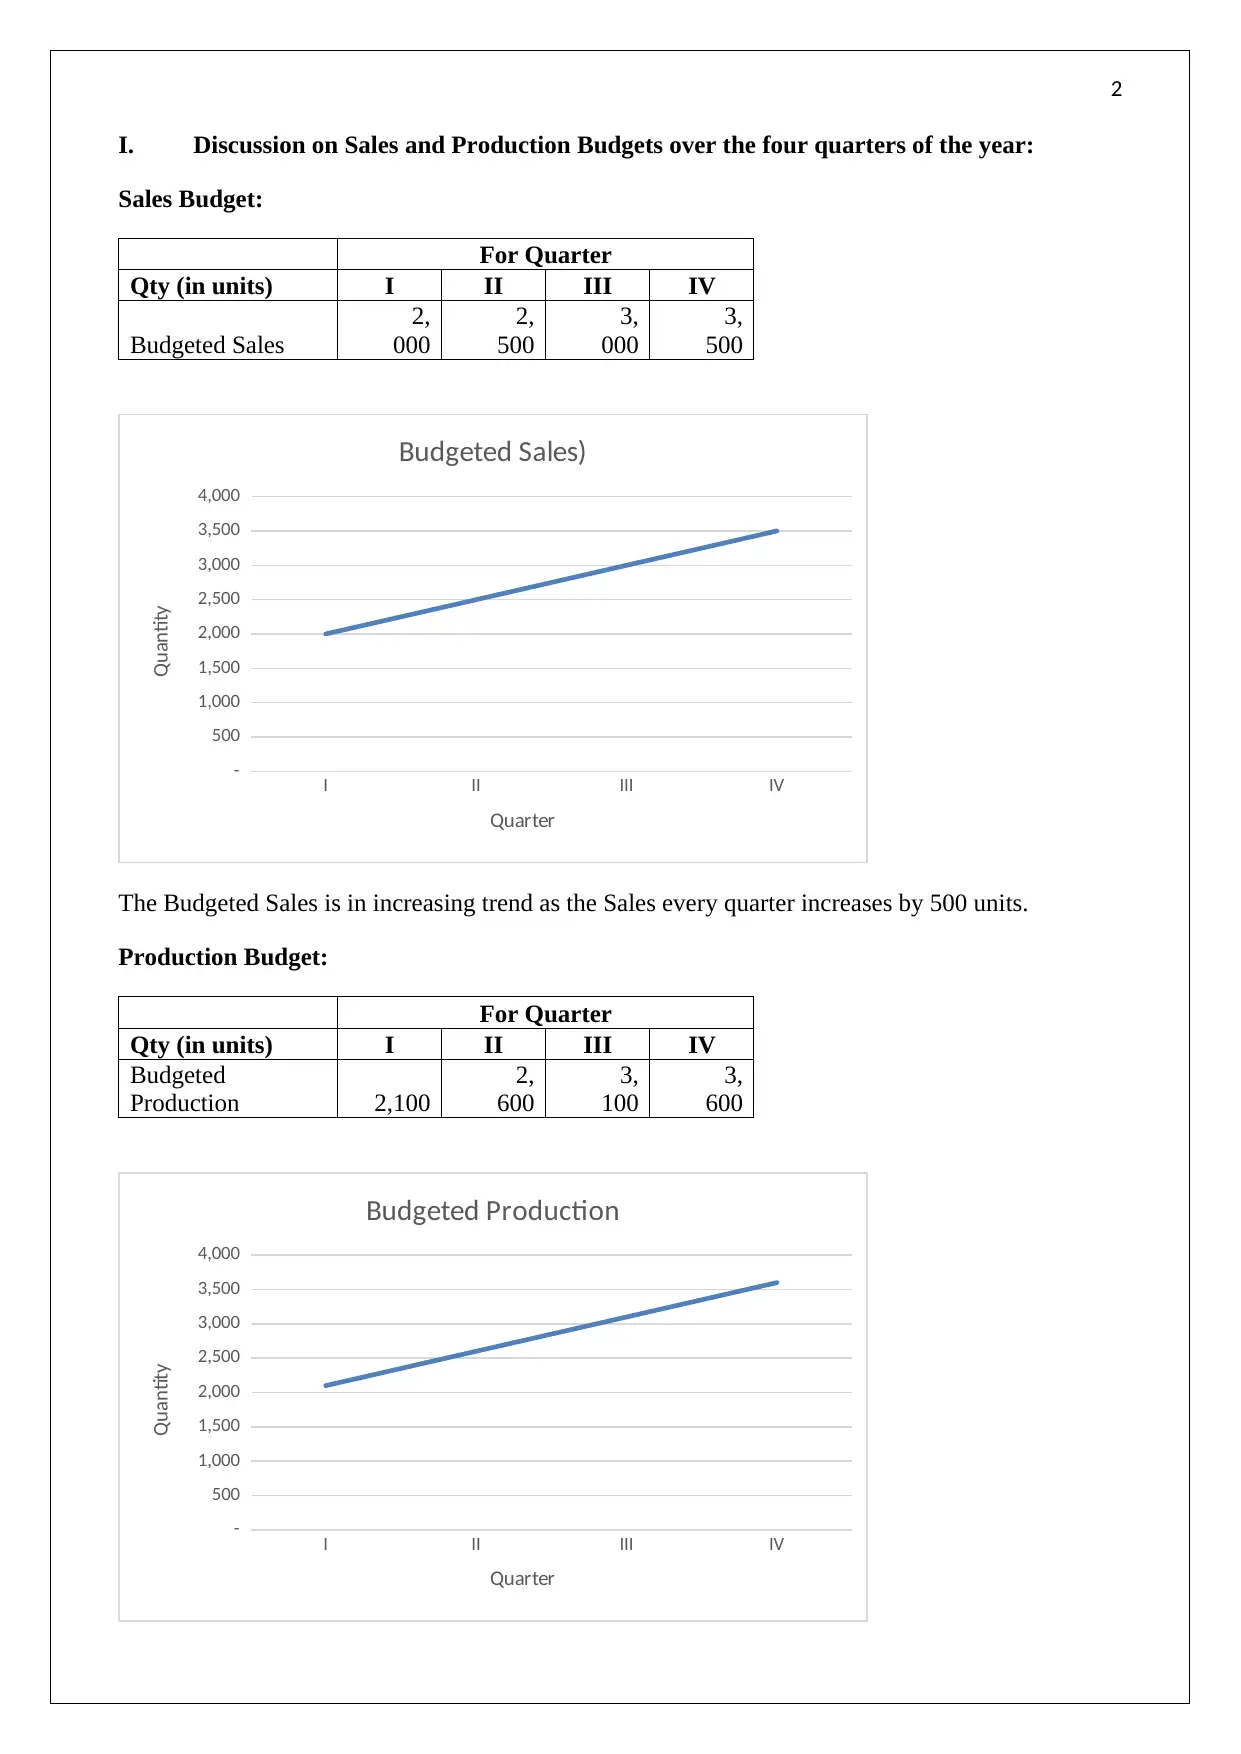
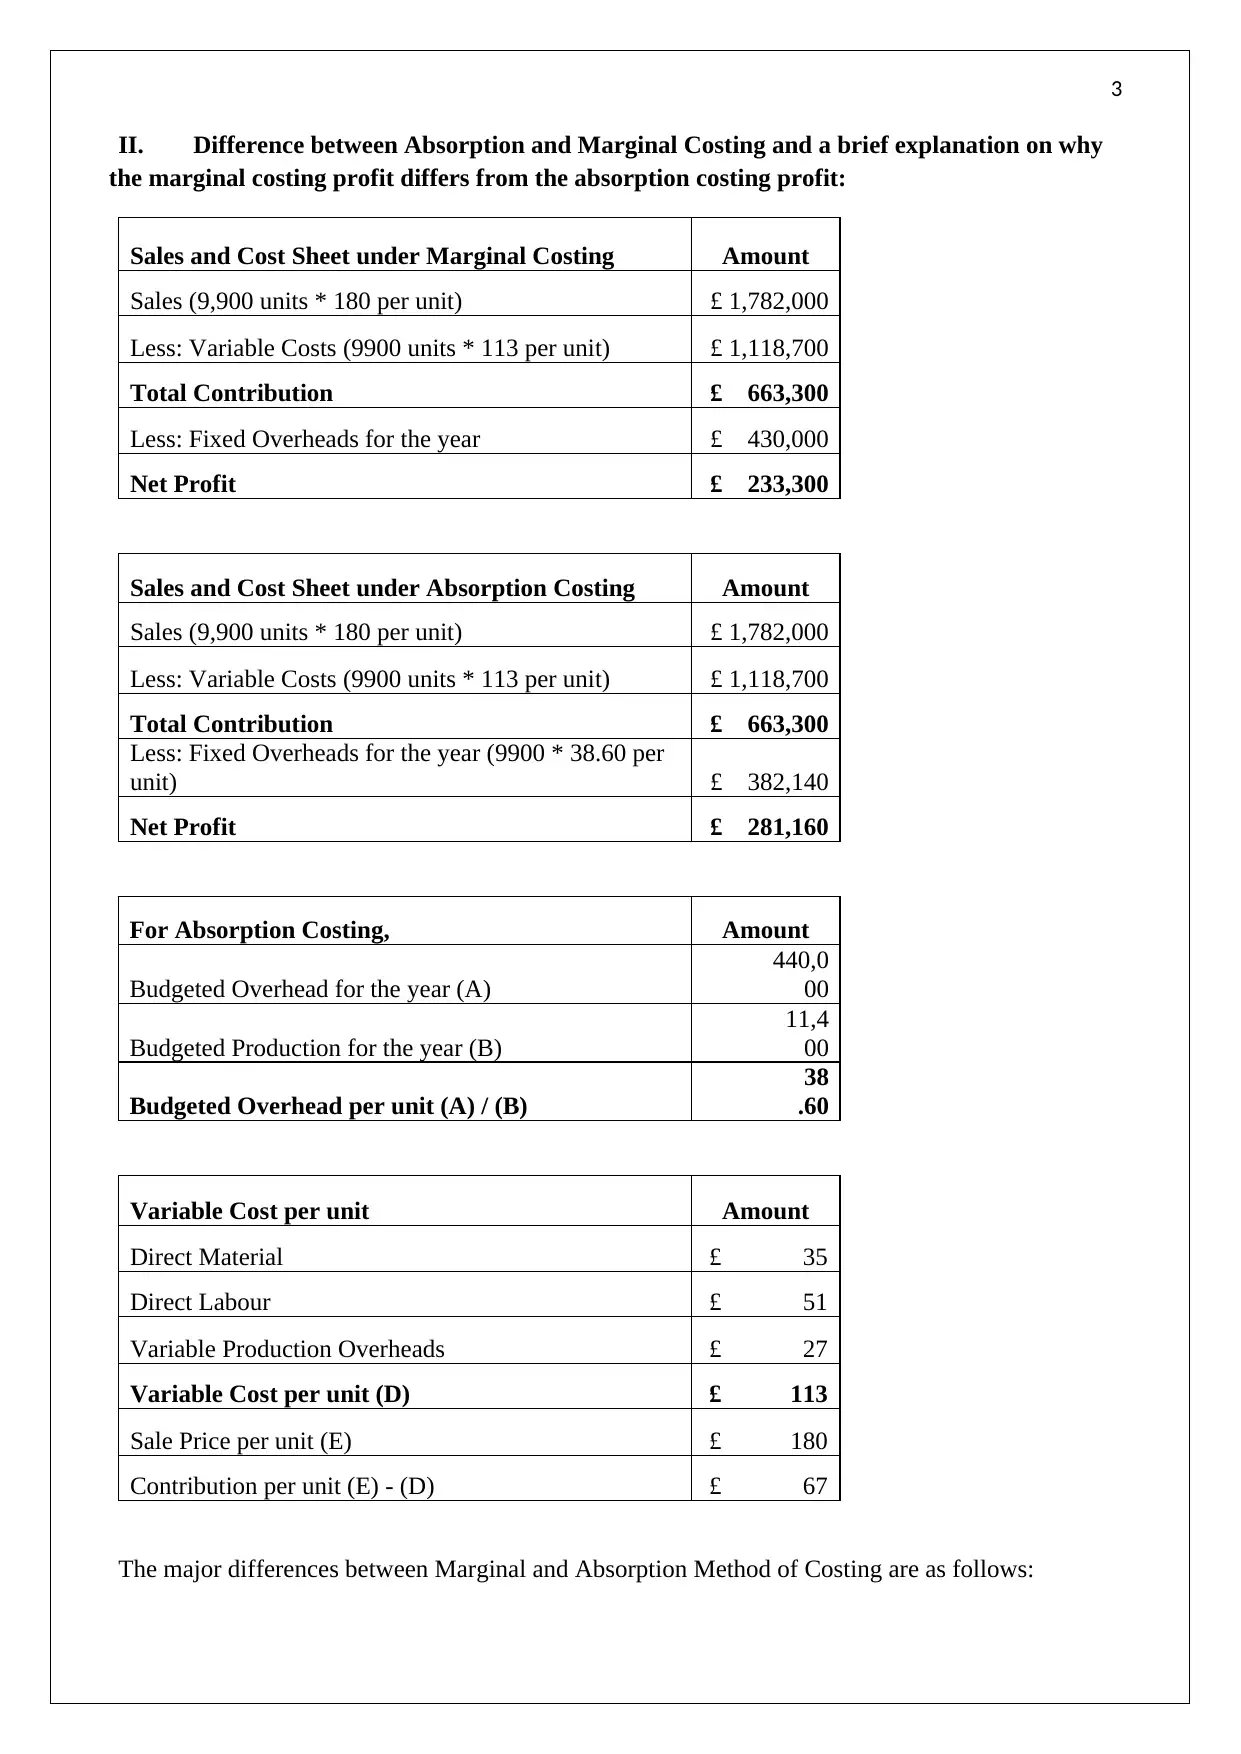
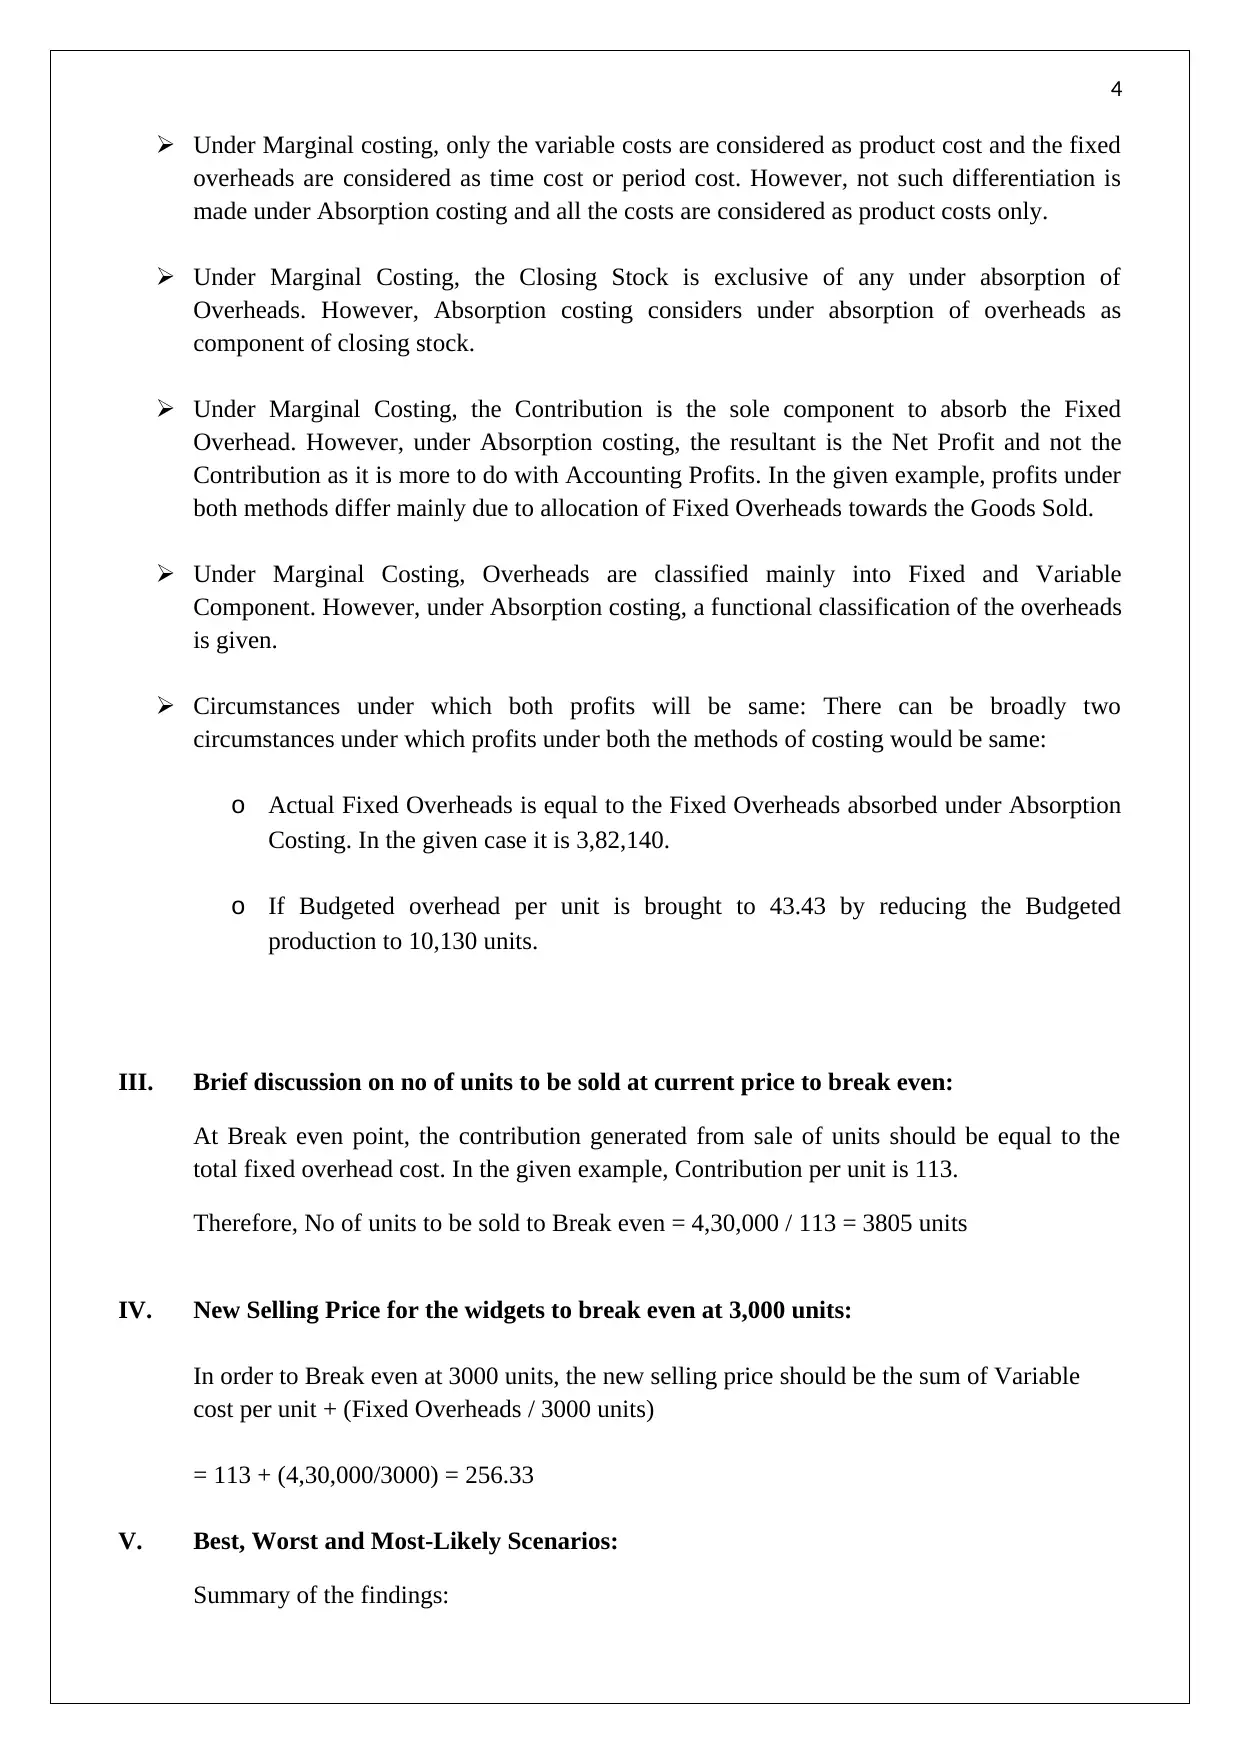
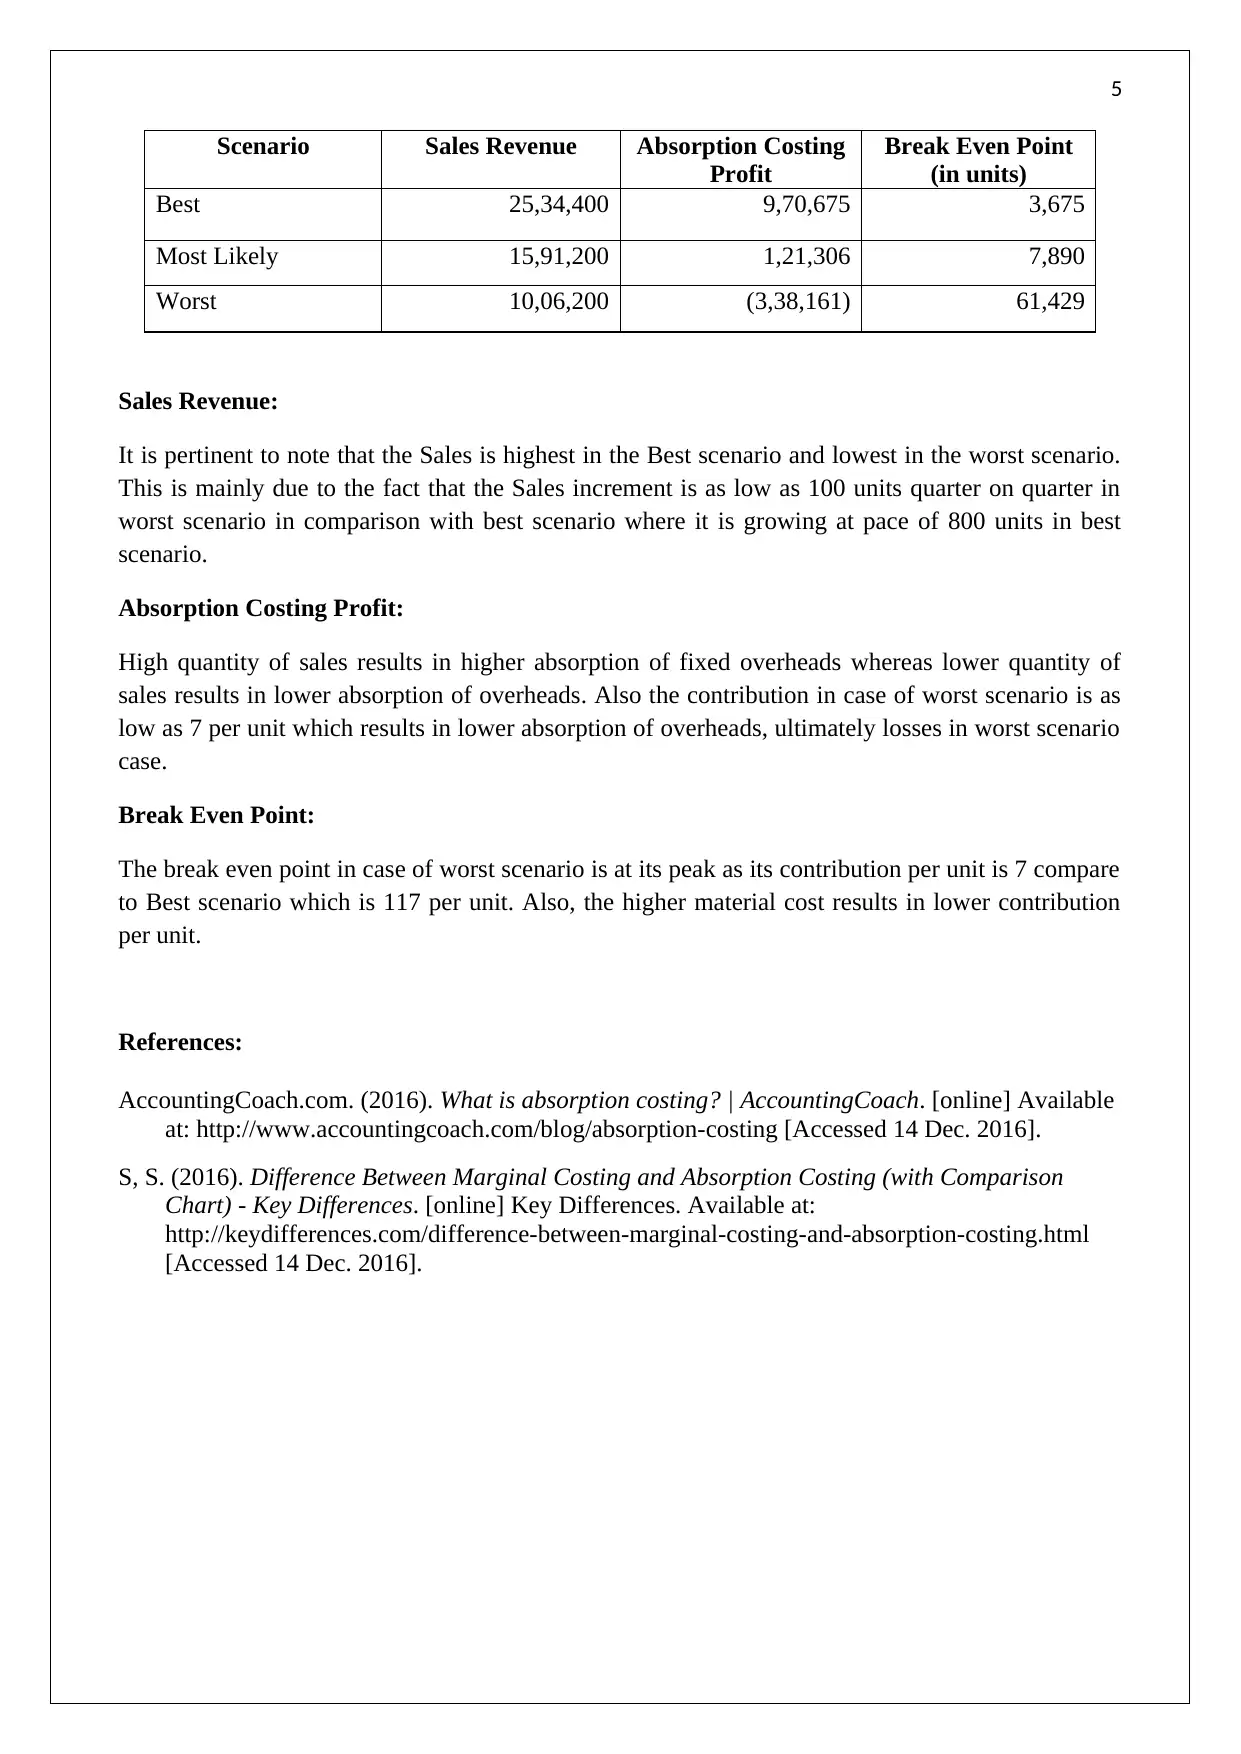
This assignment provides a comprehensive analysis of sales and production budgets across four quarters, detailing budgeted sales and production quantities. It explores the differences between absorption and marginal costing methods, highlighting how they impact profit calculations due to the treatment of fixed overheads. The solution includes detailed sales and cost sheets under both costing methods, explaining the classification of costs and the impact on net profit. Furthermore, it identifies circumstances under which both methods would yield the same profit. The assignment also calculates the break-even point and determines the new selling price required to break even at a different sales volume. Finally, it presents best, worst, and most-likely scenarios, analyzing sales revenue, absorption costing profit, and break-even points under each scenario, with references to relevant accounting resources.
Document Page
1
SOLUTION
tabler-icon-diamond-filled.svg

Secure Best Marks with AI Grader

Need help grading? Try our AI Grader for instant feedback on your assignments.
Document Page
2
I. Discussion on Sales and Production Budgets over the four quarters of the year:
Sales Budget:
For Quarter
Qty (in units) I II III IV
Budgeted Sales
2,
000
2,
500
3,
000
3,
500
I II III IV
-
500
1,000
1,500
2,000
2,500
3,000
3,500
4,000
Budgeted Sales)
Quarter
Quantity
The Budgeted Sales is in increasing trend as the Sales every quarter increases by 500 units.
Production Budget:
For Quarter
Qty (in units) I II III IV
Budgeted
Production 2,100
2,
600
3,
100
3,
600
I II III IV
-
500
1,000
1,500
2,000
2,500
3,000
3,500
4,000
Budgeted Production
Quarter
Quantity
Document Page
3
II. Difference between Absorption and Marginal Costing and a brief explanation on why
the marginal costing profit differs from the absorption costing profit:
Sales and Cost Sheet under Marginal Costing Amount
Sales (9,900 units * 180 per unit) £ 1,782,000
Less: Variable Costs (9900 units * 113 per unit) £ 1,118,700
Total Contribution £ 663,300
Less: Fixed Overheads for the year £ 430,000
Net Profit £ 233,300
Sales and Cost Sheet under Absorption Costing Amount
Sales (9,900 units * 180 per unit) £ 1,782,000
Less: Variable Costs (9900 units * 113 per unit) £ 1,118,700
Total Contribution £ 663,300
Less: Fixed Overheads for the year (9900 * 38.60 per
unit) £ 382,140
Net Profit £ 281,160
For Absorption Costing, Amount
Budgeted Overhead for the year (A)
440,0
00
Budgeted Production for the year (B)
11,4
00
Budgeted Overhead per unit (A) / (B)
38
.60
Variable Cost per unit Amount
Direct Material £ 35
Direct Labour £ 51
Variable Production Overheads £ 27
Variable Cost per unit (D) £ 113
Sale Price per unit (E) £ 180
Contribution per unit (E) - (D) £ 67
The major differences between Marginal and Absorption Method of Costing are as follows:
Document Page
4
Under Marginal costing, only the variable costs are considered as product cost and the fixed
overheads are considered as time cost or period cost. However, not such differentiation is
made under Absorption costing and all the costs are considered as product costs only.
Under Marginal Costing, the Closing Stock is exclusive of any under absorption of
Overheads. However, Absorption costing considers under absorption of overheads as
component of closing stock.
Under Marginal Costing, the Contribution is the sole component to absorb the Fixed
Overhead. However, under Absorption costing, the resultant is the Net Profit and not the
Contribution as it is more to do with Accounting Profits. In the given example, profits under
both methods differ mainly due to allocation of Fixed Overheads towards the Goods Sold.
Under Marginal Costing, Overheads are classified mainly into Fixed and Variable
Component. However, under Absorption costing, a functional classification of the overheads
is given.
Circumstances under which both profits will be same: There can be broadly two
circumstances under which profits under both the methods of costing would be same:
o Actual Fixed Overheads is equal to the Fixed Overheads absorbed under Absorption
Costing. In the given case it is 3,82,140.
o If Budgeted overhead per unit is brought to 43.43 by reducing the Budgeted
production to 10,130 units.
III. Brief discussion on no of units to be sold at current price to break even:
At Break even point, the contribution generated from sale of units should be equal to the
total fixed overhead cost. In the given example, Contribution per unit is 113.
Therefore, No of units to be sold to Break even = 4,30,000 / 113 = 3805 units
IV. New Selling Price for the widgets to break even at 3,000 units:
In order to Break even at 3000 units, the new selling price should be the sum of Variable
cost per unit + (Fixed Overheads / 3000 units)
= 113 + (4,30,000/3000) = 256.33
V. Best, Worst and Most-Likely Scenarios:
Summary of the findings:
tabler-icon-diamond-filled.svg

Secure Best Marks with AI Grader

Need help grading? Try our AI Grader for instant feedback on your assignments.
Document Page
5
Scenario Sales Revenue Absorption Costing
Profit
Break Even Point
(in units)
Best 25,34,400 9,70,675 3,675
Most Likely 15,91,200 1,21,306 7,890
Worst 10,06,200 (3,38,161) 61,429
Sales Revenue:
It is pertinent to note that the Sales is highest in the Best scenario and lowest in the worst scenario.
This is mainly due to the fact that the Sales increment is as low as 100 units quarter on quarter in
worst scenario in comparison with best scenario where it is growing at pace of 800 units in best
scenario.
Absorption Costing Profit:
High quantity of sales results in higher absorption of fixed overheads whereas lower quantity of
sales results in lower absorption of overheads. Also the contribution in case of worst scenario is as
low as 7 per unit which results in lower absorption of overheads, ultimately losses in worst scenario
case.
Break Even Point:
The break even point in case of worst scenario is at its peak as its contribution per unit is 7 compare
to Best scenario which is 117 per unit. Also, the higher material cost results in lower contribution
per unit.
References:
AccountingCoach.com. (2016). What is absorption costing? | AccountingCoach. [online] Available
at: http://www.accountingcoach.com/blog/absorption-costing [Accessed 14 Dec. 2016].
S, S. (2016). Difference Between Marginal Costing and Absorption Costing (with Comparison
Chart) - Key Differences. [online] Key Differences. Available at:
http://keydifferences.com/difference-between-marginal-costing-and-absorption-costing.html
[Accessed 14 Dec. 2016].
chevron_up_icon
1 out of 5
circle_padding
hide_on_mobile
zoom_out_icon
logo.png

Your All-in-One AI-Powered Toolkit for Academic Success.

Available 24*7 on WhatsApp / Email

[object Object]