Comprehensive Business Report: Sales, Profit Analysis and Forecasting

Verified

Added on  2023/02/10

|1
|433
|63
Report
AI Summary
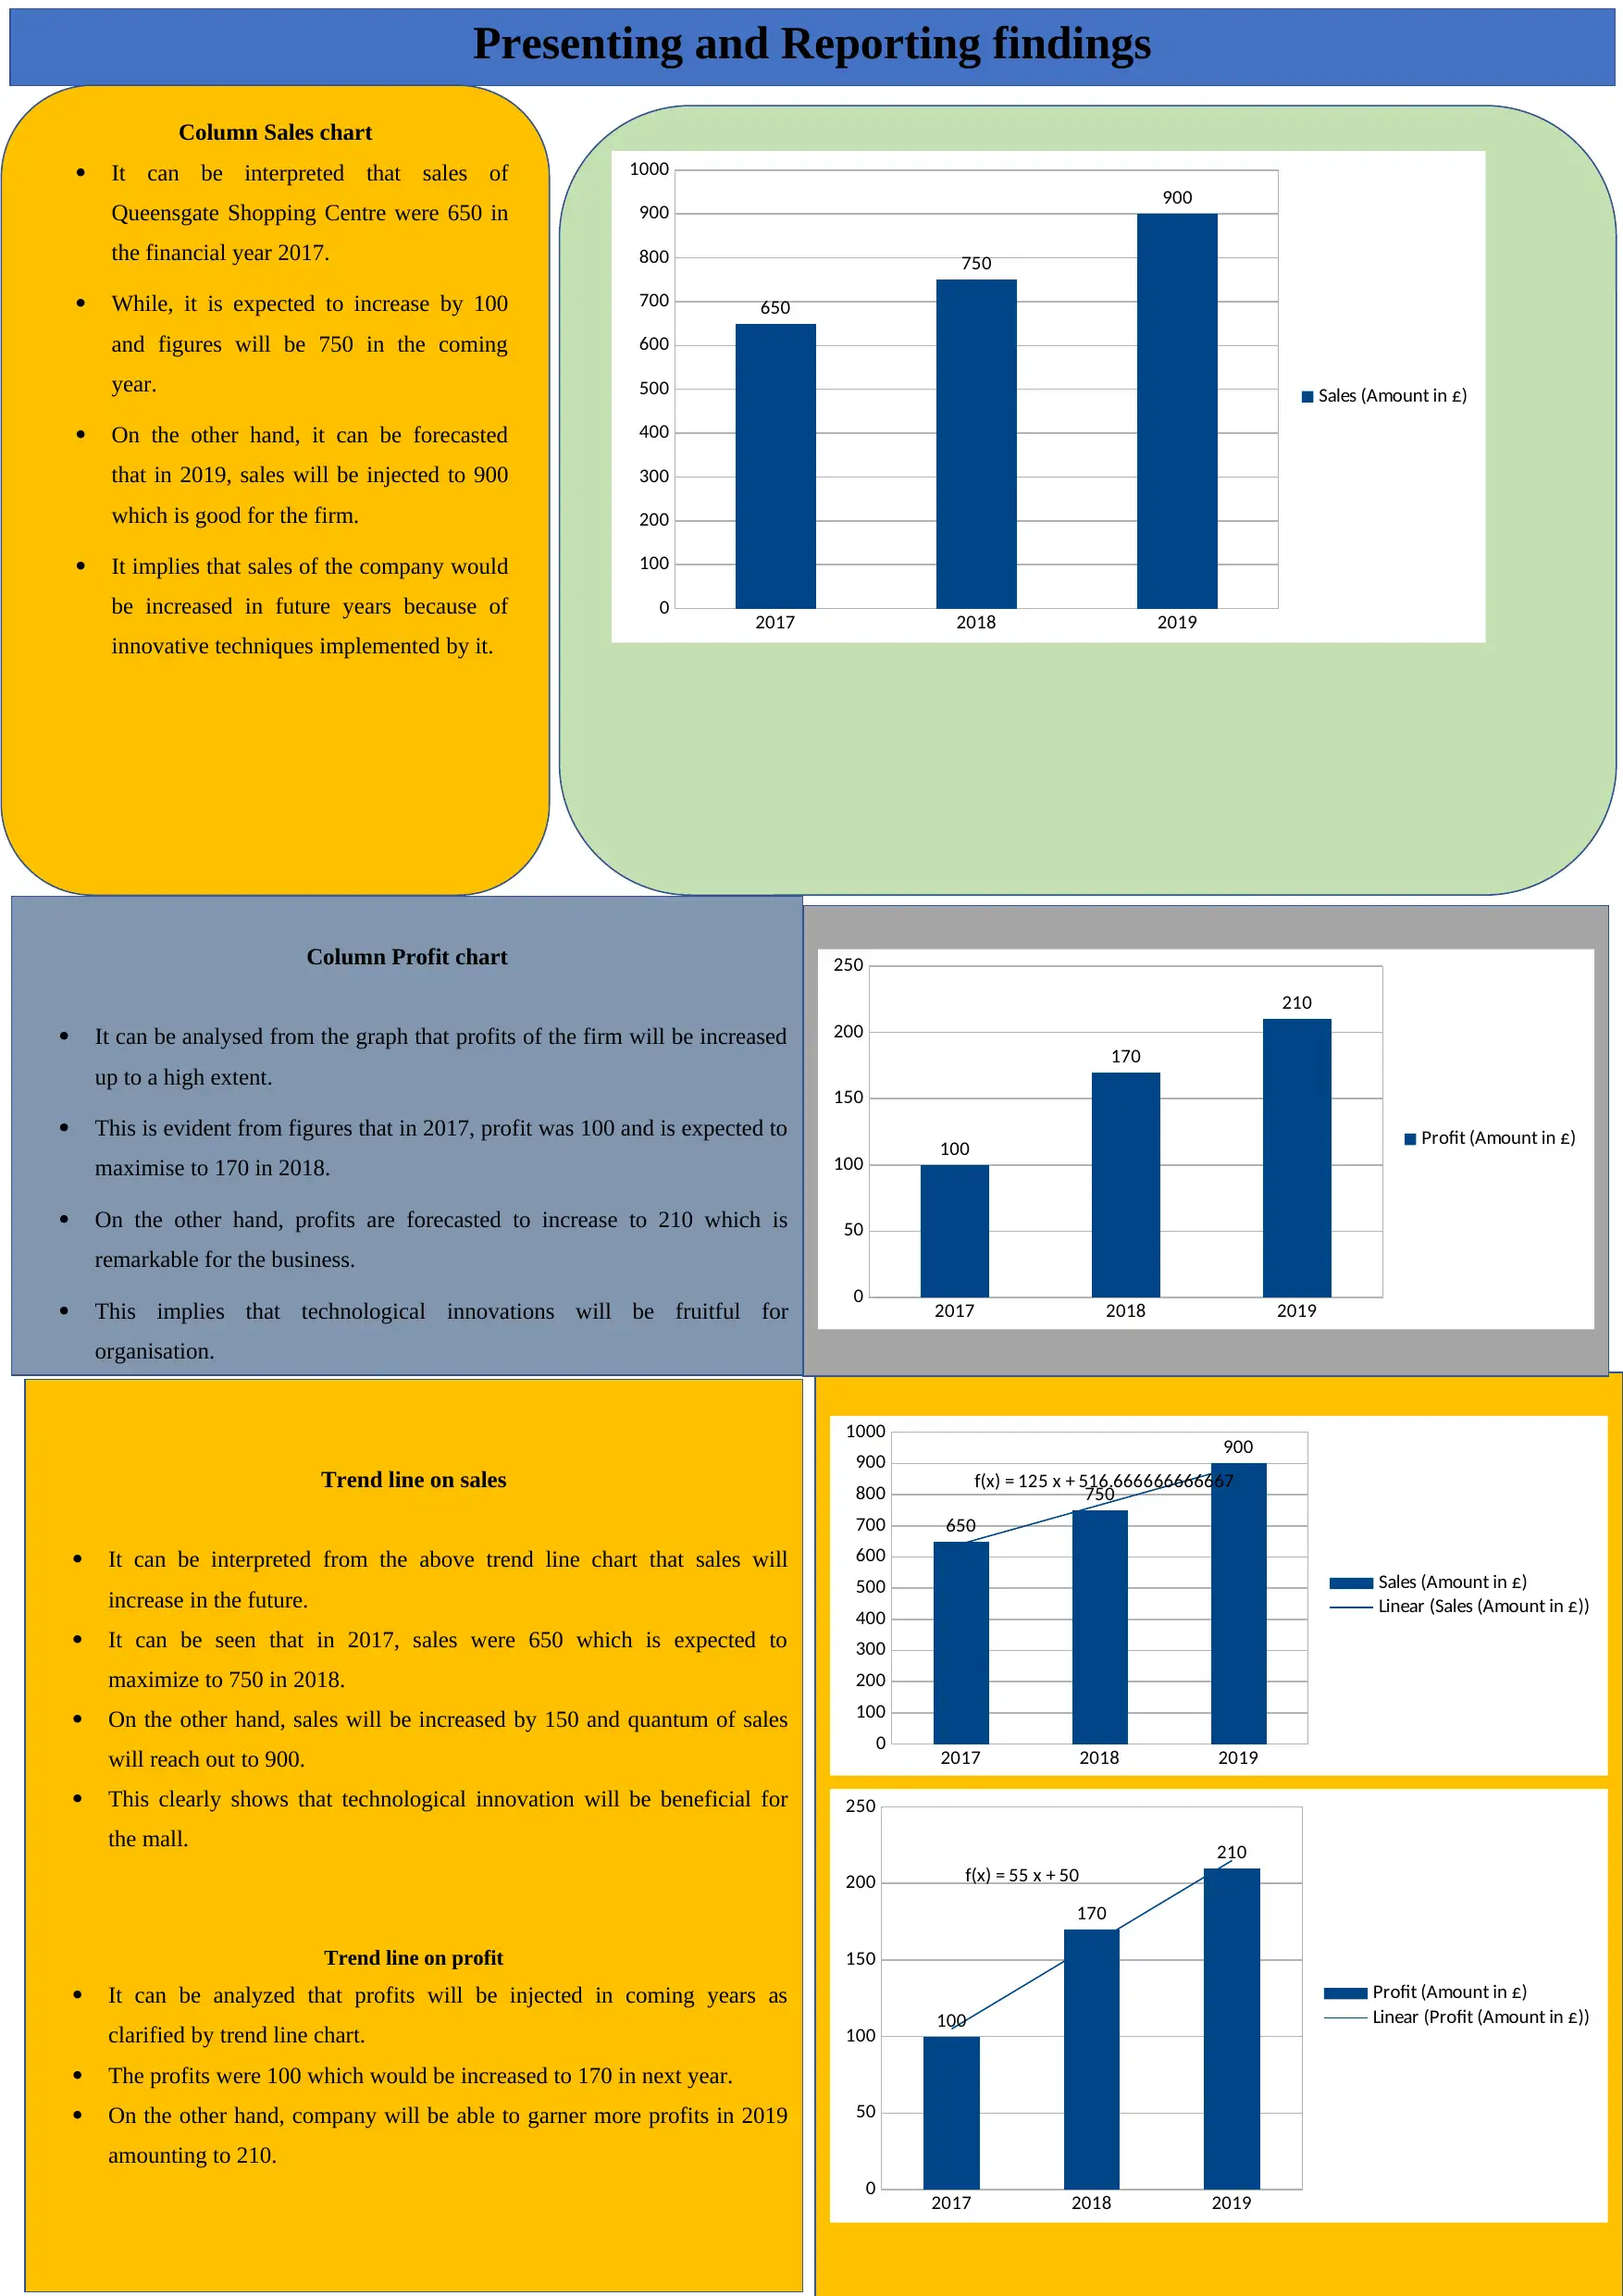
This report presents an analysis of sales and profit trends for the years 2017 to 2019. The analysis includes the use of column charts and trend lines to visualize the data. Sales figures for the Queensgate Shopping Centre are examined, showing an increase from 650 in 2017 to a projected 750 in 2018 and 900 in 2019. The profit analysis indicates a similar positive trend, with profits rising from 100 in 2017 to 170 in 2018 and 210 in 2019. The report suggests that technological innovations implemented by the firm are contributing to this positive financial performance. Trend line charts further support these findings, forecasting continued growth in both sales and profits. The report provides a clear overview of the company's financial trajectory, highlighting the positive impact of strategic initiatives.
Document Page
Presenting and Reporting findings
Trend line on sales
It can be interpreted from the above trend line chart that sales will
increase in the future.
It can be seen that in 2017, sales were 650 which is expected to
maximize to 750 in 2018.
On the other hand, sales will be increased by 150 and quantum of sales
will reach out to 900.
This clearly shows that technological innovation will be beneficial for
the mall.
Trend line on profit
It can be analyzed that profits will be injected in coming years as
clarified by trend line chart.
The profits were 100 which would be increased to 170 in next year.
On the other hand, company will be able to garner more profits in 2019
amounting to 210.
2017 2018 2019
0
100
200
300
400
500
600
700
800
900
1000
650
750
900
f(x) = 125 x + 516.666666666667
Sales (Amount in £)
Linear (Sales (Amount in £))
2017 2018 2019
0
50
100
150
200
250
100
170
210
f(x) = 55 x + 50
Profit (Amount in £)
Linear (Profit (Amount in £))
Column Sales chart
It can be interpreted that sales of
Queensgate Shopping Centre were 650 in
the financial year 2017.
While, it is expected to increase by 100
and figures will be 750 in the coming
year.
On the other hand, it can be forecasted
that in 2019, sales will be injected to 900
which is good for the firm.
It implies that sales of the company would
be increased in future years because of
innovative techniques implemented by it.
2017 2018 2019
0
100
200
300
400
500
600
700
800
900
1000
650
750
900
Sales (Amount in £)
Column Profit chart
It can be analysed from the graph that profits of the firm will be increased
up to a high extent.
This is evident from figures that in 2017, profit was 100 and is expected to
maximise to 170 in 2018.
On the other hand, profits are forecasted to increase to 210 which is
remarkable for the business.
This implies that technological innovations will be fruitful for
organisation.
2017 2018 2019
0
50
100
150
200
250
100
170
210
Profit (Amount in £)
tabler-icon-diamond-filled.svg

Secure Best Marks with AI Grader

Need help grading? Try our AI Grader for instant feedback on your assignments.
chevron_up_icon
1 out of 1
circle_padding
hide_on_mobile
zoom_out_icon
[object Object]