Analyzing Sales and Shipping Costs with Statistical Tests

Verified

Added on  2020/05/11

|20
|2460
|92
AI Summary
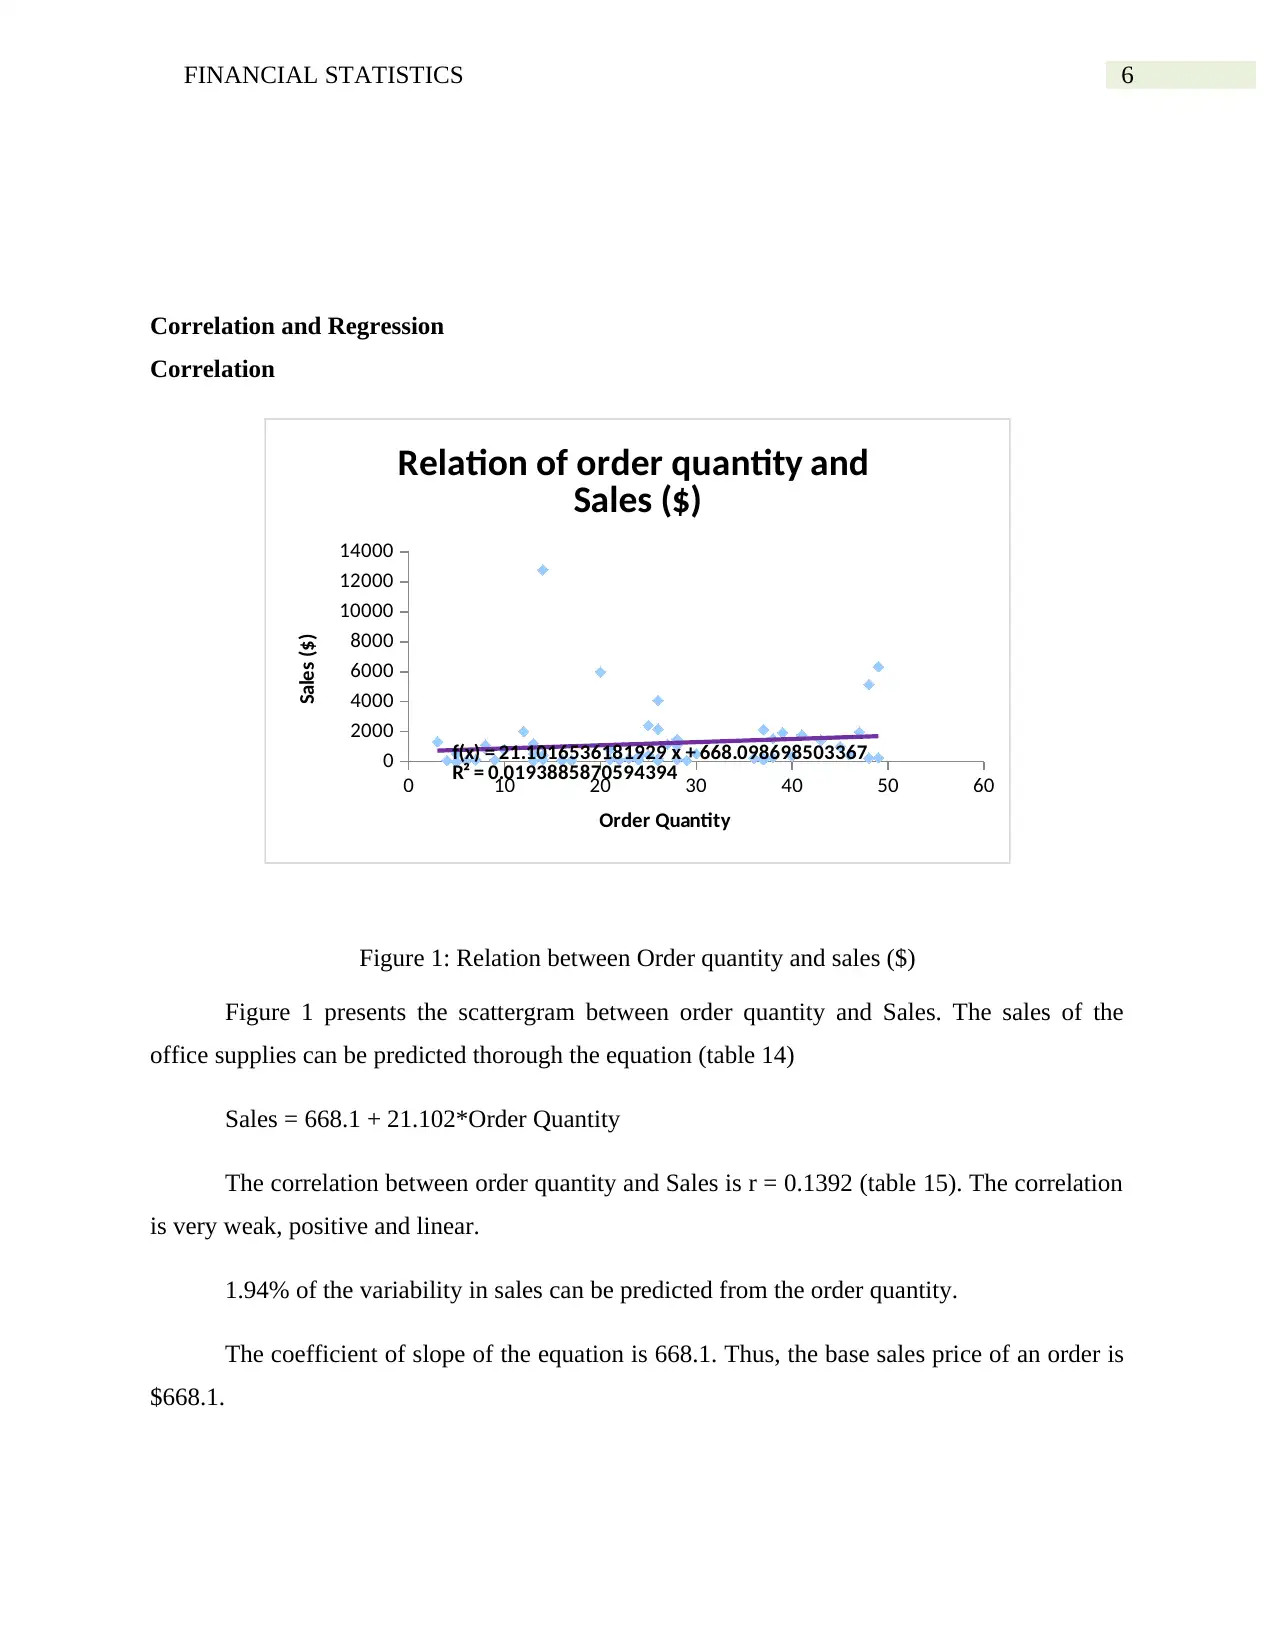
The task requires a comprehensive analysis of data pertaining to sales and shipping costs. Initially, the study involves comparing average sales between Eastern and Western regions using an independent sample t-test. The calculated mean sales for the Eastern region are $1367.34 with a variance of 5525224.97 over 39 observations, while the Western region has a mean of $838.59 and a variance of 1781768.08 from 21 observations. The resulting t-statistic is 0.9493 with a two-tailed p-value of 0.3464, indicating no significant difference between the regions' average sales at typical significance levels. Additionally, an independent sample t-test evaluates shipping costs for critical versus low-priority orders. Critical orders have a mean cost of $5.13 and low priority has $6.93 with respective variances leading to a t-statistic of -0.9957 and a two-tailed p-value of 0.3342, suggesting no significant difference in shipping costs based on order priority. The study further explores confidence intervals for sales among Home Office customers and the general population, providing estimated ranges where true means likely reside. Lastly, regression analysis is conducted to assess the relationship between order quantity and cost, yielding a weak correlation (R Square = 0.0194) with an intercept of $668.10 and a slope of $21.10 for order quantity. The low R Square value indicates that other factors not included in this model likely explain most of the variability in shipping costs.
Document Page
Running head: FINANCIAL STATISTICS
Financial Statistics
Name of the student
Name of the university
Author’s note
tabler-icon-diamond-filled.svg

Paraphrase This Document

Need a fresh take? Get an instant paraphrase of this document with our AI Paraphraser
Document Page
1FINANCIAL STATISTICS
Executive Statistics
In the present assignment, we present an investigation into the office supply sales data of
Hardware and Garden Supplies. A random sample of 60 supply orders was selected for the
analysis. The analysis shows that most of the orders of Hardware and garden supplies are from
corporate customers. The maximum priority of the order is high and most of the orders are
shipped within 2 days of the order being taken. Most of the customers of the organization are
from the Eastern Region.
Moreover, there is no difference in the shipping costs of the orders having critical and
low priority. In addition, there is also no significant difference in the sales from the eastern and
western region. Further, from the analysis of the data it was found that it is difficult to
approximate the sales from the order quantity of an order.
Document Page
2FINANCIAL STATISTICS
Table of Contents
Introduction......................................................................................................................................3
Analysis...........................................................................................................................................3
Descriptive Statistics....................................................................................................................3
Order ID...................................................................................................................................3
Order Priority...........................................................................................................................3
Order Quantity..........................................................................................................................3
Sales..........................................................................................................................................3
Ship Mode................................................................................................................................4
Shipping Cost...........................................................................................................................4
Region......................................................................................................................................4
Customer Segment...................................................................................................................4
Days to ship..............................................................................................................................4
Confidence Interval......................................................................................................................4
Hypothesis Testing.......................................................................................................................5
Correlation and Regression..........................................................................................................6
Conclusion and Limitations.............................................................................................................7
Appendices......................................................................................................................................9
Descriptive Statistics....................................................................................................................9
Confidence Interval....................................................................................................................15
Hypothesis Testing.....................................................................................................................17
Correlation and Regression........................................................................................................18
Document Page
3FINANCIAL STATISTICS
Introduction
In the present assignment, we analysed data on office supplies. Hardware and Garden
Supplies have provided the data. The data contains information on 2002 orders of office supplies.
Through random selection process, 60 supply orders were selected and analysed. The
organization provided information on nine variables of interest. The organization has also
provided information on the order id which is an identity variable. The data of office supplies
contains information on order quantity, sales ($) and shipping costs. The analysis of the data
provides information on the average sales for the home office as well as all the selected
customers. We also compare the average sales of all the 2002 customers. Further comparison of
the average sales from the eastern and western states is also compared. Finally, an investigation
is also made on the relation between order quantity and average sales.
Analysis
Descriptive Statistics
Order ID
The variable represents a value through which the order can be tracked.
Order Priority
The variable order priority defines the priority of the order. The analysis of the order
priority shows that the organization hardware and garden supplies have grouped all the office
supply orders into five order priorities (table 1). The analysis of the sample data shows that the
highest number has a low priority and the lowest number of orders have a low priority. The order
priority of very number of orders does not have any specific order priority (figure 2).
Order Quantity
The average number of items in an order is 24.37 (table 2). The number of items for more
than 50% of the orders is 24. The minimum and maximum number of items in an order is 3 and
49 respectively. For more than 50% of the orders the range of the number of items is 24. The
variation in number of items per order for the sample is 56%.
Sales
The average sales volume for an order is $1182.28 (table 2). The sales figures for 50% of
the orders is below $444.38. The minimum and maximum sales for the orders are $14.76 and
tabler-icon-diamond-filled.svg

Paraphrase This Document

Need a fresh take? Get an instant paraphrase of this document with our AI Paraphraser
Document Page
4FINANCIAL STATISTICS
$12805.25 respectively. For more than 50% of the orders the sales are is $1223.42. The variation
in sales for the order is 174%.
The maximum number of orders has sales below $1850 (figure 4). As the sales increases
the order quantity decreases.
Ship Mode
The variable Shipping Mode defines the mode of delivery of an order. The organization
has three modes of delivery – Regular Air, Delivery truck and Express Air (table 4). Most of the
orders are delivered through regular air (figure 5). Delivery Truck is the least preferred mode of
transport.
Shipping Cost
The average shipping costs for an order is $7.93 (table 2). The shipping costs for 50% of
the orders are below $8.83. The minimum and maximum shipping costs are $0.5 and $42.52
respectively. The shipping costs for 25% of the orders lies below $3.32. The shipping costs for
75% of the orders lie below $8.99. The variation in shipping costs is 89%.
The maximum number of orders has a shipping cost below $7 (figure 6). As the shipping
cost increases the order, quantity decreases.
Region
Hardware and Garden supplies have divided their office supplies on the basis of the
region of the orders (table 5). Most of the orders are from the eastern region. Some of the orders
are from the western region also (figure 7).
Customer Segment
The variable Customer segment defines the type of customer. The analysis of customer
segment shows that the organization hardware and garden supplies have grouped all customers
into four groups (table 6). The analysis of the sample data shows that corporate customers have
given the highest number of orders. Consumers (figure 8) gave the lowest number of orders.
Days to ship
The variable Days to Ship define the number of days to ship a order from the day the
order was placed. The organization ships all orders within seven days of the order being placed
(table 7). The maximum number of orders is shipped within 1 day. Most of the orders are
shipped within 2 days of ordering (figure 9).
Confidence Interval
Confidence Interval 1
We are 95% confident that the average sales for home office customers lies between
$181.25 and $1662.49. The mean sales of home office is $921.87. The 95% confidence interval
Document Page
5FINANCIAL STATISTICS
would mean that if we take a second random sample of 60 orders then the average sales of home
office customers would lie within $181.25 and $1662.49 (table 8).
The mean sales of all of 2002 customers are $1716.69 (table 9).
Confidence Interval 2
We are 95% confident that the average shipping costs lies within $6.15 and $9.71. The
average shipping costs for the random sample of orders is $7.93. The 95% confidence interval
would mean that if we take a second random sample of 60 orders then the shipping costs would
lie between $6.15 and $9.71 (table 10).
The mean shipping costs of all of 2002 customers are $12.45 (table 11).
Hypothesis Testing
Hypothesis 1
To test the hypothesis that there are differences in the average shipping costs between
order of “Critical” and “Low” priority a two-tailed independent sample t-test is used (table 12).
At 5% level of significance there is statistically significant differences between average shipping
costs of Critical and low priority orders, t(16) = -0.9957, p-value = 0.3342.
The average shipping costs for critical and low priority orders is $5.13 and $6.93
respectively.
Hypothesis 2
To test the hypothesis that there are differences in the average sales between order of
“Eastern” and “Western” region a two-tailed independent sample t-test is used (table 13). At 5%
level of significance there is statistically significant differences between average sales of Eastern
and Western region orders, t(58) = 0.9493, p-value = 2.0017.
The average sales for Eastern and Western region are $1367.34 and $838.59 respectively.
Document Page
6FINANCIAL STATISTICS
Correlation and Regression
Correlation
0 10 20 30 40 50 60
0
2000
4000
6000
8000
10000
12000
14000
f(x) = 21.1016536181929 x + 668.098698503367
R² = 0.0193885870594394
Relation of order quantity and
Sales ($)
Order Quantity
Sales ($)
Figure 1: Relation between Order quantity and sales ($)
Figure 1 presents the scattergram between order quantity and Sales. The sales of the
office supplies can be predicted thorough the equation (table 14)
Sales = 668.1 + 21.102*Order Quantity
The correlation between order quantity and Sales is r = 0.1392 (table 15). The correlation
is very weak, positive and linear.
1.94% of the variability in sales can be predicted from the order quantity.
The coefficient of slope of the equation is 668.1. Thus, the base sales price of an order is
$668.1.
tabler-icon-diamond-filled.svg

Paraphrase This Document

Need a fresh take? Get an instant paraphrase of this document with our AI Paraphraser
Document Page
7FINANCIAL STATISTICS
The coefficient of intercept of the equation is 21.102. Thus, for unit increase in item in an
order the sales cost would increase by $21.102.
To test the hypothesis that there is no linear relationship between sales and order
quantity-
Null Hypothesis The coefficient of the intercept is equal to zero
H0 : β1=0
Alternate Hypothesis The coefficient of the intercept is not equal to zero
H1 : β1 0
The coefficient of the intercept β1= 21.102.
The standard error of the intercept SE = 19.71.
Thus the test statistics for the coefficient of intercept t= β1
SE = 21.102
19.71 =1.071
The probability of the test statistics p-value = 0.289.
Thus at 0.5 level of significance we do not reject the Null Hypothesis. Thus, there is no linear
relationship between the order quantity and Sales.
Conclusion and Limitations
A random sample data of office supplies of hardware and garden supplies was analysed.
The investigation in the data shows that the maximum number of office supplies has a low
priority, are from the eastern region and supplied by regular air. Most of the customers of
Hardware and Garden Supplies are corporate customers. The bulk of the shipping is done by the
organization within 2 days of the order being booked. Moreover, there is no difference in the
sales cost of orders from the eastern and western region. In addition, there are also no significant
differences in the shipping cost of critical and low priority orders. It is also very difficult to
estimate the sales cost from the order quantity.
Document Page
8FINANCIAL STATISTICS
For the present analysis, we have analysed the data of only 60 customers. In order to
justify the results of the analysis data of similar samples should be reanalysed. Results of
repeated analysis would show whether the present analysis could be justified.
Document Page
9FINANCIAL STATISTICS
Appendices
Descriptive Statistics
Order Priority
Table 1: Frequency of Order Priority
Order Priority Importance of Order Count
0 Not Specified 16
1 Low 5
2 Medium 8
3 High 18
4 Critical 13
Not Specified Low Medium High Critical
0
2
4
6
8
10
12
14
16
18
20
16
5
8
18
13
Importance of Order
Importance of Order
Frequency
Figure 2: Frequency of Order Priority
tabler-icon-diamond-filled.svg

Paraphrase This Document

Need a fresh take? Get an instant paraphrase of this document with our AI Paraphraser
Document Page
10FINANCIAL STATISTICS
Order Quantity, Sales and Shipping costs
Table 2: Descriptive Statistics for Order Quantity, Sales and Shipping Costs
Statistics
Order
Quantity Sales
Shipping
Costs
Mean 24.37 1182.28 7.93
Median 24 444.38 5.83
Mode 26 #N/A 8.99
Standard Deviation 13.57 2056.04 7.04
Range 46 12790.49 42.02
Coefficient of Variation 56% 174% 89%
IQR 24 1223.42 5.67
Maximum 49 12805.25 42.52
Minimum 3 14.76 0.5
3rd Quartile 37 1354.15 8.99
1st Quartile 13 130.74 3.32
1 - 7 8 - 14 15 - 21 22 - 28 29 - 35 36 - 42 43 - 49
0
2
4
6
8
10
12
14
16
Distribution of Order Quantity
Order Qunatity
Frequency
Figure 3: Histogram of Order Quantity
Document Page
11FINANCIAL STATISTICS
1850 3700 5550 7400 9250 11100 12950
0
10
20
30
40
50
60
Distribution of Sales
Sales
Frequency
Figure 4: Histogram of Sales
Ship Mode
Table 4: Frequency distribution of Ship Mode
Ship Mode Shipping Mode Count
1 Regular Air 53
2 Delivery Truck 3
3 Express Air 4
Regular Air Delivery Truck Express Air
0
10
20
30
40
50
60 53
3 4
Distribution of Shipping mode
Shipping mode
Frequency
Figure 5: Distribution of Ship Mode
chevron_up_icon
1 out of 20
circle_padding
hide_on_mobile
zoom_out_icon