Business Decision Making: Assessing Innovation's Impact on Sales
VerifiedAdded on 2020/12/08
|20
|3928
|112
Report
AI Summary
This report examines the impact of innovative techniques on Queensgate Shopping Centre, a high-end mall in the UK. The study involved a survey of students from various colleges to assess how technological advancements affect sales and shopping habits. The report outlines the data collection plan, survey methodology, and questionnaire design. It then summarizes the survey data using descriptive statistics such as mean, median, mode, and standard deviation to analyze the results. Furthermore, the report explores measures of dispersion, including standard deviation, and calculates quartiles, percentiles, and correlation coefficients to provide a comprehensive analysis. Graphs are prepared to visualize sales trends, and the report concludes with a discussion of information processing tools, network diagrams, critical paths, and investment appraisal methods. The findings suggest that technological innovation positively influences sales and customer behavior at the shopping centre.
Business Decision making
Paraphrase This Document
Need a fresh take? Get an instant paraphrase of this document with our AI Paraphraser
TABLE OF CONTENTS
INTRODUCTION...........................................................................................................................1
TASK 1............................................................................................................................................1
A) Producing plan for collecting data....................................................................................1
B) Survey methodology and sampling frame.........................................................................2
C) Questionnaire.....................................................................................................................2
TASK 2............................................................................................................................................4
A) Summarising the data gathered from the survey...............................................................4
B) Analyse results of survey...................................................................................................6
C) Measures of dispersion......................................................................................................6
D) Calculation of quartiles, percentiles and the correlation coefficient.................................7
TASK 3............................................................................................................................................8
A) Preparation of graphs........................................................................................................8
B) Trend line graphs for three years for organisation............................................................8
C) Poster presentation.............................................................................................................8
D) Preparation of formal report..............................................................................................8
TASK 4............................................................................................................................................9
A) Information processing tools beneficial for the management...........................................9
B) Producing network diagram and critical path..................................................................10
C) Investment appraisal methods.........................................................................................11
CONCLUSION..............................................................................................................................13
REFERENCES..............................................................................................................................14
INTRODUCTION
Business decision-making is important to be taken to enhance overall performance.
Present report deals with assessing impact of innovative techniques on Queensgate Shopping
Centre which is one of the exotic high end mall in UK. Survey has been conducted of students
from various colleges and sample is taken in order to evaluate whether sales are injected because
of technological advancement or not and whether shopping habits are changed or not. Plan is
made by collecting primary and secondary data and questionnaire is prepared for gathering
results. Moreover, statistical tools are applied as well. Apart from this, investment appraisal
techniques are applied. Network diagram and critical path is made.
TASK 1
A) Producing plan for collecting data
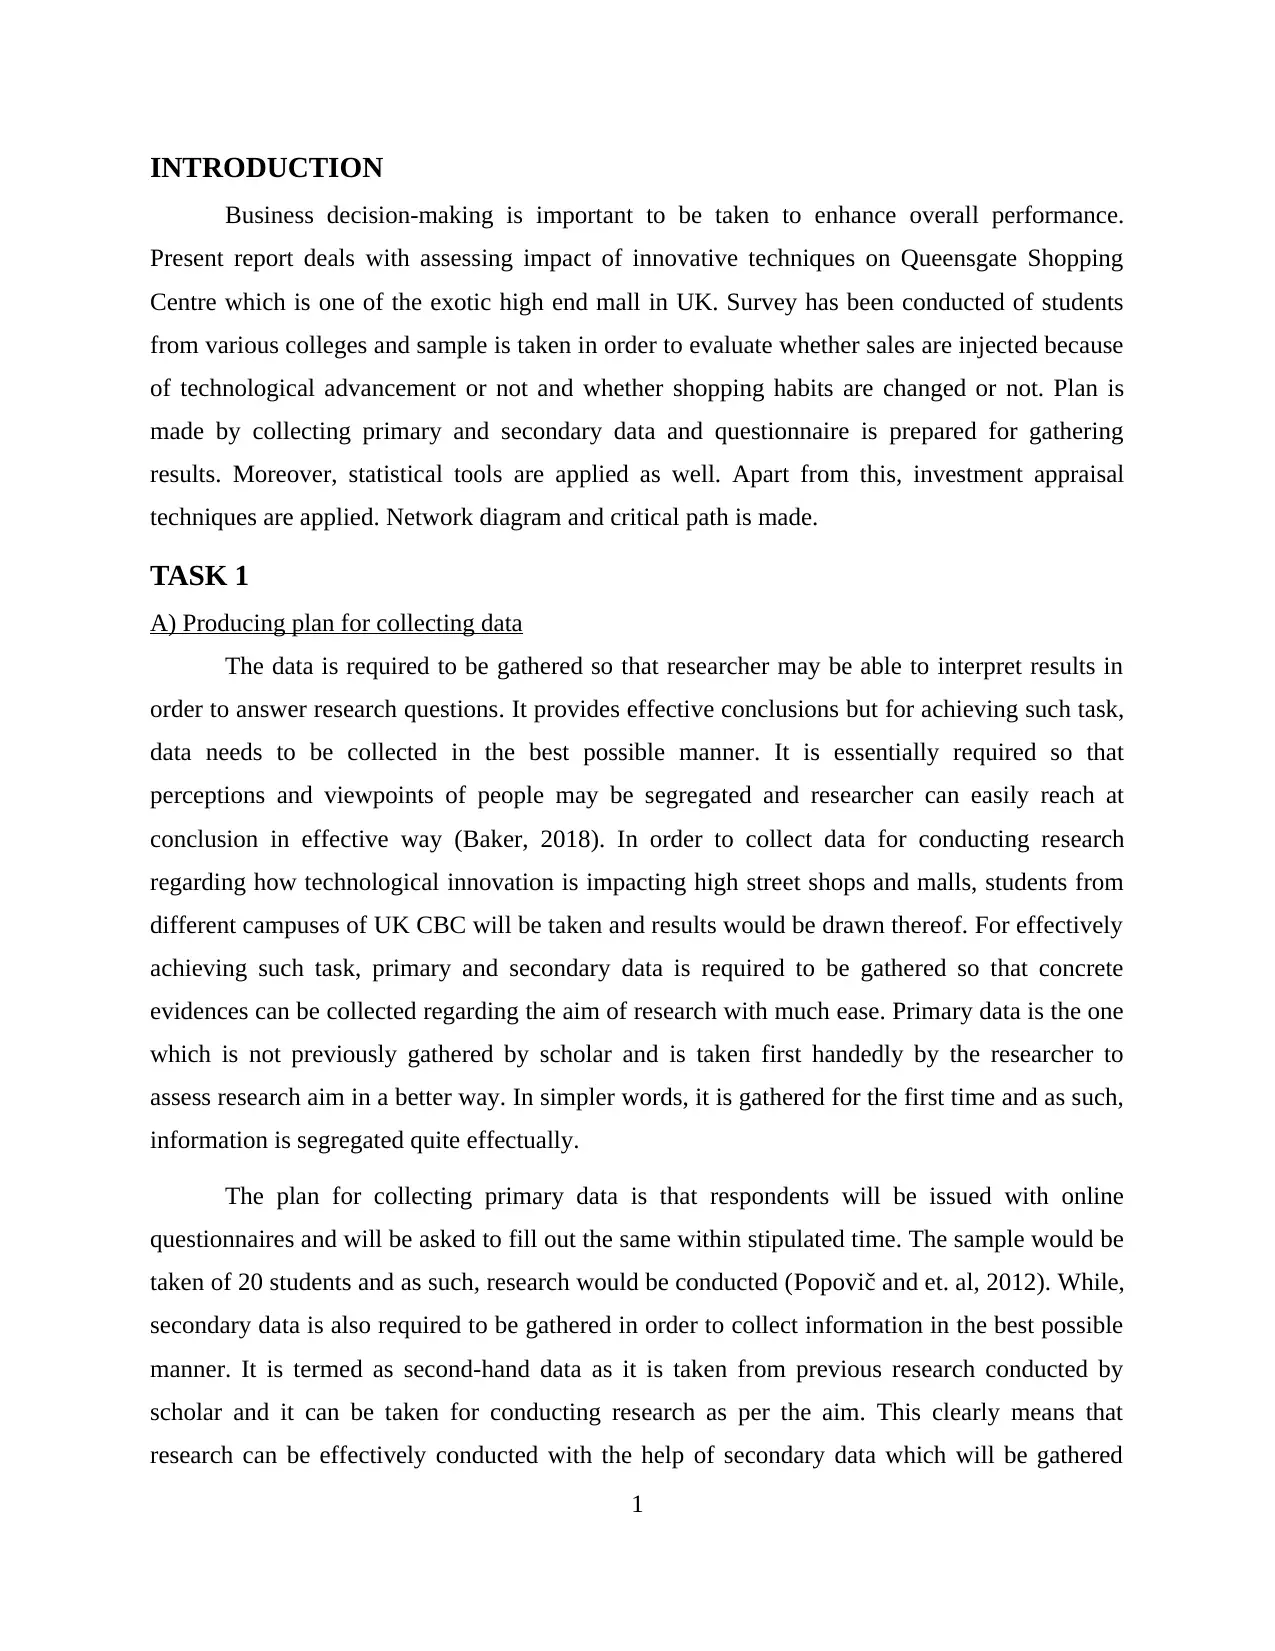
The data is required to be gathered so that researcher may be able to interpret results in
order to answer research questions. It provides effective conclusions but for achieving such task,
data needs to be collected in the best possible manner. It is essentially required so that
perceptions and viewpoints of people may be segregated and researcher can easily reach at
conclusion in effective way (Baker, 2018). In order to collect data for conducting research
regarding how technological innovation is impacting high street shops and malls, students from
different campuses of UK CBC will be taken and results would be drawn thereof. For effectively
achieving such task, primary and secondary data is required to be gathered so that concrete
evidences can be collected regarding the aim of research with much ease. Primary data is the one
which is not previously gathered by scholar and is taken first handedly by the researcher to
assess research aim in a better way. In simpler words, it is gathered for the first time and as such,
information is segregated quite effectually.
The plan for collecting primary data is that respondents will be issued with online
questionnaires and will be asked to fill out the same within stipulated time. The sample would be
taken of 20 students and as such, research would be conducted (Popovič and et. al, 2012). While,
secondary data is also required to be gathered in order to collect information in the best possible
manner. It is termed as second-hand data as it is taken from previous research conducted by
scholar and it can be taken for conducting research as per the aim. This clearly means that
research can be effectively conducted with the help of secondary data which will be gathered
1
Business decision-making is important to be taken to enhance overall performance.
Present report deals with assessing impact of innovative techniques on Queensgate Shopping
Centre which is one of the exotic high end mall in UK. Survey has been conducted of students
from various colleges and sample is taken in order to evaluate whether sales are injected because
of technological advancement or not and whether shopping habits are changed or not. Plan is
made by collecting primary and secondary data and questionnaire is prepared for gathering
results. Moreover, statistical tools are applied as well. Apart from this, investment appraisal
techniques are applied. Network diagram and critical path is made.
TASK 1
A) Producing plan for collecting data
The data is required to be gathered so that researcher may be able to interpret results in
order to answer research questions. It provides effective conclusions but for achieving such task,
data needs to be collected in the best possible manner. It is essentially required so that
perceptions and viewpoints of people may be segregated and researcher can easily reach at
conclusion in effective way (Baker, 2018). In order to collect data for conducting research
regarding how technological innovation is impacting high street shops and malls, students from
different campuses of UK CBC will be taken and results would be drawn thereof. For effectively
achieving such task, primary and secondary data is required to be gathered so that concrete
evidences can be collected regarding the aim of research with much ease. Primary data is the one
which is not previously gathered by scholar and is taken first handedly by the researcher to
assess research aim in a better way. In simpler words, it is gathered for the first time and as such,
information is segregated quite effectually.
The plan for collecting primary data is that respondents will be issued with online
questionnaires and will be asked to fill out the same within stipulated time. The sample would be
taken of 20 students and as such, research would be conducted (Popovič and et. al, 2012). While,
secondary data is also required to be gathered in order to collect information in the best possible
manner. It is termed as second-hand data as it is taken from previous research conducted by
scholar and it can be taken for conducting research as per the aim. This clearly means that
research can be effectively conducted with the help of secondary data which will be gathered
1
⊘ This is a preview!⊘
Do you want full access?
Subscribe today to unlock all pages.
Trusted by 1+ million students worldwide
from articles published on internet, books and journals in effective way. Thus, research can be
concluded with the help of primary and secondary data and as a result, concrete interpretation
could be made in effective manner.
B) Survey methodology and sampling frame
1. Survey methodology-
The survey methodology is required so that data collection process can be ease off and as
a result, aim of research can be met out with much ease. It will be helpful for analysing whether
technological innovation impacts high street shops, multi-utility shops and malls in achieving
objectives (Ford and Richardson, 2013). In relation to this, mall is chosen as a specific sector to
assess impact on sales in effective manner. For conducting research, mail ids of students will be
taken from the administrative unit of college in order to issue questionnaires to them and as such,
gather viewpoints of students in effectual way. It is one of the fast and cost effective method to
easily collect data in the best possible manner. Hence, conclusions could be taken out quite
effectually.
2. Sampling frame-
The sampling frame is required as it is not possible to take information from each and
every student of the university. It will be a tedious task for scholar in conducting such
information and is a time-consuming task as well. To overcome such situation, sampling frame is
the best available option so that data can be gathered by taking sample which will be the
representative of whole population (Pettigrew, 2014). In simpler words, simple random sampling
technique would be used in order to collect information in the best possible manner. It is required
and as such, this method will save time of scholar as well. Thus, sample of 20 students will be
taken for collecting data and as a result, conclusions would be extracted in effective manner.
C) Questionnaire
Questionnaire
Demographic information
Age
Name
Q 1. Do you think innovative techniques are helpful for accomplishing goals of Queensgate
2
Paraphrase This Document
Need a fresh take? Get an instant paraphrase of this document with our AI Paraphraser
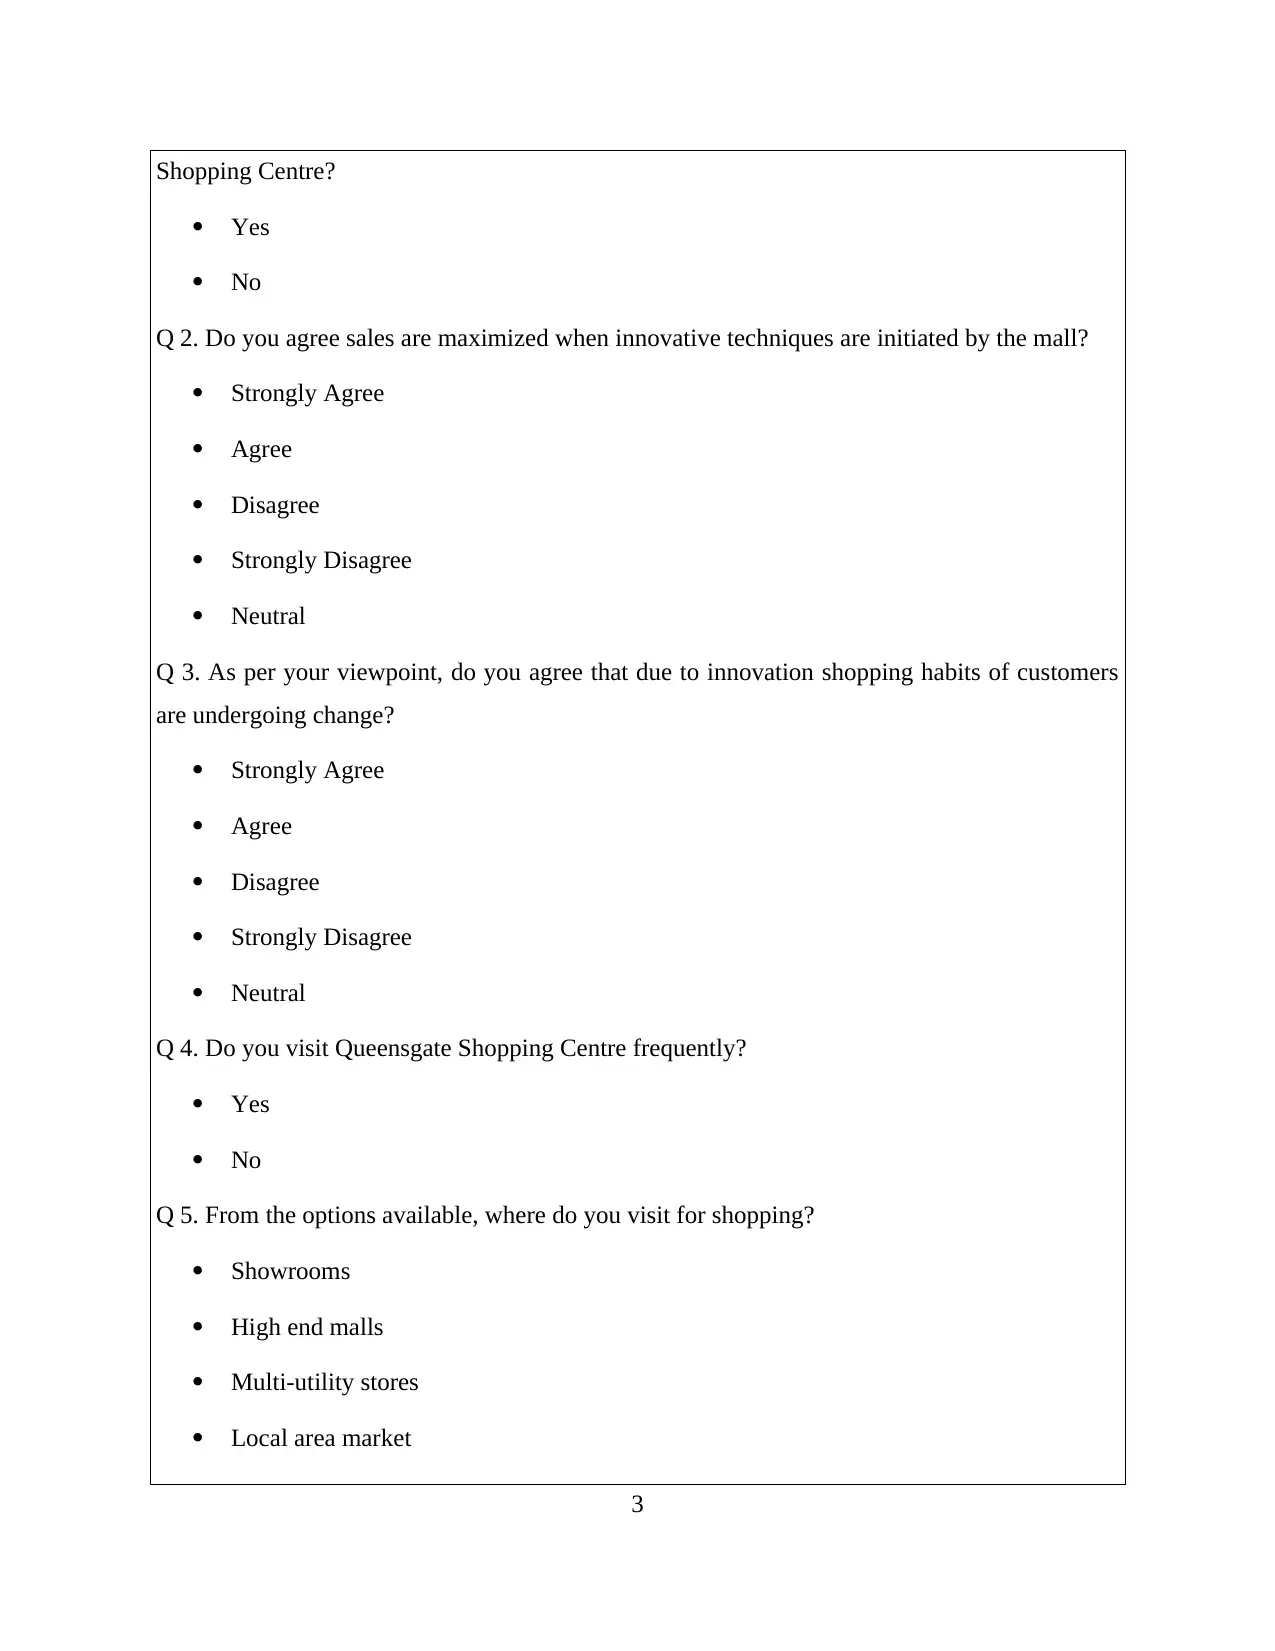
Shopping Centre?
Yes
No
Q 2. Do you agree sales are maximized when innovative techniques are initiated by the mall?
Strongly Agree
Agree
Disagree
Strongly Disagree
Neutral
Q 3. As per your viewpoint, do you agree that due to innovation shopping habits of customers
are undergoing change?
Strongly Agree
Agree
Disagree
Strongly Disagree
Neutral
Q 4. Do you visit Queensgate Shopping Centre frequently?
Yes
No
Q 5. From the options available, where do you visit for shopping?
Showrooms
High end malls
Multi-utility stores
Local area market
3
Yes
No
Q 2. Do you agree sales are maximized when innovative techniques are initiated by the mall?
Strongly Agree
Agree
Disagree
Strongly Disagree
Neutral
Q 3. As per your viewpoint, do you agree that due to innovation shopping habits of customers
are undergoing change?
Strongly Agree
Agree
Disagree
Strongly Disagree
Neutral
Q 4. Do you visit Queensgate Shopping Centre frequently?
Yes
No
Q 5. From the options available, where do you visit for shopping?
Showrooms
High end malls
Multi-utility stores
Local area market
3
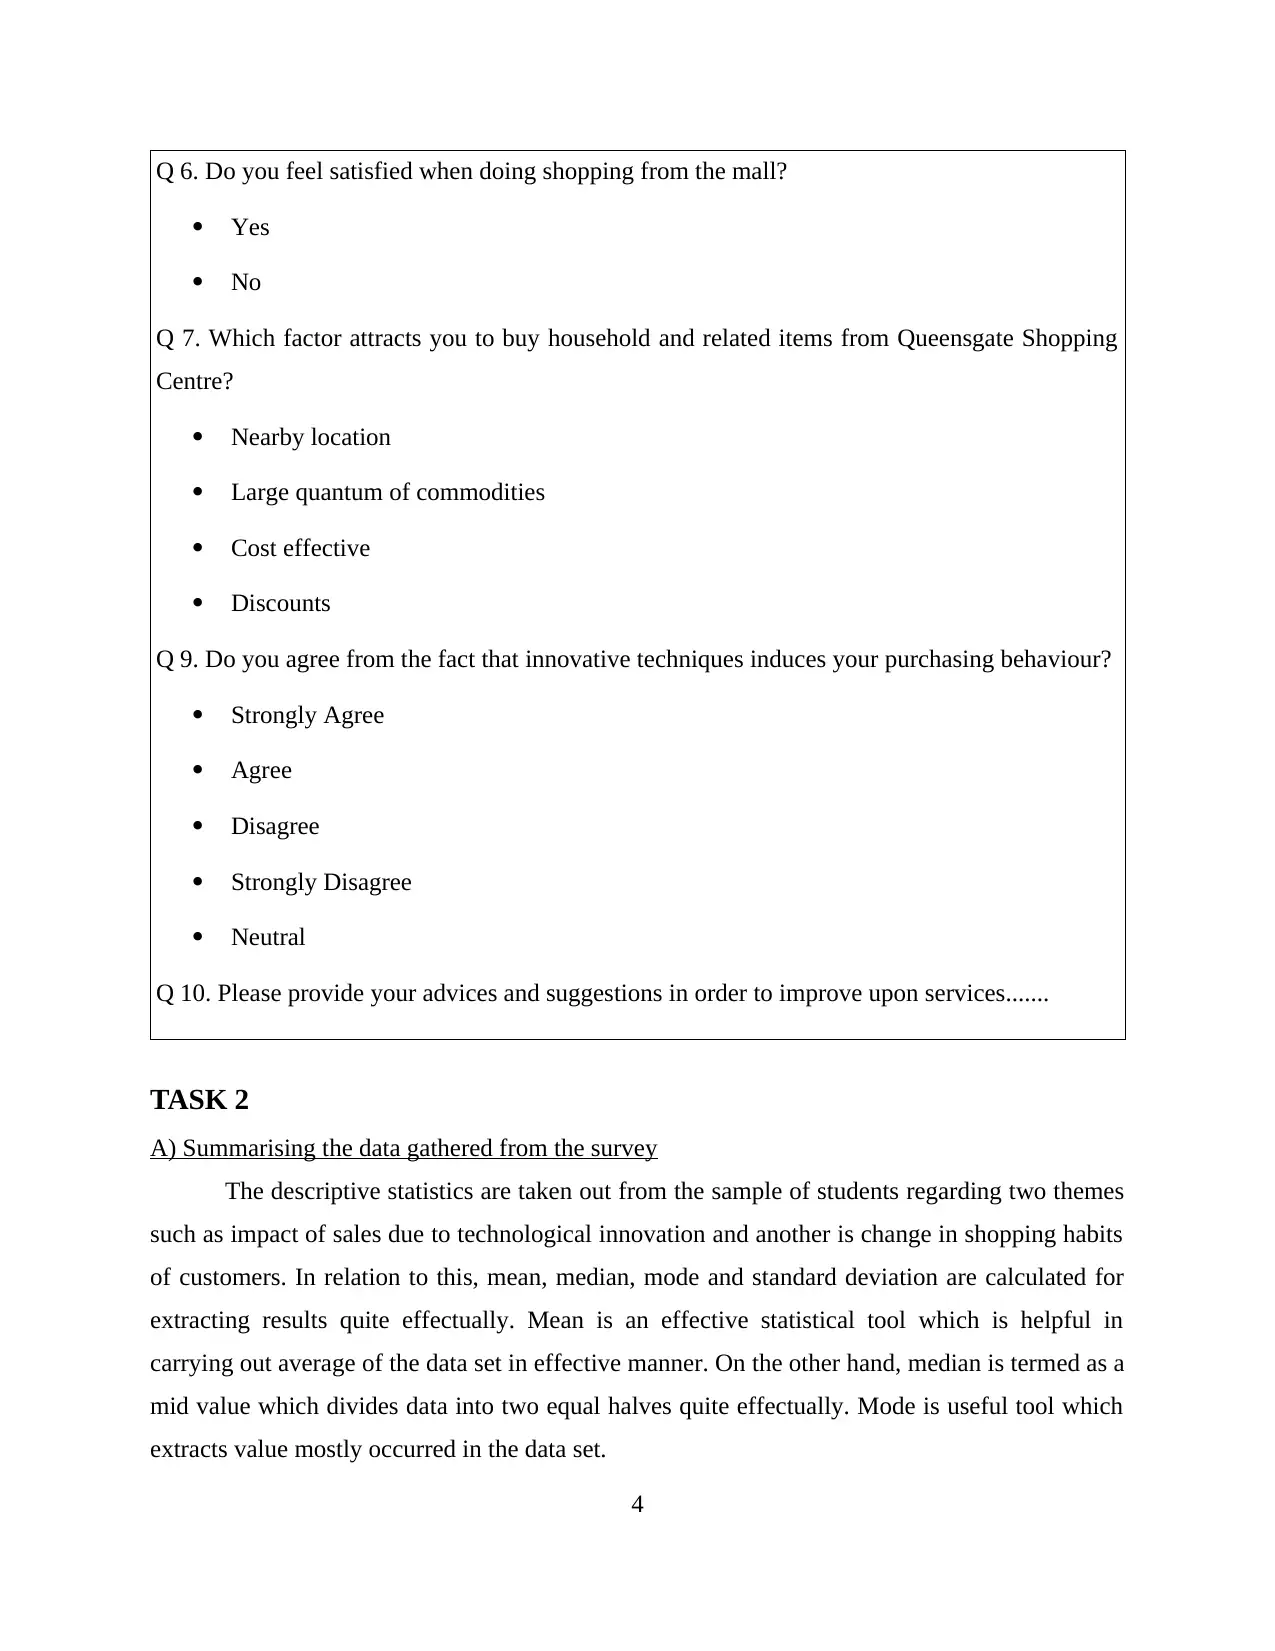
Q 6. Do you feel satisfied when doing shopping from the mall?
Yes
No
Q 7. Which factor attracts you to buy household and related items from Queensgate Shopping
Centre?
Nearby location
Large quantum of commodities
Cost effective
Discounts
Q 9. Do you agree from the fact that innovative techniques induces your purchasing behaviour?
Strongly Agree
Agree
Disagree
Strongly Disagree
Neutral
Q 10. Please provide your advices and suggestions in order to improve upon services.......
TASK 2
A) Summarising the data gathered from the survey
The descriptive statistics are taken out from the sample of students regarding two themes
such as impact of sales due to technological innovation and another is change in shopping habits
of customers. In relation to this, mean, median, mode and standard deviation are calculated for
extracting results quite effectually. Mean is an effective statistical tool which is helpful in
carrying out average of the data set in effective manner. On the other hand, median is termed as a
mid value which divides data into two equal halves quite effectually. Mode is useful tool which
extracts value mostly occurred in the data set.
4
⊘ This is a preview!⊘
Do you want full access?
Subscribe today to unlock all pages.
Trusted by 1+ million students worldwide
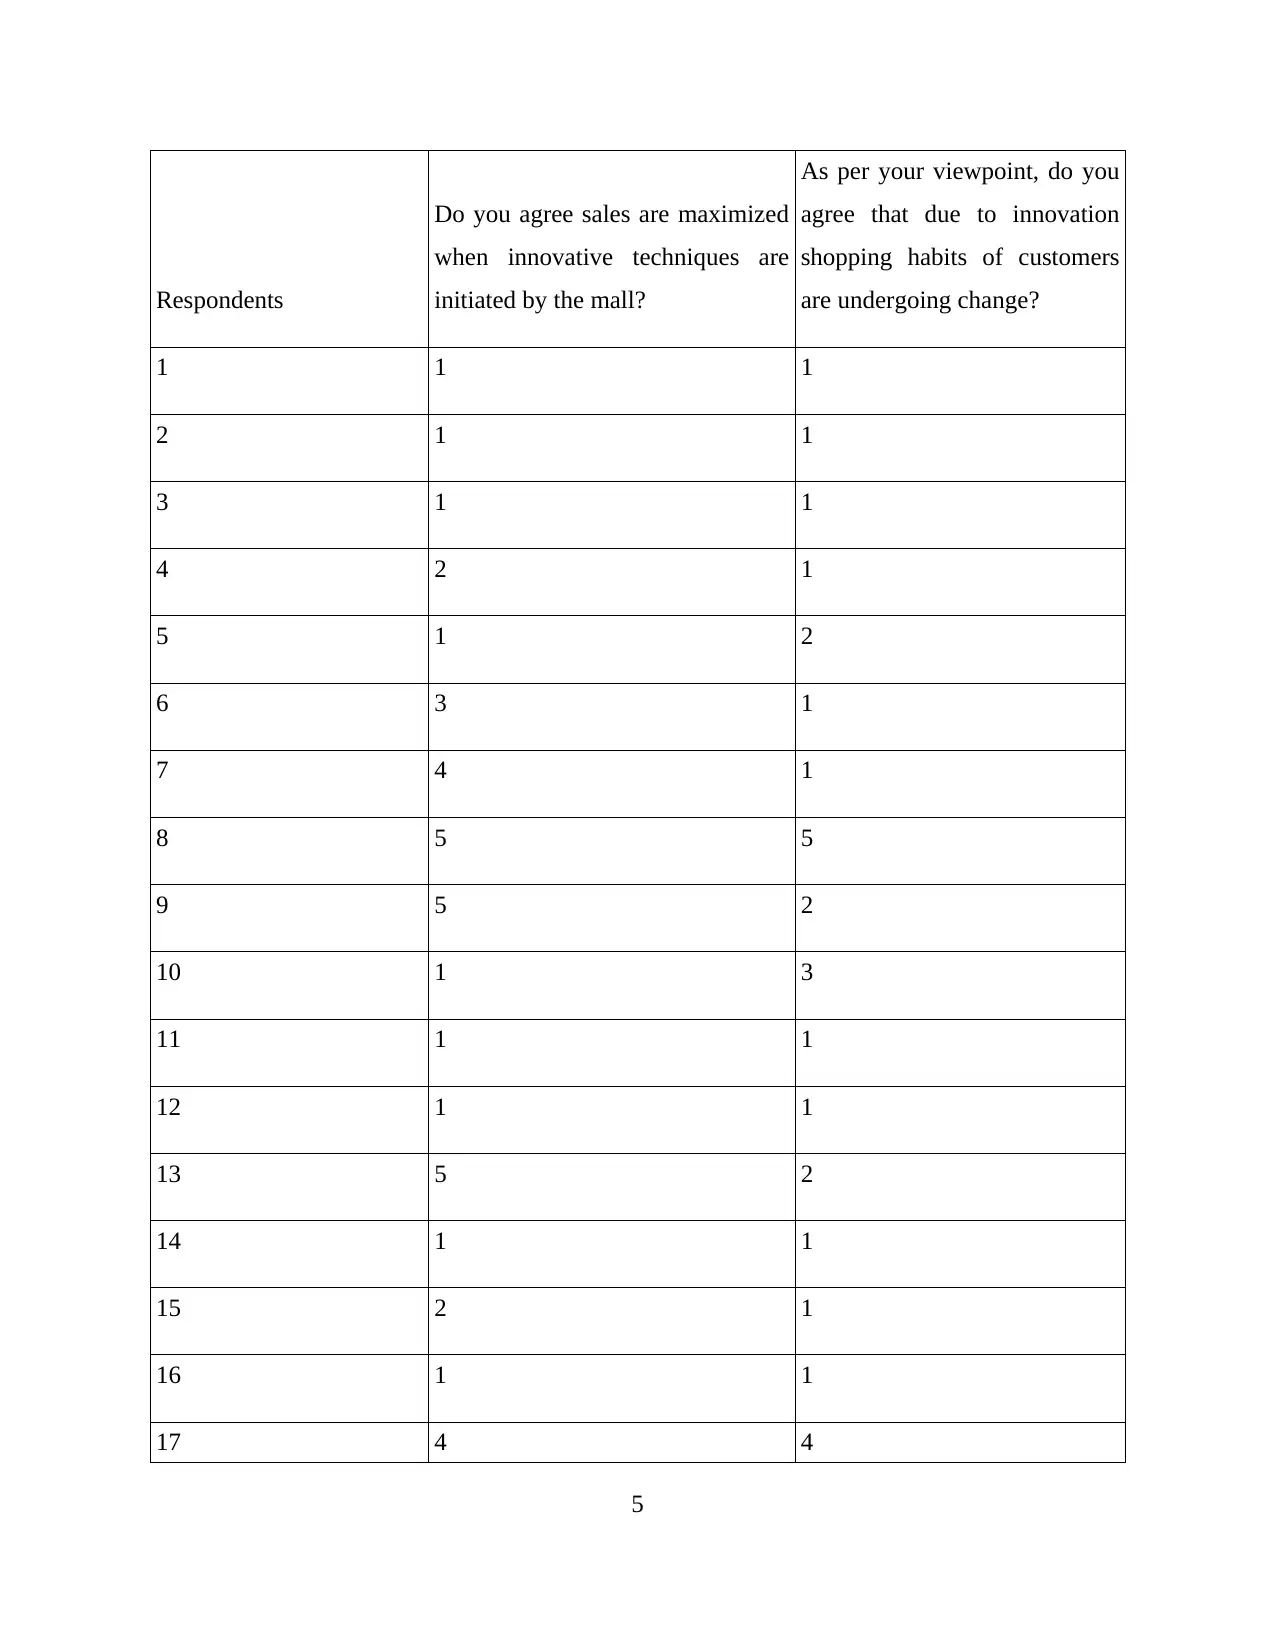
Respondents
Do you agree sales are maximized
when innovative techniques are
initiated by the mall?
As per your viewpoint, do you
agree that due to innovation
shopping habits of customers
are undergoing change?
1 1 1
2 1 1
3 1 1
4 2 1
5 1 2
6 3 1
7 4 1
8 5 5
9 5 2
10 1 3
11 1 1
12 1 1
13 5 2
14 1 1
15 2 1
16 1 1
17 4 4
5
Paraphrase This Document
Need a fresh take? Get an instant paraphrase of this document with our AI Paraphraser
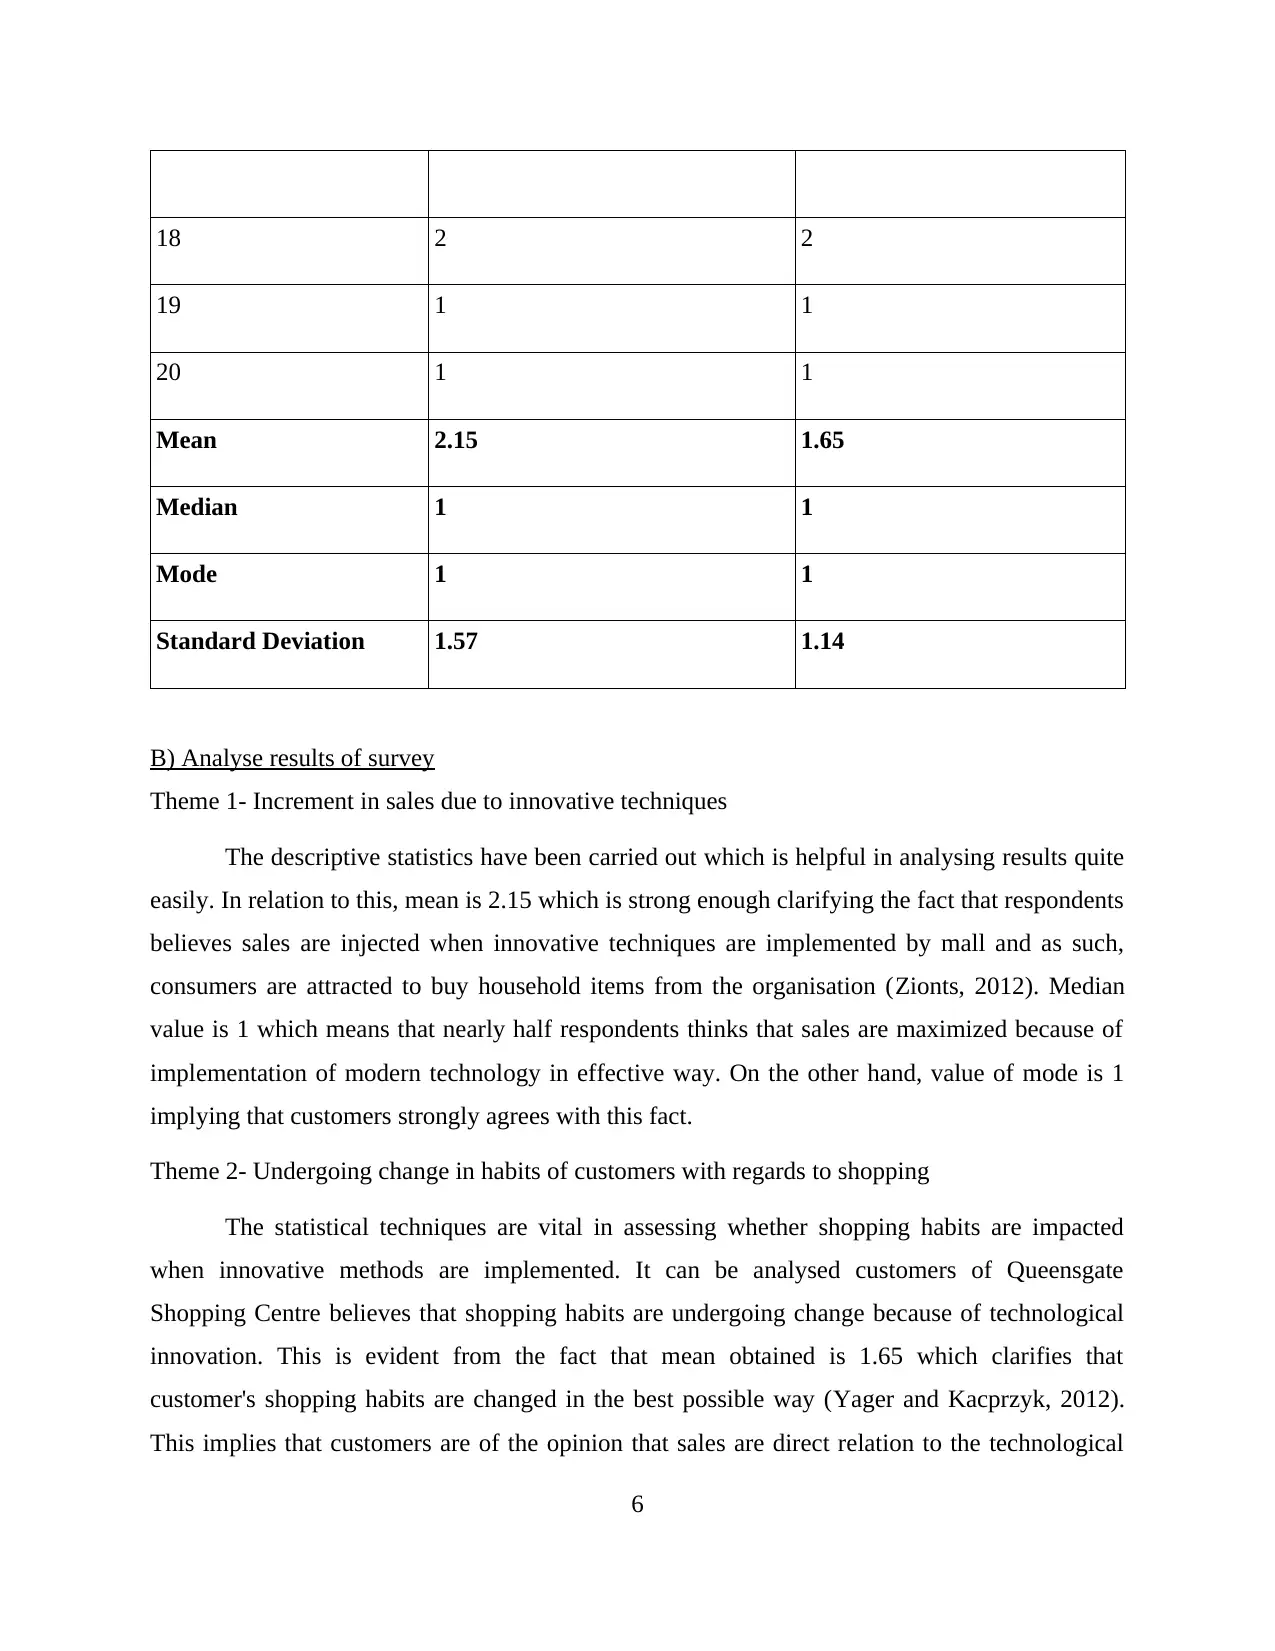
18 2 2
19 1 1
20 1 1
Mean 2.15 1.65
Median 1 1
Mode 1 1
Standard Deviation 1.57 1.14
B) Analyse results of survey
Theme 1- Increment in sales due to innovative techniques
The descriptive statistics have been carried out which is helpful in analysing results quite
easily. In relation to this, mean is 2.15 which is strong enough clarifying the fact that respondents
believes sales are injected when innovative techniques are implemented by mall and as such,
consumers are attracted to buy household items from the organisation (Zionts, 2012). Median
value is 1 which means that nearly half respondents thinks that sales are maximized because of
implementation of modern technology in effective way. On the other hand, value of mode is 1
implying that customers strongly agrees with this fact.
Theme 2- Undergoing change in habits of customers with regards to shopping
The statistical techniques are vital in assessing whether shopping habits are impacted
when innovative methods are implemented. It can be analysed customers of Queensgate
Shopping Centre believes that shopping habits are undergoing change because of technological
innovation. This is evident from the fact that mean obtained is 1.65 which clarifies that
customer's shopping habits are changed in the best possible way (Yager and Kacprzyk, 2012).
This implies that customers are of the opinion that sales are direct relation to the technological
6
innovation. Median and mode is also 1 clarifying that Queensgate Shopping Centre is benefited
by innovation as sales are incremented because shopping habits of customer's changes quite
effectively.
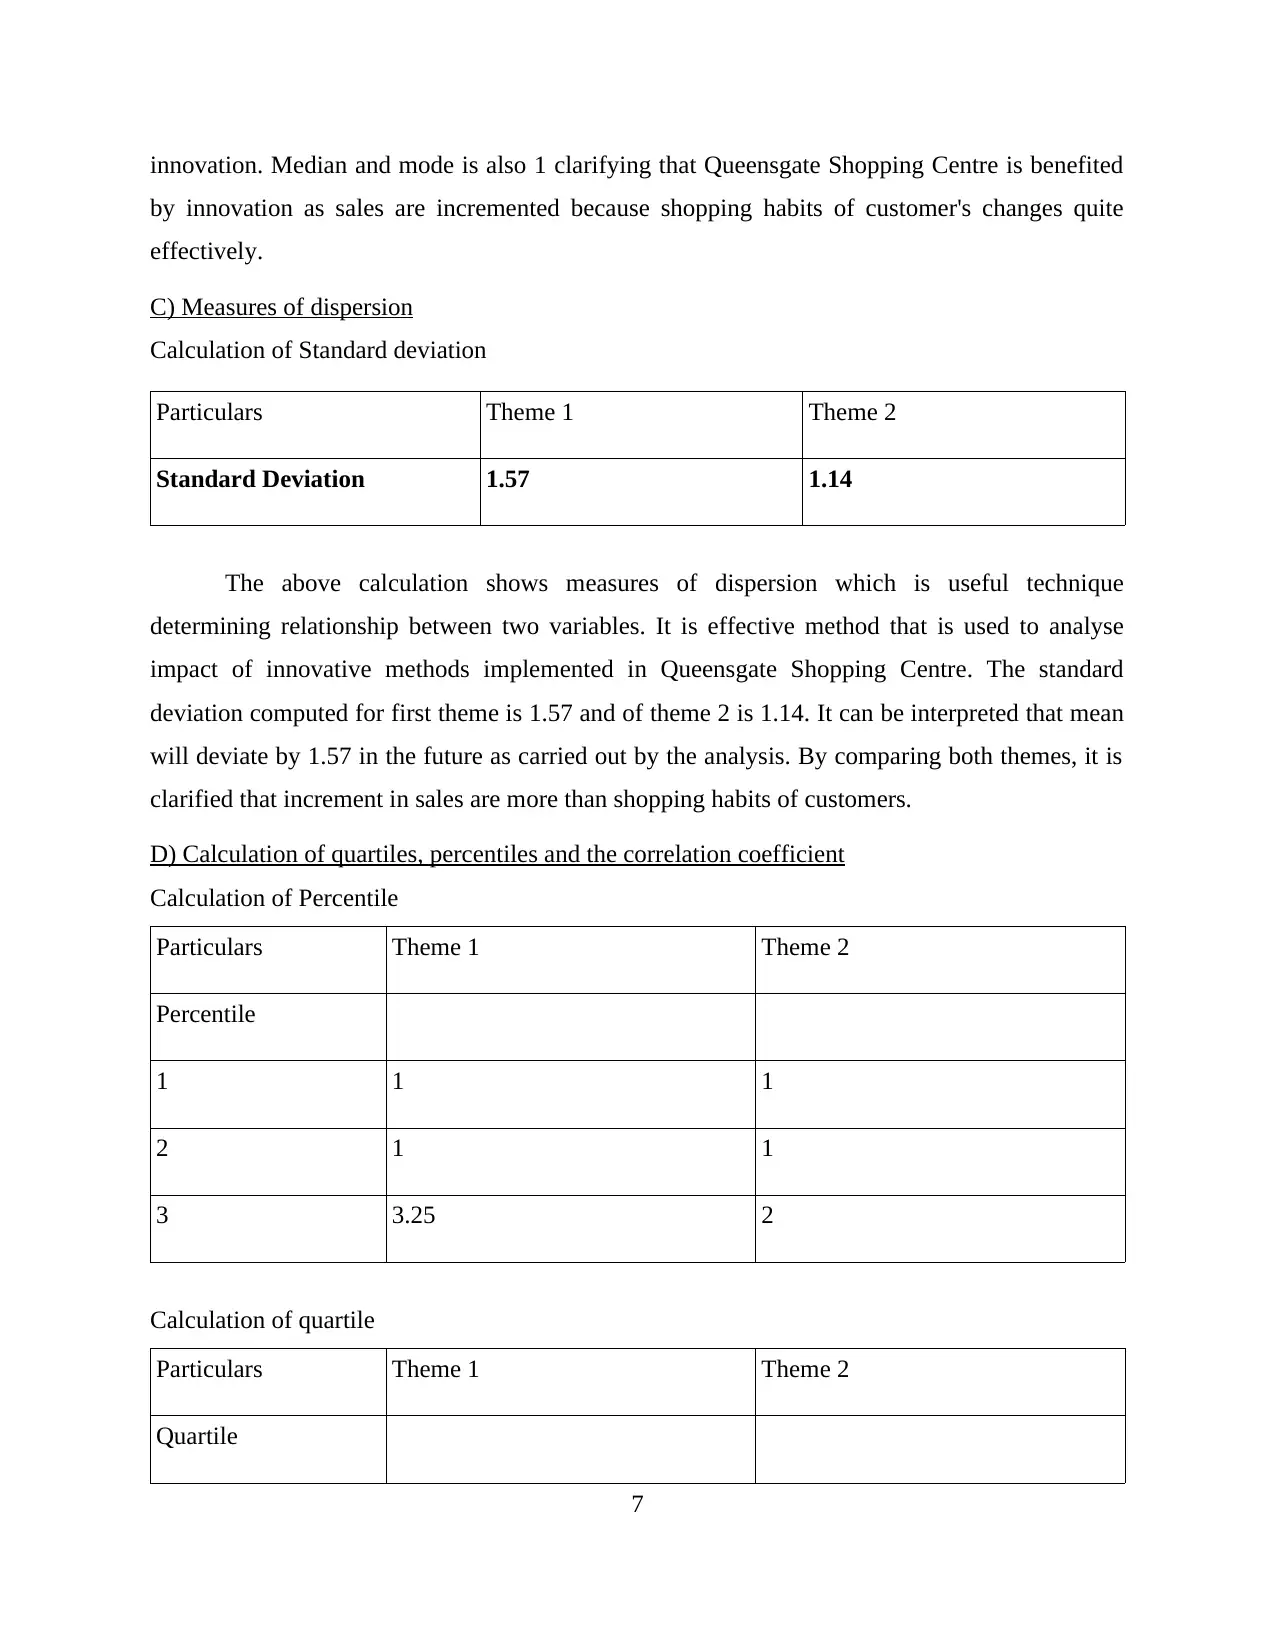
C) Measures of dispersion
Calculation of Standard deviation
Particulars Theme 1 Theme 2
Standard Deviation 1.57 1.14
The above calculation shows measures of dispersion which is useful technique
determining relationship between two variables. It is effective method that is used to analyse
impact of innovative methods implemented in Queensgate Shopping Centre. The standard
deviation computed for first theme is 1.57 and of theme 2 is 1.14. It can be interpreted that mean
will deviate by 1.57 in the future as carried out by the analysis. By comparing both themes, it is
clarified that increment in sales are more than shopping habits of customers.
D) Calculation of quartiles, percentiles and the correlation coefficient
Calculation of Percentile
Particulars Theme 1 Theme 2
Percentile
1 1 1
2 1 1
3 3.25 2
Calculation of quartile
Particulars Theme 1 Theme 2
Quartile
7
by innovation as sales are incremented because shopping habits of customer's changes quite
effectively.
C) Measures of dispersion
Calculation of Standard deviation
Particulars Theme 1 Theme 2
Standard Deviation 1.57 1.14
The above calculation shows measures of dispersion which is useful technique
determining relationship between two variables. It is effective method that is used to analyse
impact of innovative methods implemented in Queensgate Shopping Centre. The standard
deviation computed for first theme is 1.57 and of theme 2 is 1.14. It can be interpreted that mean
will deviate by 1.57 in the future as carried out by the analysis. By comparing both themes, it is
clarified that increment in sales are more than shopping habits of customers.
D) Calculation of quartiles, percentiles and the correlation coefficient
Calculation of Percentile
Particulars Theme 1 Theme 2
Percentile
1 1 1
2 1 1
3 3.25 2
Calculation of quartile
Particulars Theme 1 Theme 2
Quartile
7
⊘ This is a preview!⊘
Do you want full access?
Subscribe today to unlock all pages.
Trusted by 1+ million students worldwide
1 1 1
2 1 1
3 3.25 2
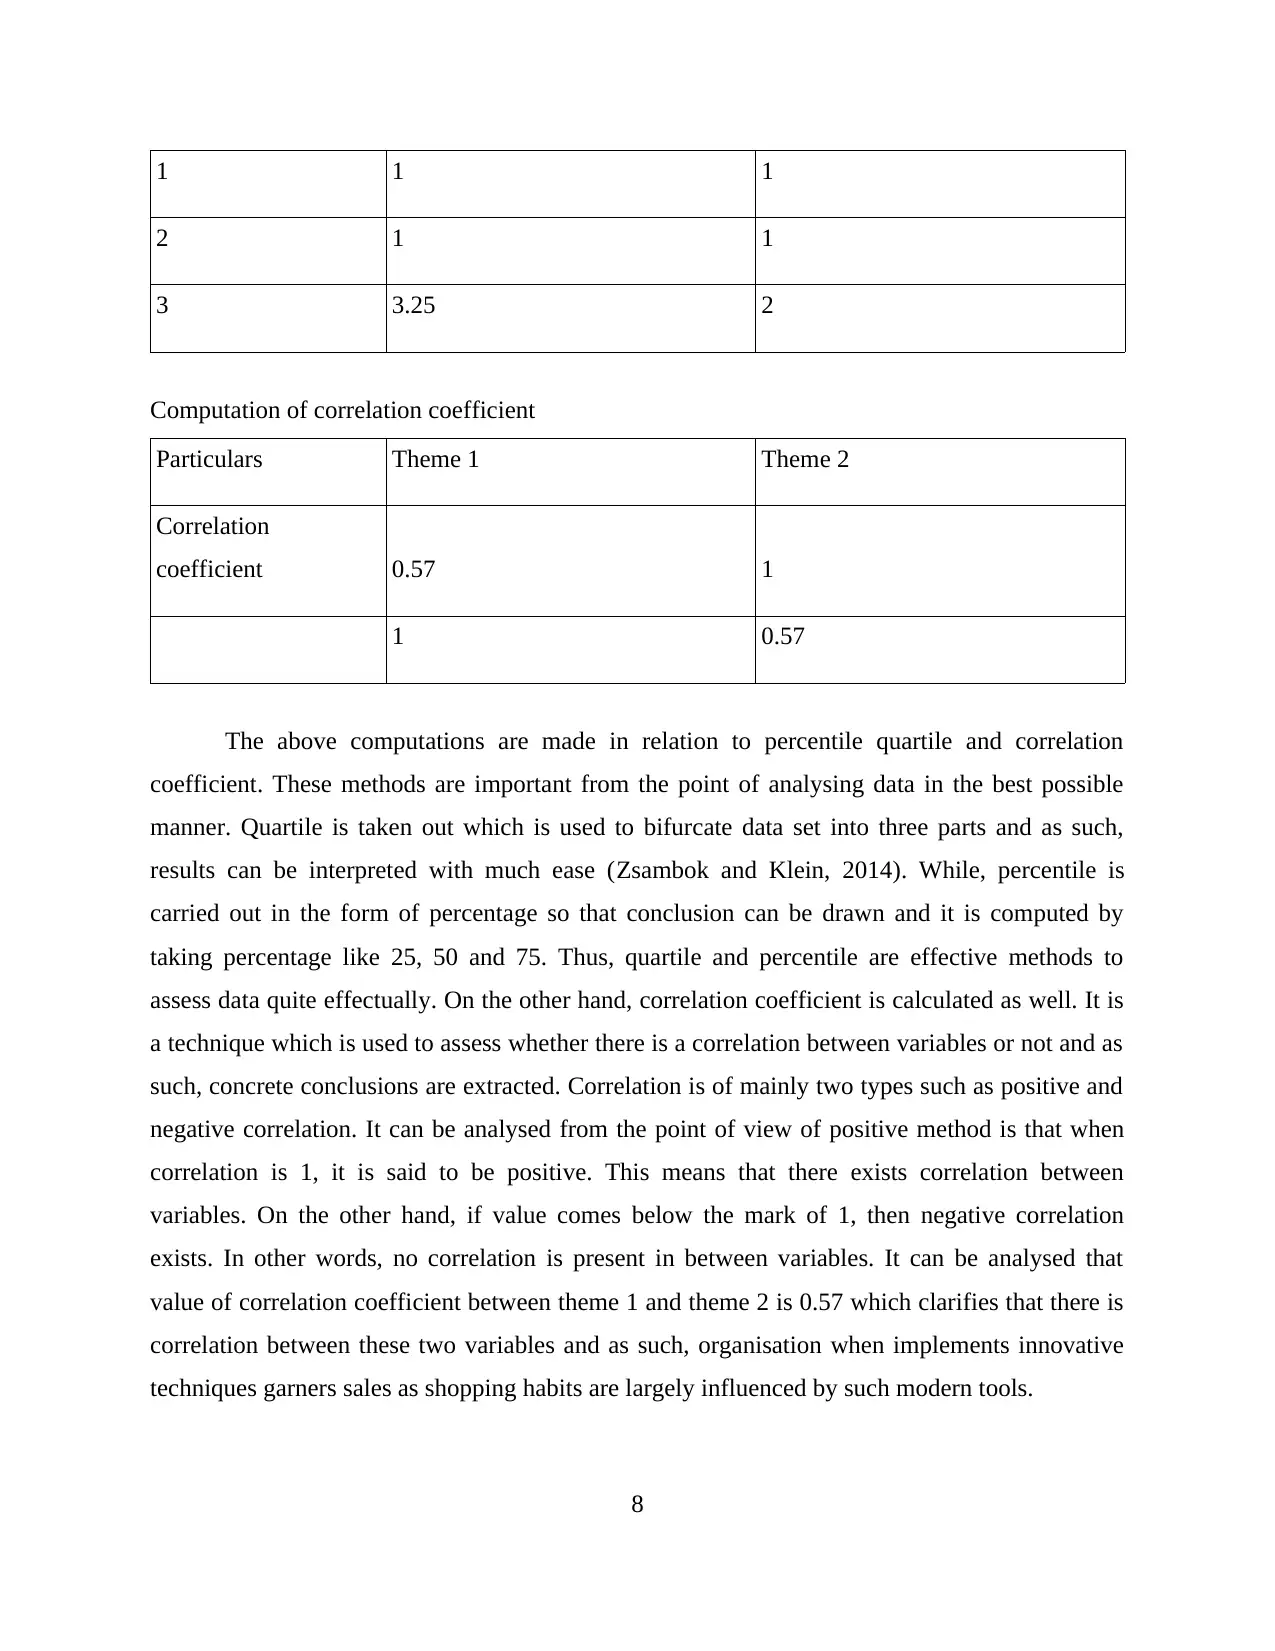
Computation of correlation coefficient
Particulars Theme 1 Theme 2
Correlation
coefficient 0.57 1
1 0.57
The above computations are made in relation to percentile quartile and correlation
coefficient. These methods are important from the point of analysing data in the best possible
manner. Quartile is taken out which is used to bifurcate data set into three parts and as such,
results can be interpreted with much ease (Zsambok and Klein, 2014). While, percentile is
carried out in the form of percentage so that conclusion can be drawn and it is computed by
taking percentage like 25, 50 and 75. Thus, quartile and percentile are effective methods to
assess data quite effectually. On the other hand, correlation coefficient is calculated as well. It is
a technique which is used to assess whether there is a correlation between variables or not and as
such, concrete conclusions are extracted. Correlation is of mainly two types such as positive and
negative correlation. It can be analysed from the point of view of positive method is that when
correlation is 1, it is said to be positive. This means that there exists correlation between
variables. On the other hand, if value comes below the mark of 1, then negative correlation
exists. In other words, no correlation is present in between variables. It can be analysed that
value of correlation coefficient between theme 1 and theme 2 is 0.57 which clarifies that there is
correlation between these two variables and as such, organisation when implements innovative
techniques garners sales as shopping habits are largely influenced by such modern tools.
8
2 1 1
3 3.25 2
Computation of correlation coefficient
Particulars Theme 1 Theme 2
Correlation
coefficient 0.57 1
1 0.57
The above computations are made in relation to percentile quartile and correlation
coefficient. These methods are important from the point of analysing data in the best possible
manner. Quartile is taken out which is used to bifurcate data set into three parts and as such,
results can be interpreted with much ease (Zsambok and Klein, 2014). While, percentile is
carried out in the form of percentage so that conclusion can be drawn and it is computed by
taking percentage like 25, 50 and 75. Thus, quartile and percentile are effective methods to
assess data quite effectually. On the other hand, correlation coefficient is calculated as well. It is
a technique which is used to assess whether there is a correlation between variables or not and as
such, concrete conclusions are extracted. Correlation is of mainly two types such as positive and
negative correlation. It can be analysed from the point of view of positive method is that when
correlation is 1, it is said to be positive. This means that there exists correlation between
variables. On the other hand, if value comes below the mark of 1, then negative correlation
exists. In other words, no correlation is present in between variables. It can be analysed that
value of correlation coefficient between theme 1 and theme 2 is 0.57 which clarifies that there is
correlation between these two variables and as such, organisation when implements innovative
techniques garners sales as shopping habits are largely influenced by such modern tools.
8
Paraphrase This Document
Need a fresh take? Get an instant paraphrase of this document with our AI Paraphraser
TASK 3
A) Preparation of graphs
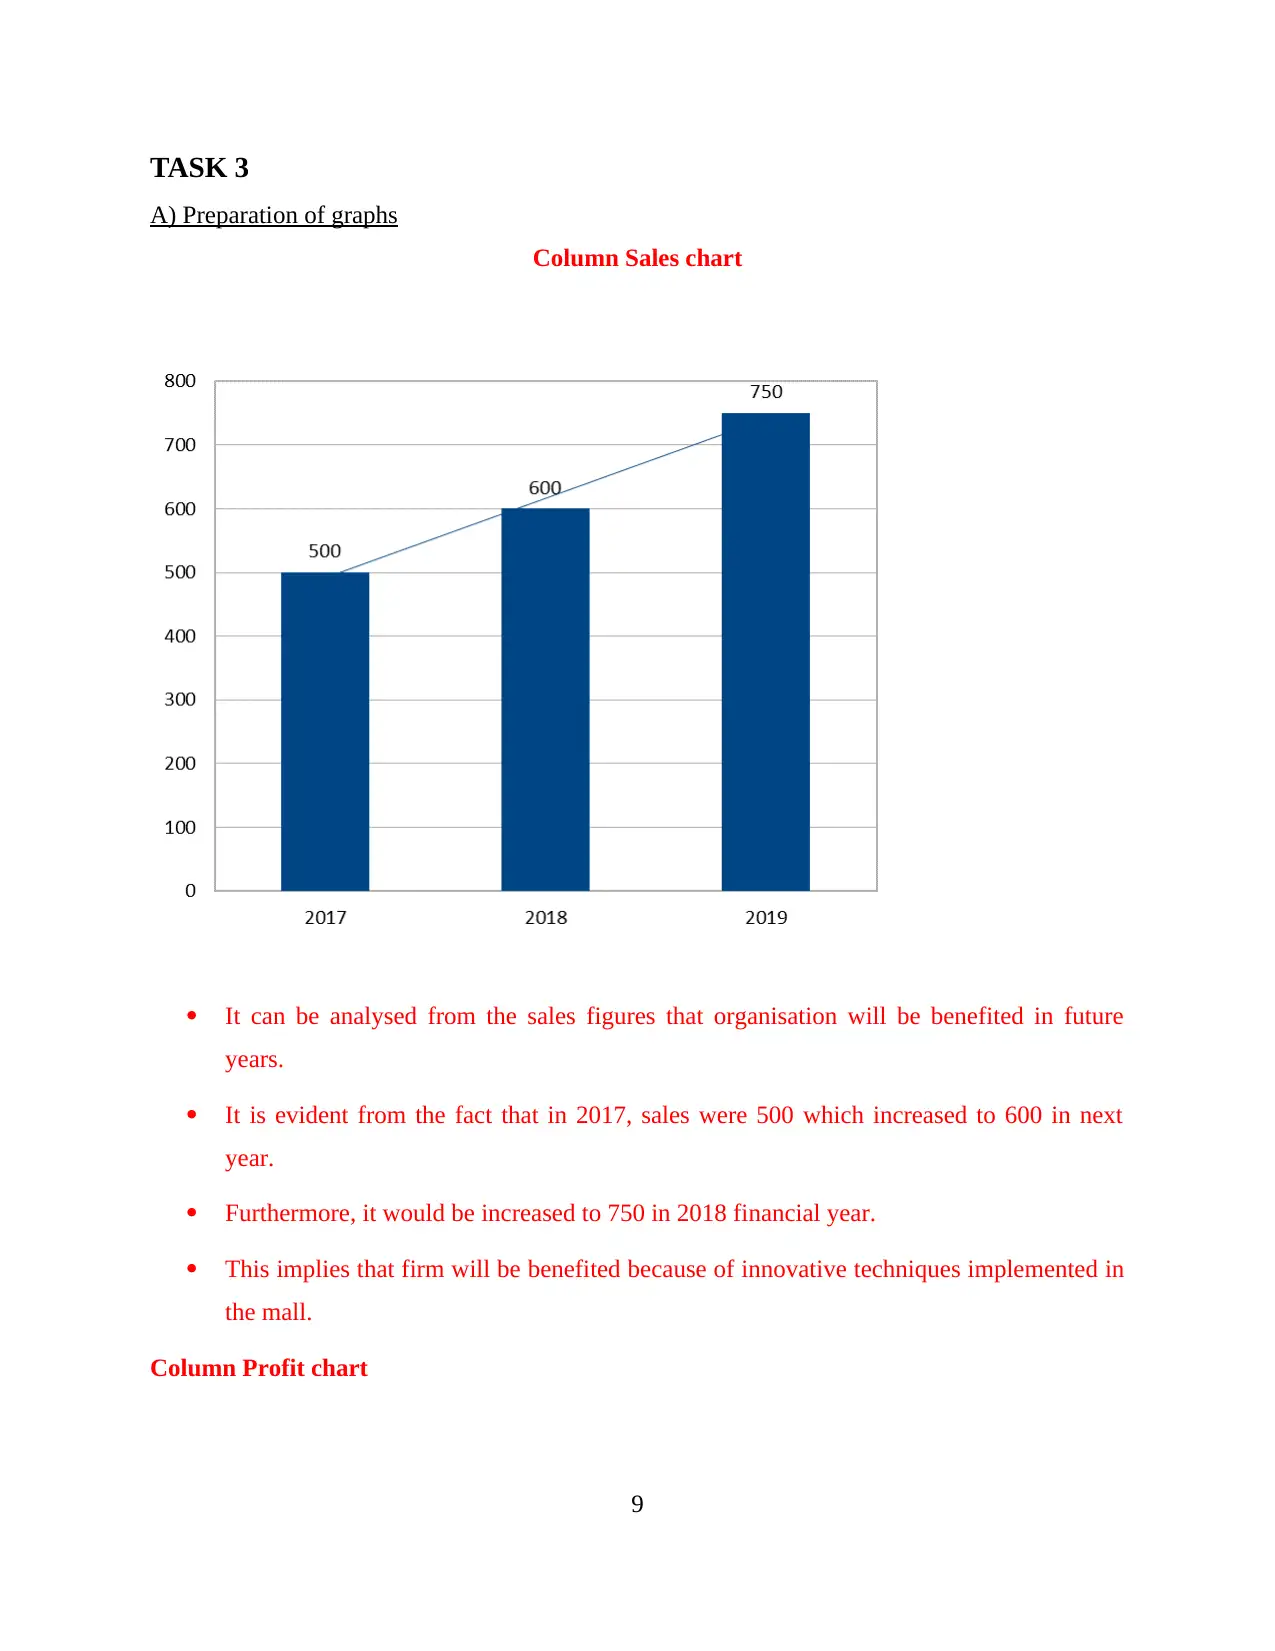
Column Sales chart
It can be analysed from the sales figures that organisation will be benefited in future
years.
It is evident from the fact that in 2017, sales were 500 which increased to 600 in next
year.
Furthermore, it would be increased to 750 in 2018 financial year.
This implies that firm will be benefited because of innovative techniques implemented in
the mall.
Column Profit chart
9
A) Preparation of graphs
Column Sales chart
It can be analysed from the sales figures that organisation will be benefited in future
years.
It is evident from the fact that in 2017, sales were 500 which increased to 600 in next
year.
Furthermore, it would be increased to 750 in 2018 financial year.
This implies that firm will be benefited because of innovative techniques implemented in
the mall.
Column Profit chart
9
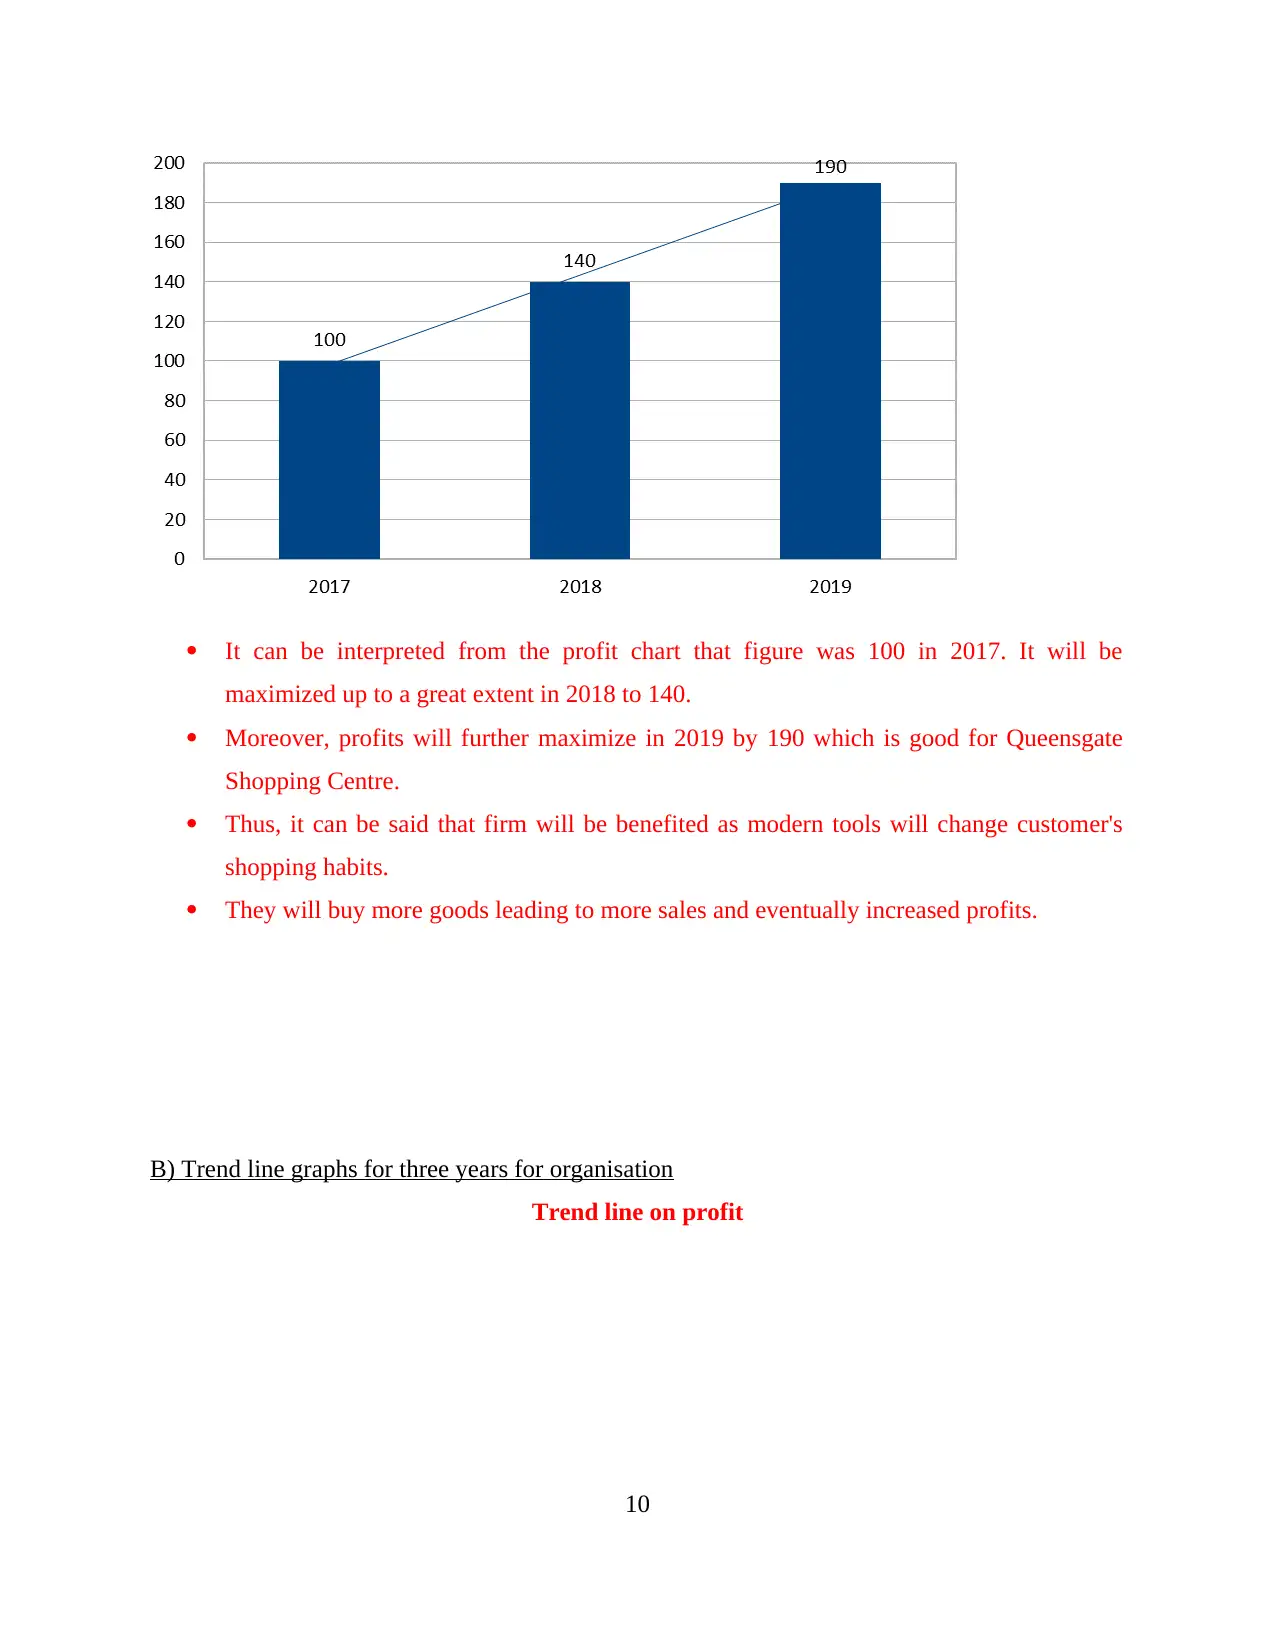
It can be interpreted from the profit chart that figure was 100 in 2017. It will be
maximized up to a great extent in 2018 to 140.
Moreover, profits will further maximize in 2019 by 190 which is good for Queensgate
Shopping Centre.
Thus, it can be said that firm will be benefited as modern tools will change customer's
shopping habits.
They will buy more goods leading to more sales and eventually increased profits.
B) Trend line graphs for three years for organisation
Trend line on profit
10
⊘ This is a preview!⊘
Do you want full access?
Subscribe today to unlock all pages.
Trusted by 1+ million students worldwide
1 out of 20
Related Documents


Your All-in-One AI-Powered Toolkit for Academic Success.
+13062052269
info@desklib.com
Available 24*7 on WhatsApp / Email
![[object Object]](/_next/static/media/star-bottom.7253800d.svg)
Unlock your academic potential
Copyright © 2020–2026 A2Z Services. All Rights Reserved. Developed and managed by ZUCOL.