Factors Affecting Sales Volume of Products: Hubbard Foods Limited
VerifiedAdded on 2023/06/03
|34
|4999
|369
Report
AI Summary
This report investigates the factors affecting the sales volume of Hubbard Foods Limited products in New Zealand. It uses a descriptive research design incorporating primary data from an online survey and secondary data from the company's website and the New Zealand Data Portal. The study examines the influence of product type, price, market location, consumer preferences, and product promotion on sales. Key findings indicate that product type and price significantly impact sales, with cereals being the most favored product and affordability playing a crucial role. The report recommends that Hubbard Foods Limited conduct thorough market research to align product offerings with consumer tastes, implement targeted product promotions, and invest in sales training to enhance product awareness and customer engagement. The research concludes by emphasizing the importance of understanding consumer behavior and adapting marketing strategies to optimize sales volume.
FACTORS AFFECTING SALES
VOLUME OF PRODUCTS
VOLUME OF PRODUCTS
Paraphrase This Document
Need a fresh take? Get an instant paraphrase of this document with our AI Paraphraser
EXECUTIVE SUMMARY
This report outlines the findings and recommendations on the factors that affect the sales of
products produced by a company, based on the case study of Hubbard Foods Limited. Findings
and recommendations were laid down based on six leading research questions. The objective of
this study is to assess the factors that affect the sales volume of the products produced by a
company.
Factors like product type, product price and city where the product is sold have been assessed
and description made on the influence of these factors on sales of the product. In addition to this,
effect of consumer attributes and preferences on product sales have also been discussed.
This study was conducted using the case study method in the form of descriptive research,
involving both primary and secondary sources of data. Primary data were obtained by conducting
an online survey.
Based on the findings of the research, recommendations were made on what companies should
do to improve their product sales some of which are;
The company should conduct market research on product preference and consumer taste in order
to produce goods that will increase their profit margins. Being specific on the products to deal in
will minimize costs of production on a large variety of products. Also, product preference
analysis will ensure that the products supplied to the consumers achieve high sales volume.
Product promotions should be employed in order to achieve sales targets. The company sales
persons should get training on how to sell, approach existing and potential customers and ion
how to enhance their product awareness.
Table of Contents
RESEARCH METHODOLOGY.........................................................................................................................1
RESEARCH DESIGN AND AREA DESCRIPTION...........................................................................................1
Data sources and gathering techniques..................................................................................................1
Data analysis............................................................................................................................................2
RESULTS AND DISCUSSIONS........................................................................................................................3
Demographic characteristics...................................................................................................................3
Factors affecting sales volume of company products..............................................................................4
Gender.................................................................................................................................................4
Product type........................................................................................................................................5
Product price.......................................................................................................................................7
Market location.................................................................................................................................11
Consumer preference........................................................................................................................15
Product promotion (advertising).......................................................................................................16
CONCLUSIONS AND RECOMMENDATIONS................................................................................................17
CONCLUSIONS.......................................................................................................................................17
RECOMMENDATIONS............................................................................................................................18
REFERENCES..............................................................................................................................................19
⊘ This is a preview!⊘
Do you want full access?
Subscribe today to unlock all pages.
Trusted by 1+ million students worldwide
RESEARCH METHODOLOGY
RESEARCH DESIGN AND AREA DESCRIPTION
This study was conducted in New Zealand. Responses were sought from participants of different
cities in the country on Hubbard Foods limited products. The cities from where responses were
received are Auckland, Wellington, Christchurch, Dunedin, New Plymouth, Nelson and
Hamilton. Hubbard Foods Limited is domiciled in the city of Auckland, the county’s largest city.
Data Sources and Gathering Techniques
For purposes of this research, both primary and secondary sources of data collection were
employed. Primary data was obtained from responses based on an online survey. For collecting
the primary data questionnaires were administered online to voluntary respondents. Questions
contained in the questionnaires were both open-ended and closed-ended. There was one open-
ended question which wanted to find out the respondents’ breakfast preference. Nonetheless, not
only primary data would suffice to answer the research question. Secondary data was also used.
The secondary sources of data were;
The Hubbard Foods Limited official website (Hubbard Foods Limited, 2018). This
source provided information on Hubbard Foods Limited sales and the different
production lines on the Hubbard Foods Limited production.
The New Zealand Data Portal (New Zealand Government, 2018). This source provided
information on area description and population characteristics distribution of New
Zealand.
The data collected was both quantitative and qualitative. The research employed two quantitative
techniques for purposes of data collection, analysis and reporting;
1
Paraphrase This Document
Need a fresh take? Get an instant paraphrase of this document with our AI Paraphraser
i) Survey
Survey was used for collecting primary data from respondents. The technique was
conducted in the form of questionnaires issued in an online survey. Questionnaires
were sent to the respondents’ emails in the form of Google forms. Respondents filled
and submitted their responses.
An online survey was the most effective method of data collection from the Hubbard
Foods Limited customers as it allowed respondents to submit responses at their own
comfort. Online surveys are also cost effective contrary to physical data collection.
ii) Quasi experimental technique
The technique was used for comparing the prices, product type, gender, market
location and product promotion with sales of different products of Hubbard Foods
Limited.
Online questionnaires were administered and a total of 1041 Hubbard Foods Limited customers
provided responses for the online survey. An online survey was the most effective method of
data collection from the Hubbard’s Foods Limited customers as it allowed respondents to submit
responses at their own comfort and online surveys are also cost effective contrary to physical
data collection.
Of the 1041 respondents, 30 were randomly sampled and admitted into our study. Only 30 were
sampled for ease of computability and analysis of our data.
Data analysis
The data collected was analyzed using different methods for descriptive statistics (mean,
standard deviation, frequencies and cumulative percentages) and association between variables.
Tools like pie charts, graphs, cross tabulation and percentages were used to report results.
2
Excel and SPSS were used for entry and analysis of data.
RESULTS AND DISCUSSIONS
In this section data was analyzed and presented in a manner to be easily understood. The results
and discussions are presented side by side for simplicity.
Demographic Characteristics
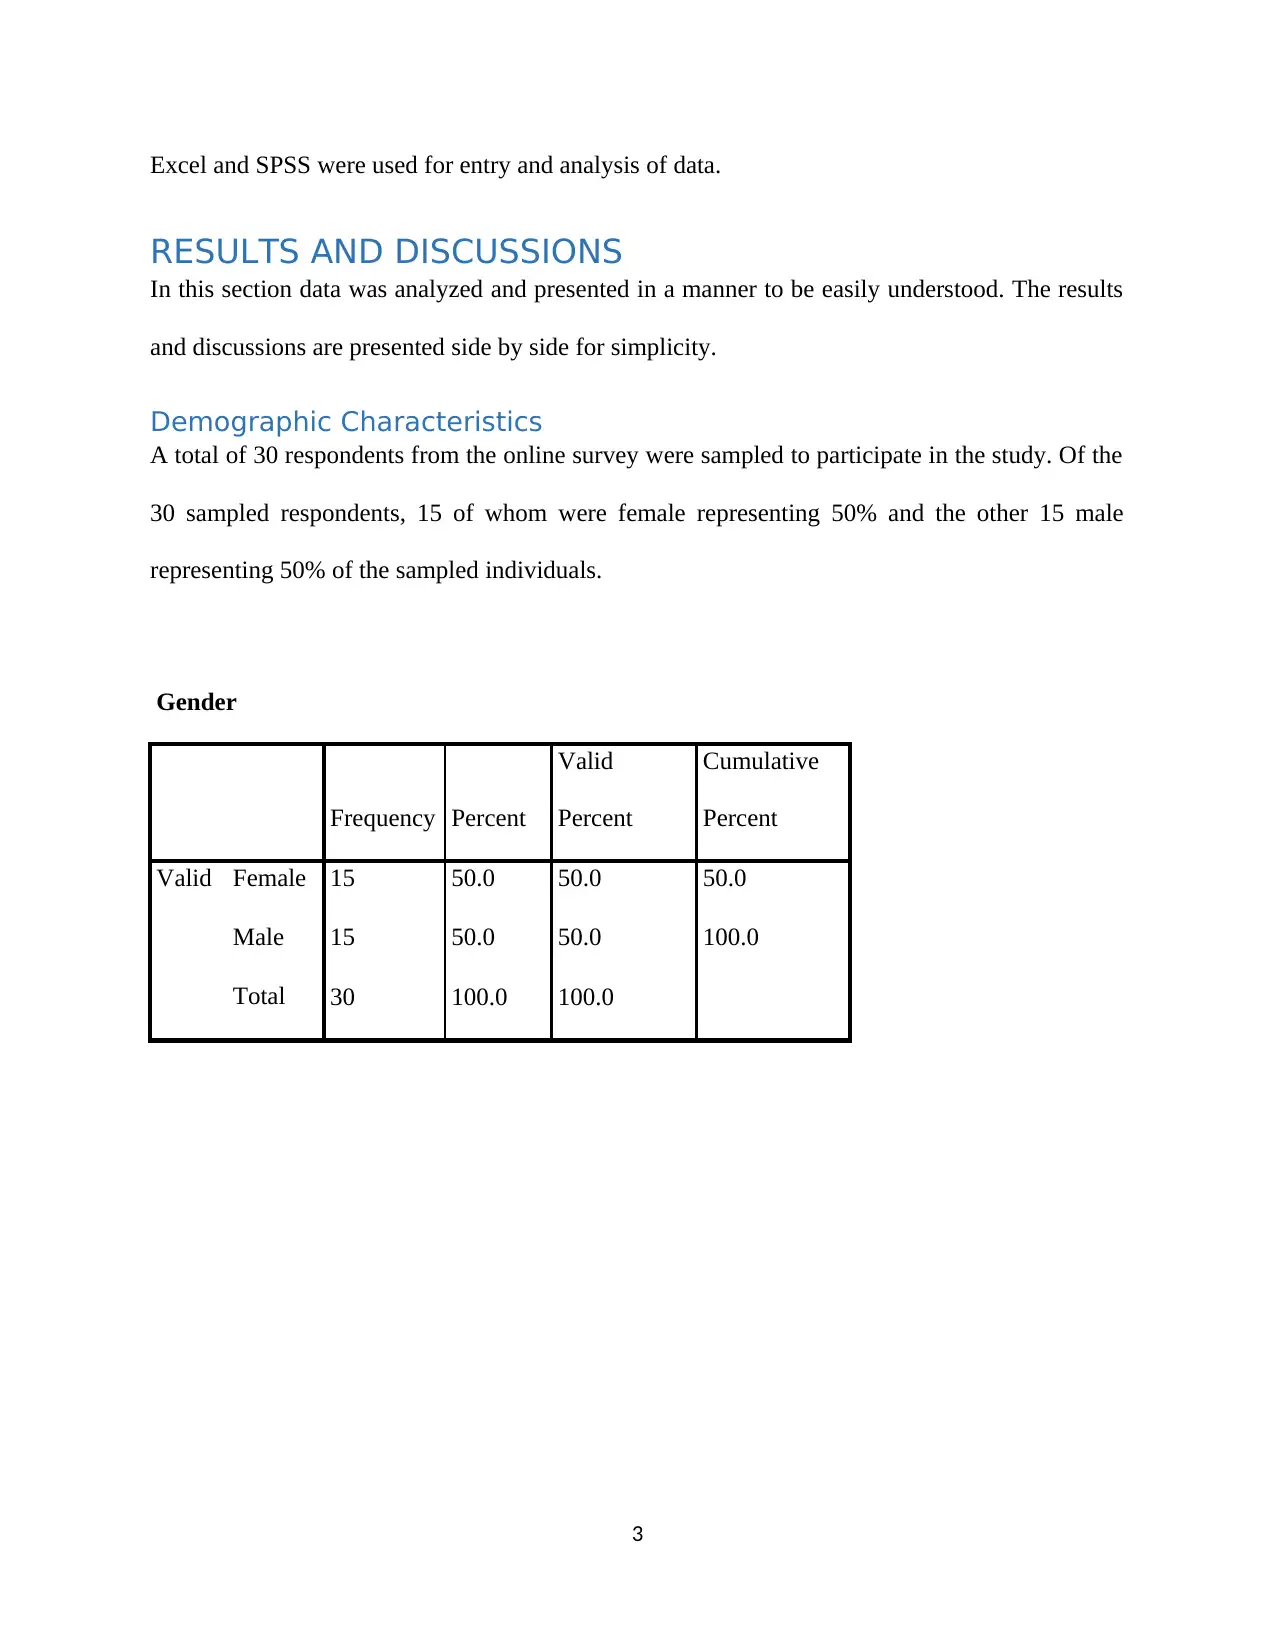
A total of 30 respondents from the online survey were sampled to participate in the study. Of the
30 sampled respondents, 15 of whom were female representing 50% and the other 15 male
representing 50% of the sampled individuals.
Gender
Frequency Percent
Valid
Percent
Cumulative
Percent
Valid Female 15 50.0 50.0 50.0
Male 15 50.0 50.0 100.0
Total 30 100.0 100.0
3
RESULTS AND DISCUSSIONS
In this section data was analyzed and presented in a manner to be easily understood. The results
and discussions are presented side by side for simplicity.
Demographic Characteristics
A total of 30 respondents from the online survey were sampled to participate in the study. Of the
30 sampled respondents, 15 of whom were female representing 50% and the other 15 male
representing 50% of the sampled individuals.
Gender
Frequency Percent
Valid
Percent
Cumulative
Percent
Valid Female 15 50.0 50.0 50.0
Male 15 50.0 50.0 100.0
Total 30 100.0 100.0
3
⊘ This is a preview!⊘
Do you want full access?
Subscribe today to unlock all pages.
Trusted by 1+ million students worldwide
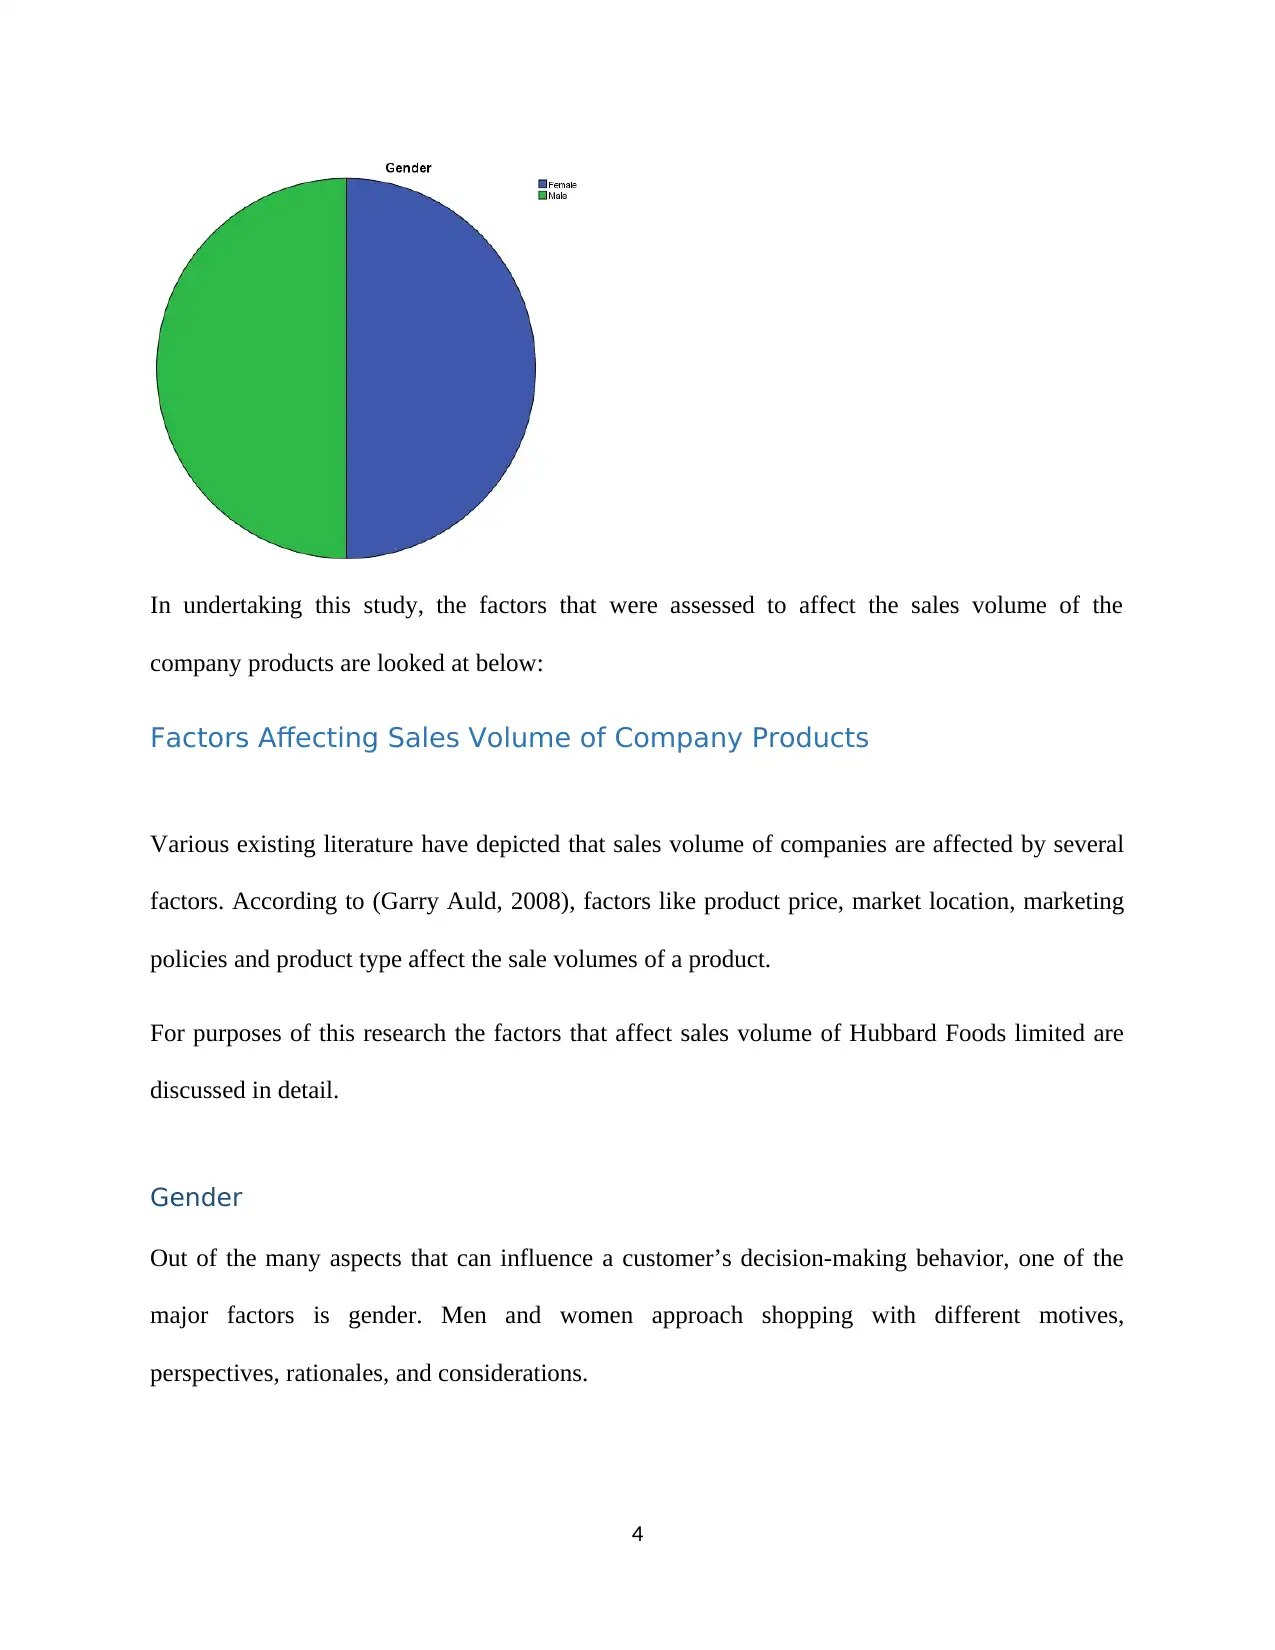
In undertaking this study, the factors that were assessed to affect the sales volume of the
company products are looked at below:
Factors Affecting Sales Volume of Company Products
Various existing literature have depicted that sales volume of companies are affected by several
factors. According to (Garry Auld, 2008), factors like product price, market location, marketing
policies and product type affect the sale volumes of a product.
For purposes of this research the factors that affect sales volume of Hubbard Foods limited are
discussed in detail.
Gender
Out of the many aspects that can influence a customer’s decision-making behavior, one of the
major factors is gender. Men and women approach shopping with different motives,
perspectives, rationales, and considerations.
4
Paraphrase This Document
Need a fresh take? Get an instant paraphrase of this document with our AI Paraphraser
There is a decade worth of scientific research on this subject, which shows that there are
observable differences in how men and women behave as shoppers. It’s clear, men and women
think differently about shopping and will approach the act of shopping online in different ways.
This could be attributed to the difference between female and male brains.
Male motives for shopping appear to be more utilitarian, that is they shop for purposes of
fulfilling needs whereas female shopping motives tend to be hedonic, that is they do shopping
because they love it.
According to (Piercy, 2002) being male or female has different effects of product preference and
frequency of purchasing products.
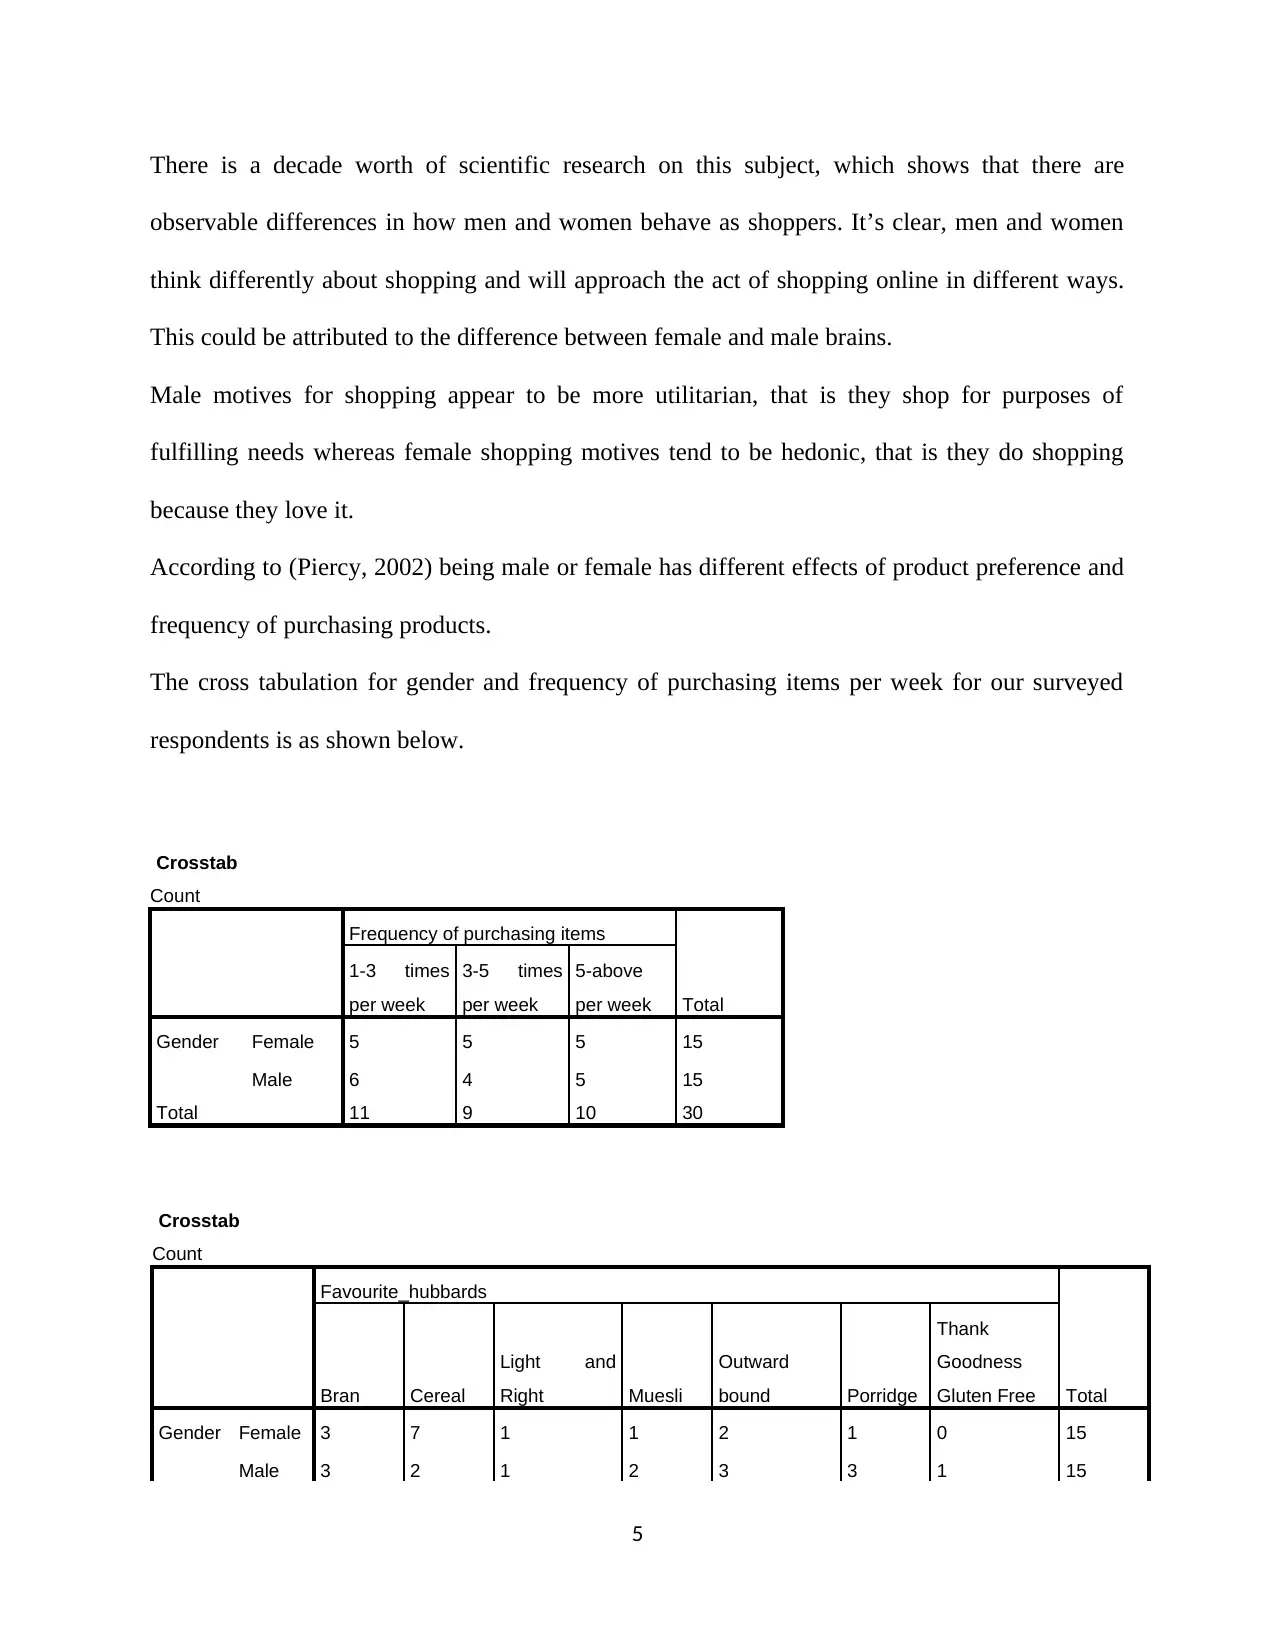
The cross tabulation for gender and frequency of purchasing items per week for our surveyed
respondents is as shown below.
Crosstab
Count
Frequency of purchasing items
Total
1-3 times
per week
3-5 times
per week
5-above
per week
Gender Female 5 5 5 15
Male 6 4 5 15
Total 11 9 10 30
Crosstab
Count
Favourite_hubbards
TotalBran Cereal
Light and
Right Muesli
Outward
bound Porridge
Thank
Goodness
Gluten Free
Gender Female 3 7 1 1 2 1 0 15
Male 3 2 1 2 3 3 1 15
5
observable differences in how men and women behave as shoppers. It’s clear, men and women
think differently about shopping and will approach the act of shopping online in different ways.
This could be attributed to the difference between female and male brains.
Male motives for shopping appear to be more utilitarian, that is they shop for purposes of
fulfilling needs whereas female shopping motives tend to be hedonic, that is they do shopping
because they love it.
According to (Piercy, 2002) being male or female has different effects of product preference and
frequency of purchasing products.
The cross tabulation for gender and frequency of purchasing items per week for our surveyed
respondents is as shown below.
Crosstab
Count
Frequency of purchasing items
Total
1-3 times
per week
3-5 times
per week
5-above
per week
Gender Female 5 5 5 15
Male 6 4 5 15
Total 11 9 10 30
Crosstab
Count
Favourite_hubbards
TotalBran Cereal
Light and
Right Muesli
Outward
bound Porridge
Thank
Goodness
Gluten Free
Gender Female 3 7 1 1 2 1 0 15
Male 3 2 1 2 3 3 1 15
5
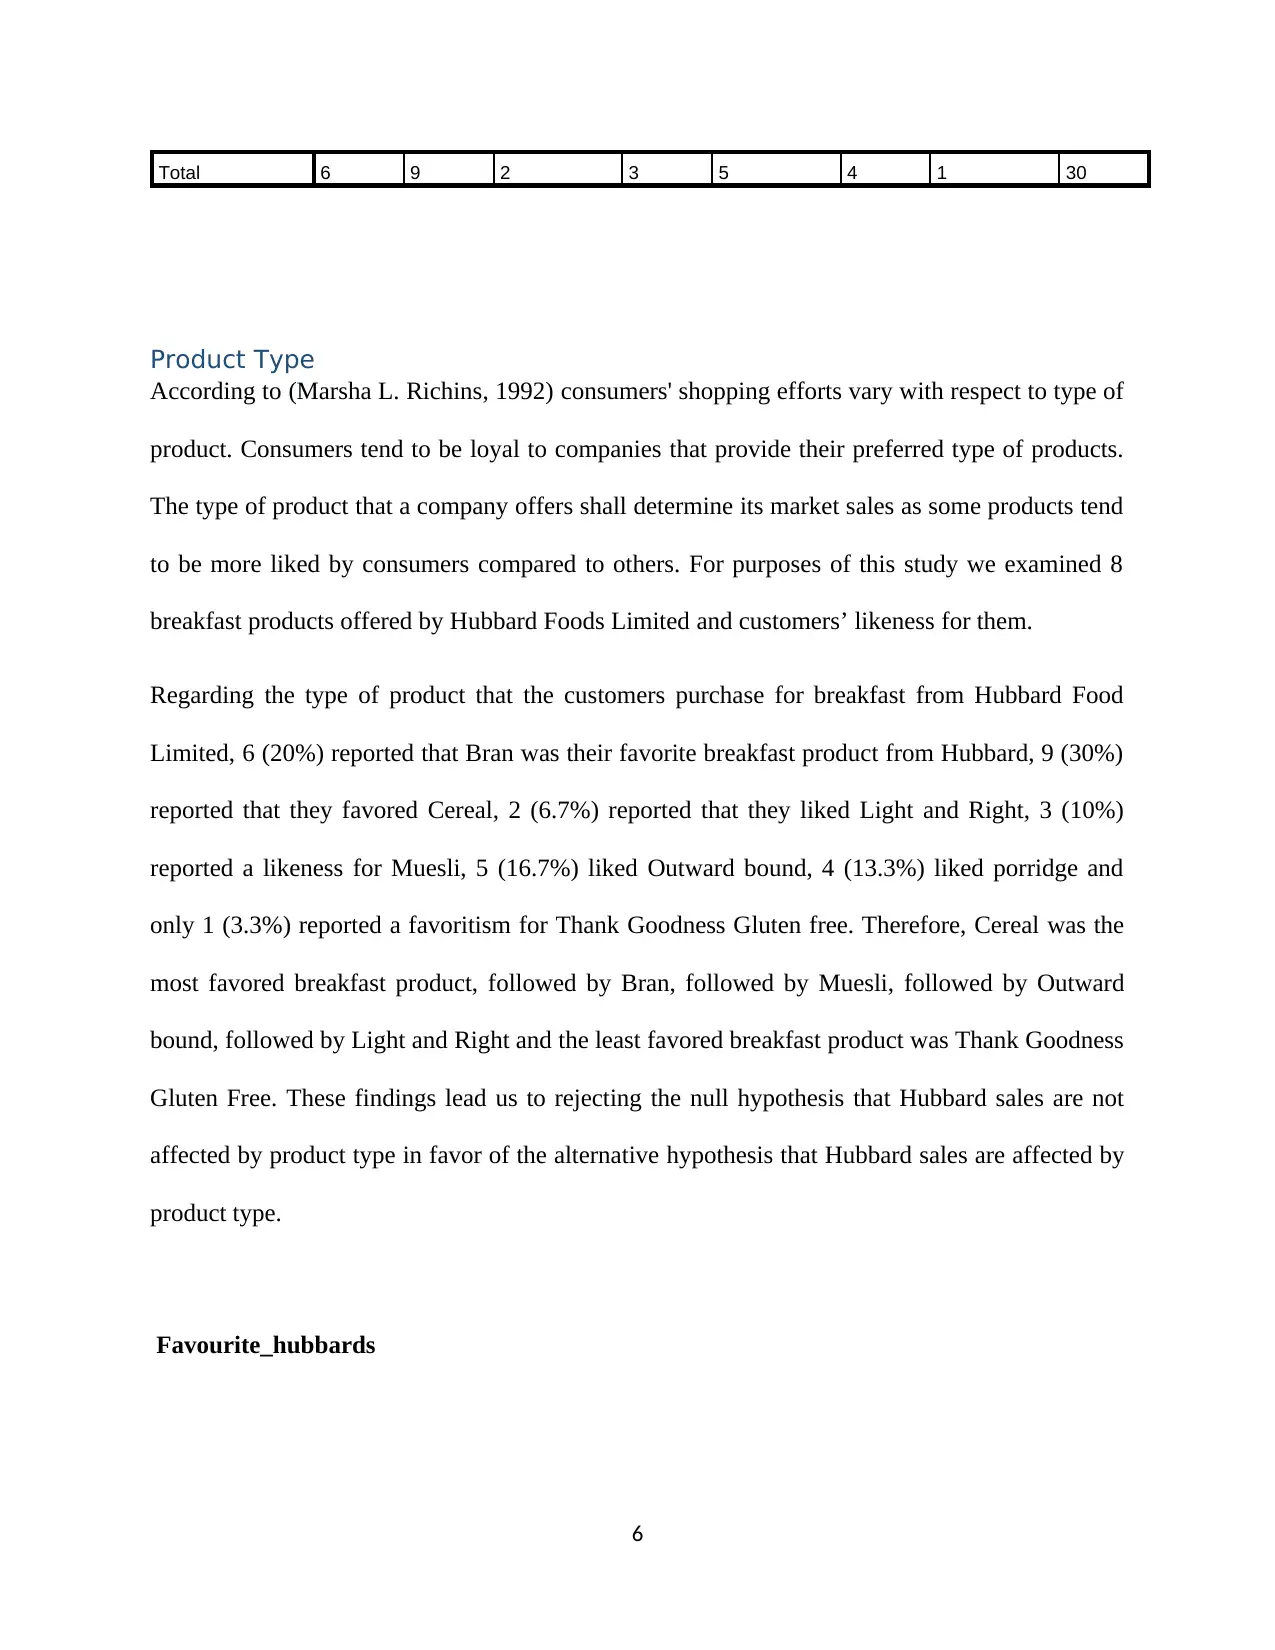
Total 6 9 2 3 5 4 1 30
Product Type
According to (Marsha L. Richins, 1992) consumers' shopping efforts vary with respect to type of
product. Consumers tend to be loyal to companies that provide their preferred type of products.
The type of product that a company offers shall determine its market sales as some products tend
to be more liked by consumers compared to others. For purposes of this study we examined 8
breakfast products offered by Hubbard Foods Limited and customers’ likeness for them.
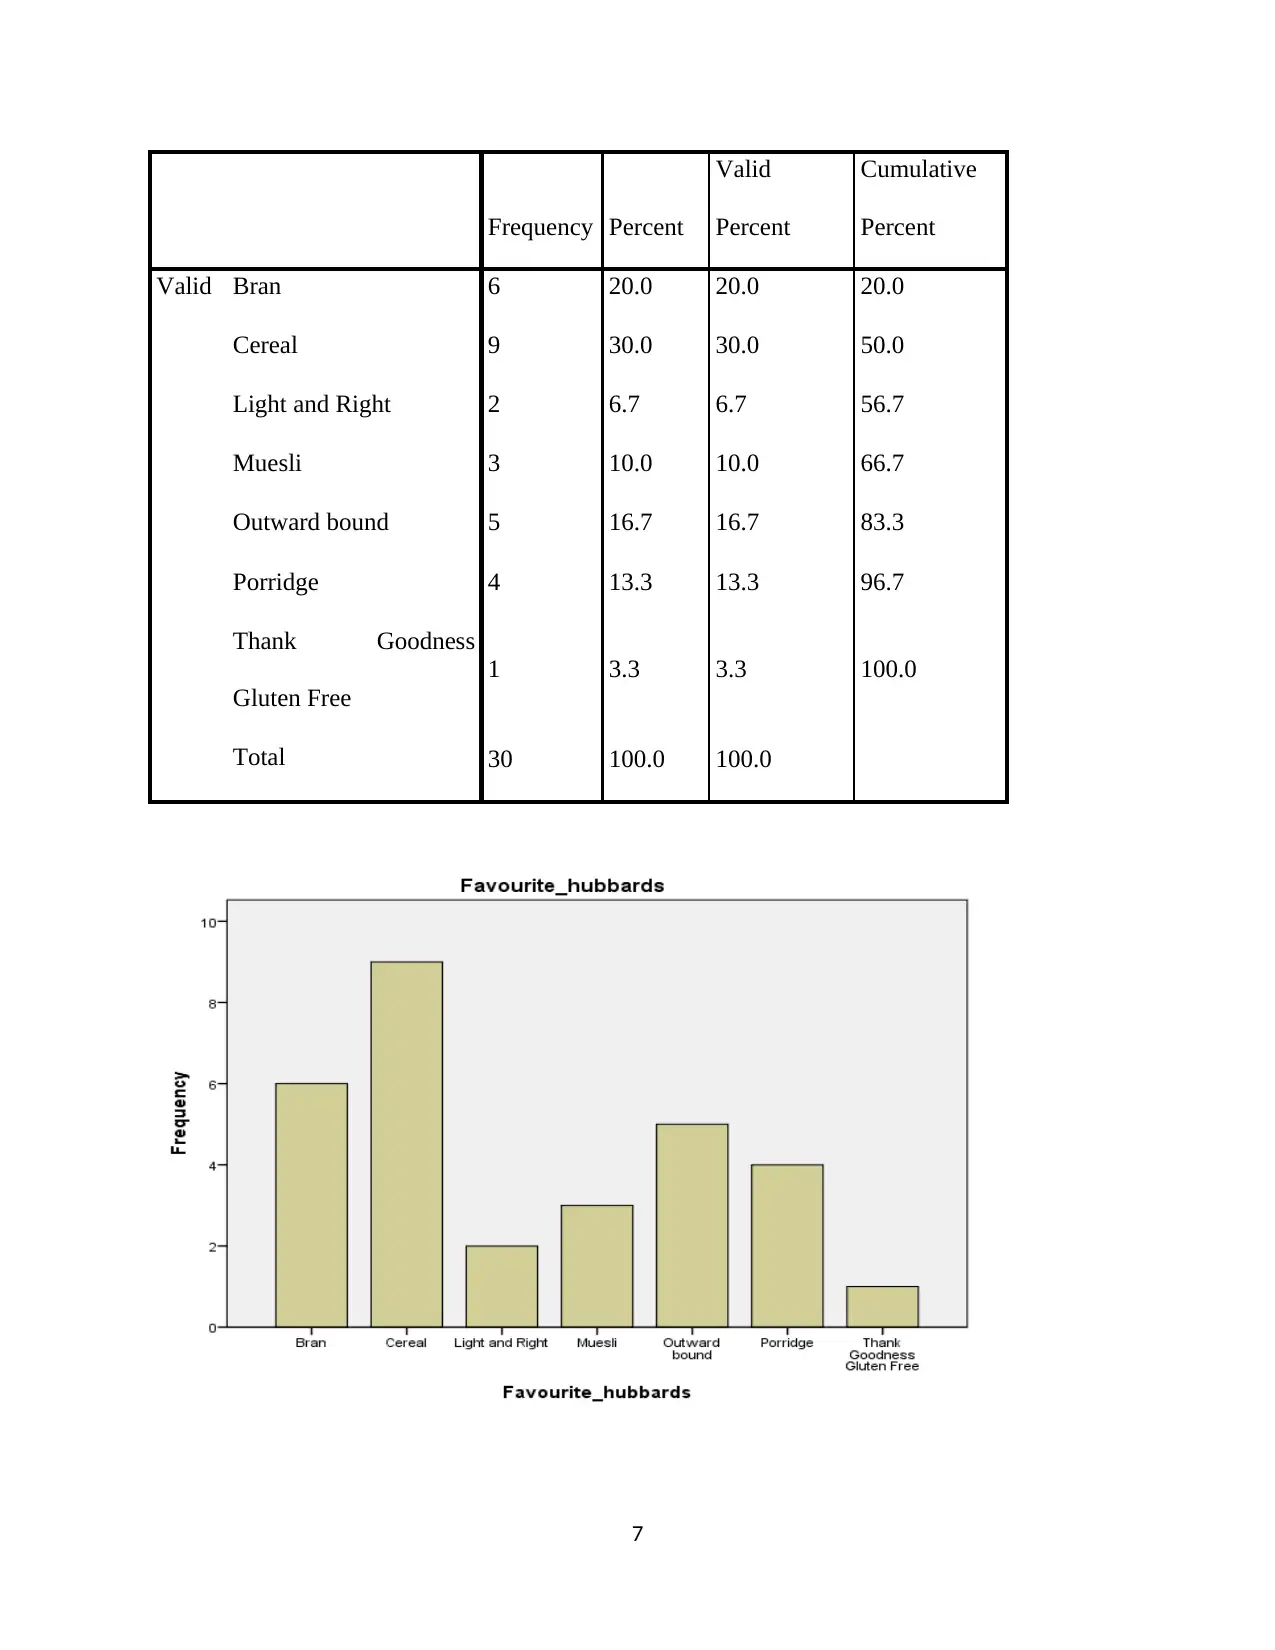
Regarding the type of product that the customers purchase for breakfast from Hubbard Food
Limited, 6 (20%) reported that Bran was their favorite breakfast product from Hubbard, 9 (30%)
reported that they favored Cereal, 2 (6.7%) reported that they liked Light and Right, 3 (10%)
reported a likeness for Muesli, 5 (16.7%) liked Outward bound, 4 (13.3%) liked porridge and
only 1 (3.3%) reported a favoritism for Thank Goodness Gluten free. Therefore, Cereal was the
most favored breakfast product, followed by Bran, followed by Muesli, followed by Outward
bound, followed by Light and Right and the least favored breakfast product was Thank Goodness
Gluten Free. These findings lead us to rejecting the null hypothesis that Hubbard sales are not
affected by product type in favor of the alternative hypothesis that Hubbard sales are affected by
product type.
Favourite_hubbards
6
Product Type
According to (Marsha L. Richins, 1992) consumers' shopping efforts vary with respect to type of
product. Consumers tend to be loyal to companies that provide their preferred type of products.
The type of product that a company offers shall determine its market sales as some products tend
to be more liked by consumers compared to others. For purposes of this study we examined 8
breakfast products offered by Hubbard Foods Limited and customers’ likeness for them.
Regarding the type of product that the customers purchase for breakfast from Hubbard Food
Limited, 6 (20%) reported that Bran was their favorite breakfast product from Hubbard, 9 (30%)
reported that they favored Cereal, 2 (6.7%) reported that they liked Light and Right, 3 (10%)
reported a likeness for Muesli, 5 (16.7%) liked Outward bound, 4 (13.3%) liked porridge and
only 1 (3.3%) reported a favoritism for Thank Goodness Gluten free. Therefore, Cereal was the
most favored breakfast product, followed by Bran, followed by Muesli, followed by Outward
bound, followed by Light and Right and the least favored breakfast product was Thank Goodness
Gluten Free. These findings lead us to rejecting the null hypothesis that Hubbard sales are not
affected by product type in favor of the alternative hypothesis that Hubbard sales are affected by
product type.
Favourite_hubbards
6
⊘ This is a preview!⊘
Do you want full access?
Subscribe today to unlock all pages.
Trusted by 1+ million students worldwide
Frequency Percent
Valid
Percent
Cumulative
Percent
Valid Bran 6 20.0 20.0 20.0
Cereal 9 30.0 30.0 50.0
Light and Right 2 6.7 6.7 56.7
Muesli 3 10.0 10.0 66.7
Outward bound 5 16.7 16.7 83.3
Porridge 4 13.3 13.3 96.7
Thank Goodness
Gluten Free
1 3.3 3.3 100.0
Total 30 100.0 100.0
7
Valid
Percent
Cumulative
Percent
Valid Bran 6 20.0 20.0 20.0
Cereal 9 30.0 30.0 50.0
Light and Right 2 6.7 6.7 56.7
Muesli 3 10.0 10.0 66.7
Outward bound 5 16.7 16.7 83.3
Porridge 4 13.3 13.3 96.7
Thank Goodness
Gluten Free
1 3.3 3.3 100.0
Total 30 100.0 100.0
7
Paraphrase This Document
Need a fresh take? Get an instant paraphrase of this document with our AI Paraphraser
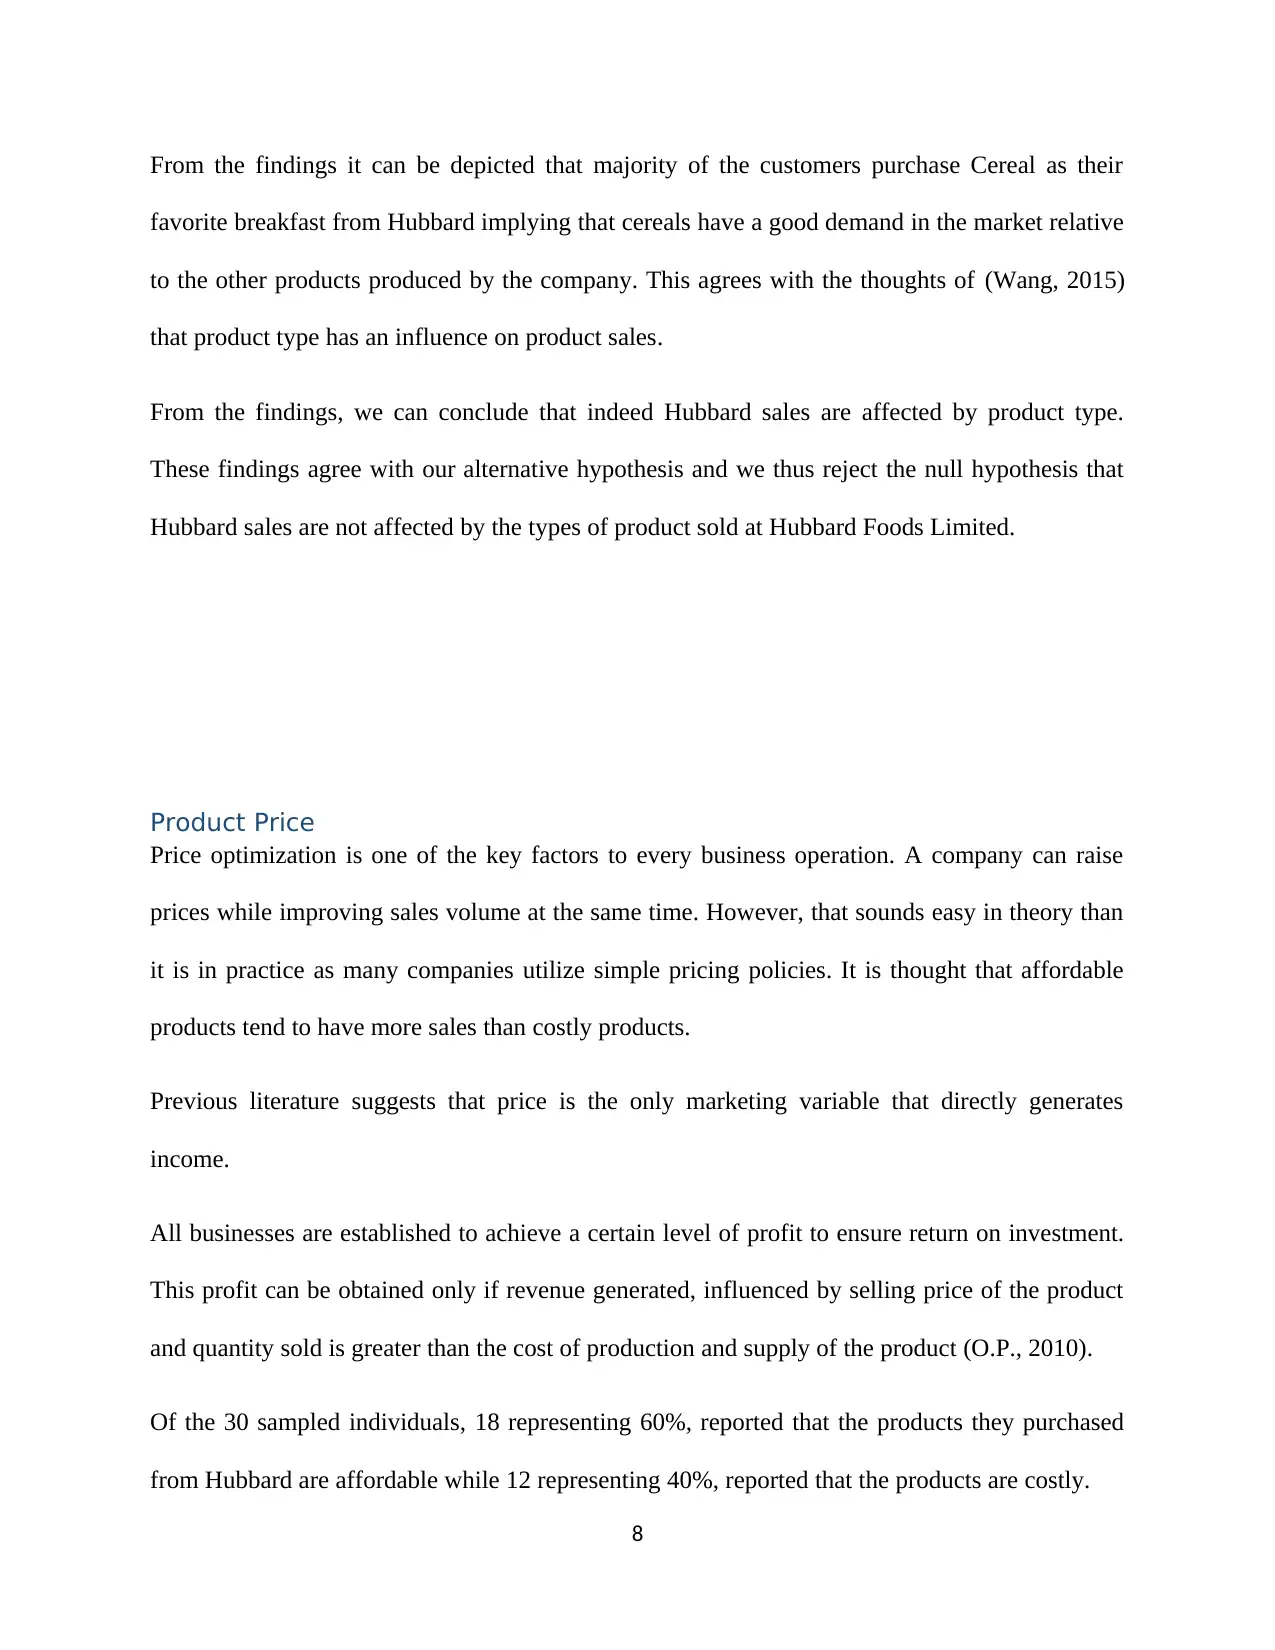
From the findings it can be depicted that majority of the customers purchase Cereal as their
favorite breakfast from Hubbard implying that cereals have a good demand in the market relative
to the other products produced by the company. This agrees with the thoughts of (Wang, 2015)
that product type has an influence on product sales.
From the findings, we can conclude that indeed Hubbard sales are affected by product type.
These findings agree with our alternative hypothesis and we thus reject the null hypothesis that
Hubbard sales are not affected by the types of product sold at Hubbard Foods Limited.
Product Price
Price optimization is one of the key factors to every business operation. A company can raise
prices while improving sales volume at the same time. However, that sounds easy in theory than
it is in practice as many companies utilize simple pricing policies. It is thought that affordable
products tend to have more sales than costly products.
Previous literature suggests that price is the only marketing variable that directly generates
income.
All businesses are established to achieve a certain level of profit to ensure return on investment.
This profit can be obtained only if revenue generated, influenced by selling price of the product
and quantity sold is greater than the cost of production and supply of the product (O.P., 2010).
Of the 30 sampled individuals, 18 representing 60%, reported that the products they purchased
from Hubbard are affordable while 12 representing 40%, reported that the products are costly.
8
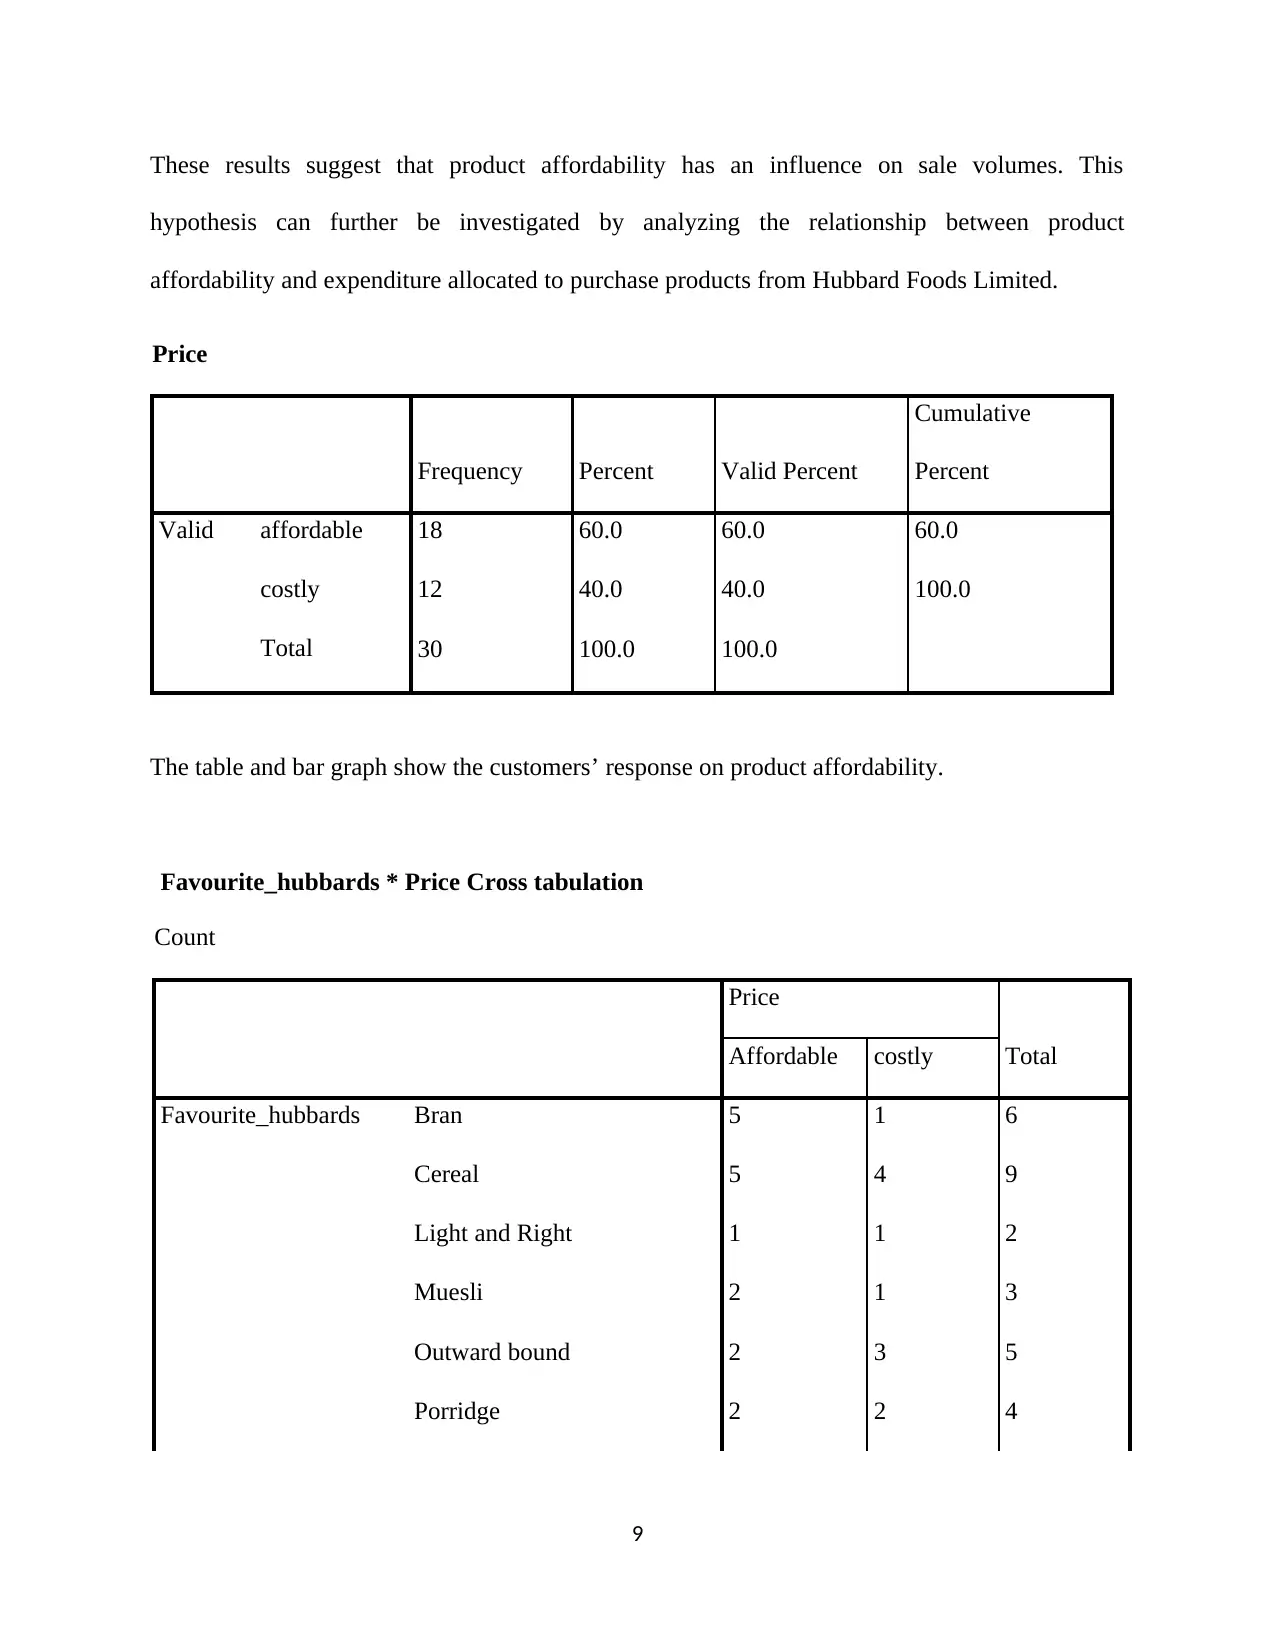
These results suggest that product affordability has an influence on sale volumes. This
hypothesis can further be investigated by analyzing the relationship between product
affordability and expenditure allocated to purchase products from Hubbard Foods Limited.
Price
Frequency Percent Valid Percent
Cumulative
Percent
Valid affordable 18 60.0 60.0 60.0
costly 12 40.0 40.0 100.0
Total 30 100.0 100.0
The table and bar graph show the customers’ response on product affordability.
Favourite_hubbards * Price Cross tabulation
Count
Price
TotalAffordable costly
Favourite_hubbards Bran 5 1 6
Cereal 5 4 9
Light and Right 1 1 2
Muesli 2 1 3
Outward bound 2 3 5
Porridge 2 2 4
9
⊘ This is a preview!⊘
Do you want full access?
Subscribe today to unlock all pages.
Trusted by 1+ million students worldwide
1 out of 34
Related Documents


Your All-in-One AI-Powered Toolkit for Academic Success.
+13062052269
info@desklib.com
Available 24*7 on WhatsApp / Email
![[object Object]](/_next/static/media/star-bottom.7253800d.svg)
Unlock your academic potential
Copyright © 2020–2026 A2Z Services. All Rights Reserved. Developed and managed by ZUCOL.