Statistical Analysis: Comparing Sample and Population BMI in Australia
VerifiedAdded on 2022/11/14
|10
|2738
|59
Homework Assignment
AI Summary
This assignment analyzes the body mass index (BMI) of Australian male adults, comparing a sample mean to the population mean. The study aims to determine if there is a significant difference between the two. The methodology involves collecting numerical data from a sample of 10 male individuals, calculating their BMI based on height and weight, and employing a t-test to test the hypothesis. The null hypothesis states that the sample mean BMI is equal to the population mean BMI. The results of the t-test indicate that the sample mean is not significantly different from the population mean, leading to a failure to reject the null hypothesis. The report discusses the implications of these findings, highlighting that the sample BMI of 26.7 kg/m2, which falls in the overweight category, aligns with the population mean of 27.2 kg/m2. It explores factors contributing to overweight and obesity in Australia, including lifestyle, socioeconomic factors, and geographical variations. The conclusion reinforces that the sample accurately represents the population, with most Australian males being overweight. The report also discusses potential type I and type II errors in hypothesis testing.
The comparison of sample and population mean difference in the body mass index (BMI) of male adults in
Australia
Introduction
Each and every country in the world have been striving to ensure that its citizens lead healthy
lives free from any sort of diseases such as cancer, polio, diabetes and not limited to obesity
among other diseases. Obesity is a worldwide health concern both in the developed countries like
Australia and developing countries. Obesity has been associated with excessive deposition of fats
in the body by the medics and health experts (Wang et al, 2015). It (obesity) has been as well
defined as over-accumulation of fats in the body (Ogden et al, 2015). In America, nearly 40% of
the Americans were suffering from obesity. Australia in particular among other countries across
the globe have been at the forefront in fight to reduce the rate of overweight and obesity increase
among its citizens. The country had shown the endless efforts of reducing obesity through
proposing dietary guidelines to its citizens in order for them to maintain healthy body weight
(NHMRC, 2013). In addition to that, Australian government through the Ministry of health
encourage its citizens to adhere to the diet consistent with that proposed by the government
through its health experts.
Overweight or obesity is as a result of imbalance of energy in the body through intake of either
drinks or eating rich energy content foods than the amount of energy required by the body for its
daily activities (AIHW, 2016a). From reports and statistics, Australia have had in the recent past
mean height of 175.6 cm for adult males and 161.8cm for adult females. Since weight goes hand
in hand with the height, the mean weight of both genders in the country was reported to be
85.9kg and 71.1kg for adult males and adult females respectively. Applying these values in
Paraphrase This Document
Need a fresh take? Get an instant paraphrase of this document with our AI Paraphraser
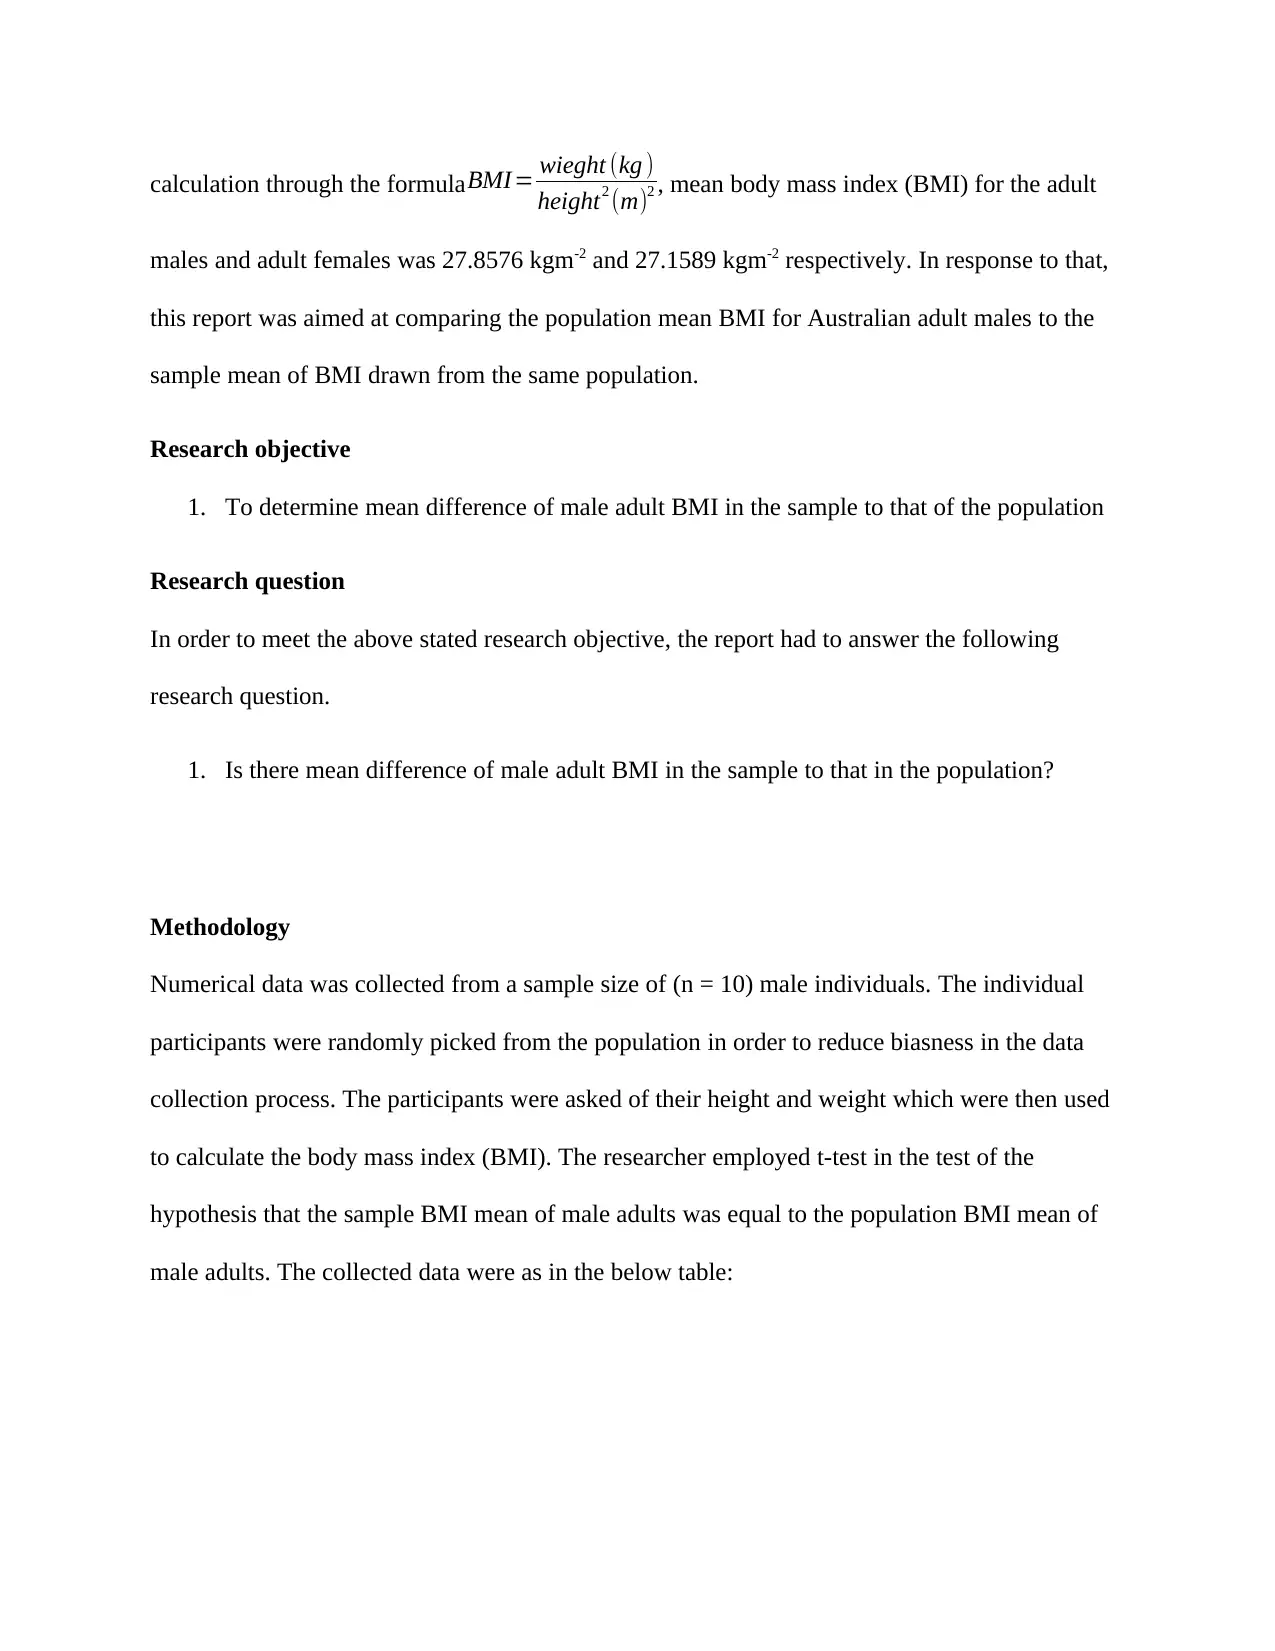
calculation through the formulaBMI = wieght (kg )
height2 (m)2 , mean body mass index (BMI) for the adult
males and adult females was 27.8576 kgm-2 and 27.1589 kgm-2 respectively. In response to that,
this report was aimed at comparing the population mean BMI for Australian adult males to the
sample mean of BMI drawn from the same population.
Research objective
1. To determine mean difference of male adult BMI in the sample to that of the population
Research question
In order to meet the above stated research objective, the report had to answer the following
research question.
1. Is there mean difference of male adult BMI in the sample to that in the population?
Methodology
Numerical data was collected from a sample size of (n = 10) male individuals. The individual
participants were randomly picked from the population in order to reduce biasness in the data
collection process. The participants were asked of their height and weight which were then used
to calculate the body mass index (BMI). The researcher employed t-test in the test of the
hypothesis that the sample BMI mean of male adults was equal to the population BMI mean of
male adults. The collected data were as in the below table:
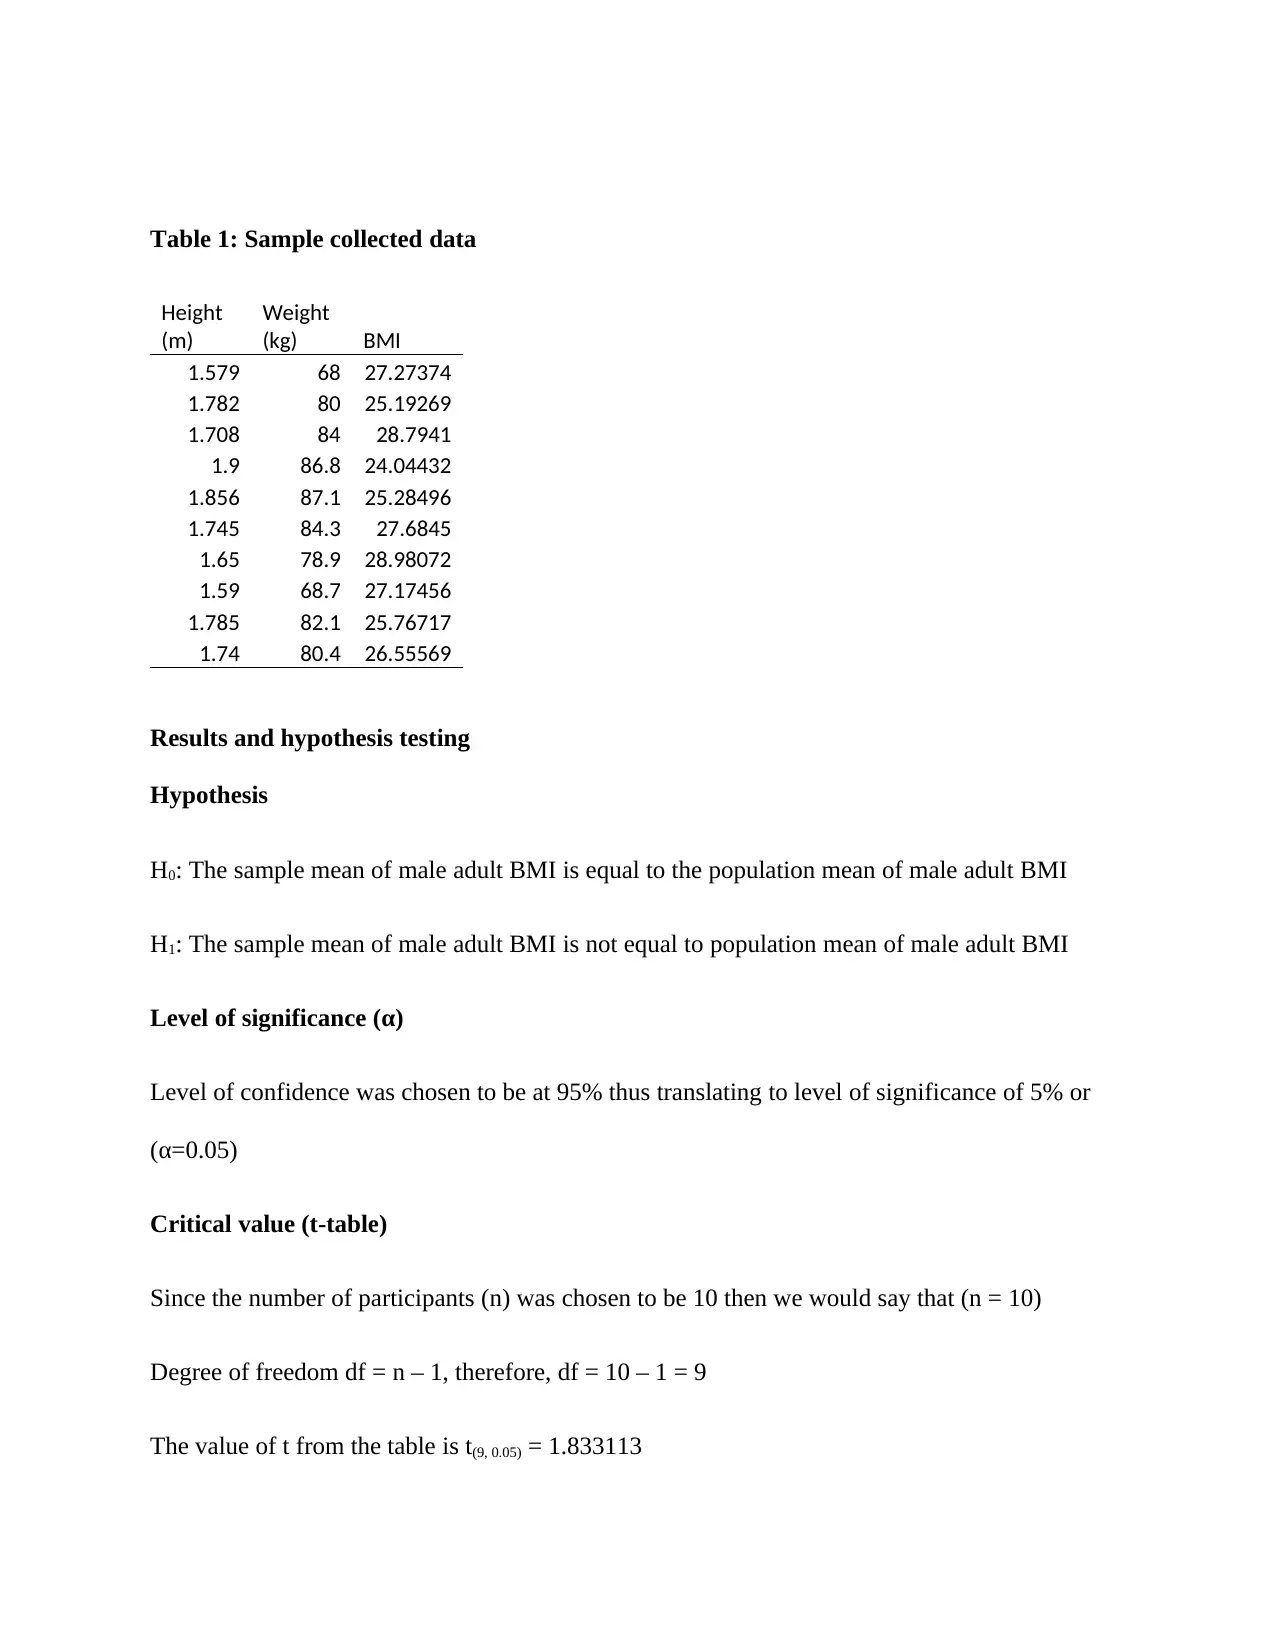
Table 1: Sample collected data
Height
(m)
Weight
(kg) BMI
1.579 68 27.27374
1.782 80 25.19269
1.708 84 28.7941
1.9 86.8 24.04432
1.856 87.1 25.28496
1.745 84.3 27.6845
1.65 78.9 28.98072
1.59 68.7 27.17456
1.785 82.1 25.76717
1.74 80.4 26.55569
Results and hypothesis testing
Hypothesis
H0: The sample mean of male adult BMI is equal to the population mean of male adult BMI
H1: The sample mean of male adult BMI is not equal to population mean of male adult BMI
Level of significance (α)
Level of confidence was chosen to be at 95% thus translating to level of significance of 5% or
(α=0.05)
Critical value (t-table)
Since the number of participants (n) was chosen to be 10 then we would say that (n = 10)
Degree of freedom df = n – 1, therefore, df = 10 – 1 = 9
The value of t from the table is t(9, 0.05) = 1.833113
⊘ This is a preview!⊘
Do you want full access?
Subscribe today to unlock all pages.
Trusted by 1+ million students worldwide
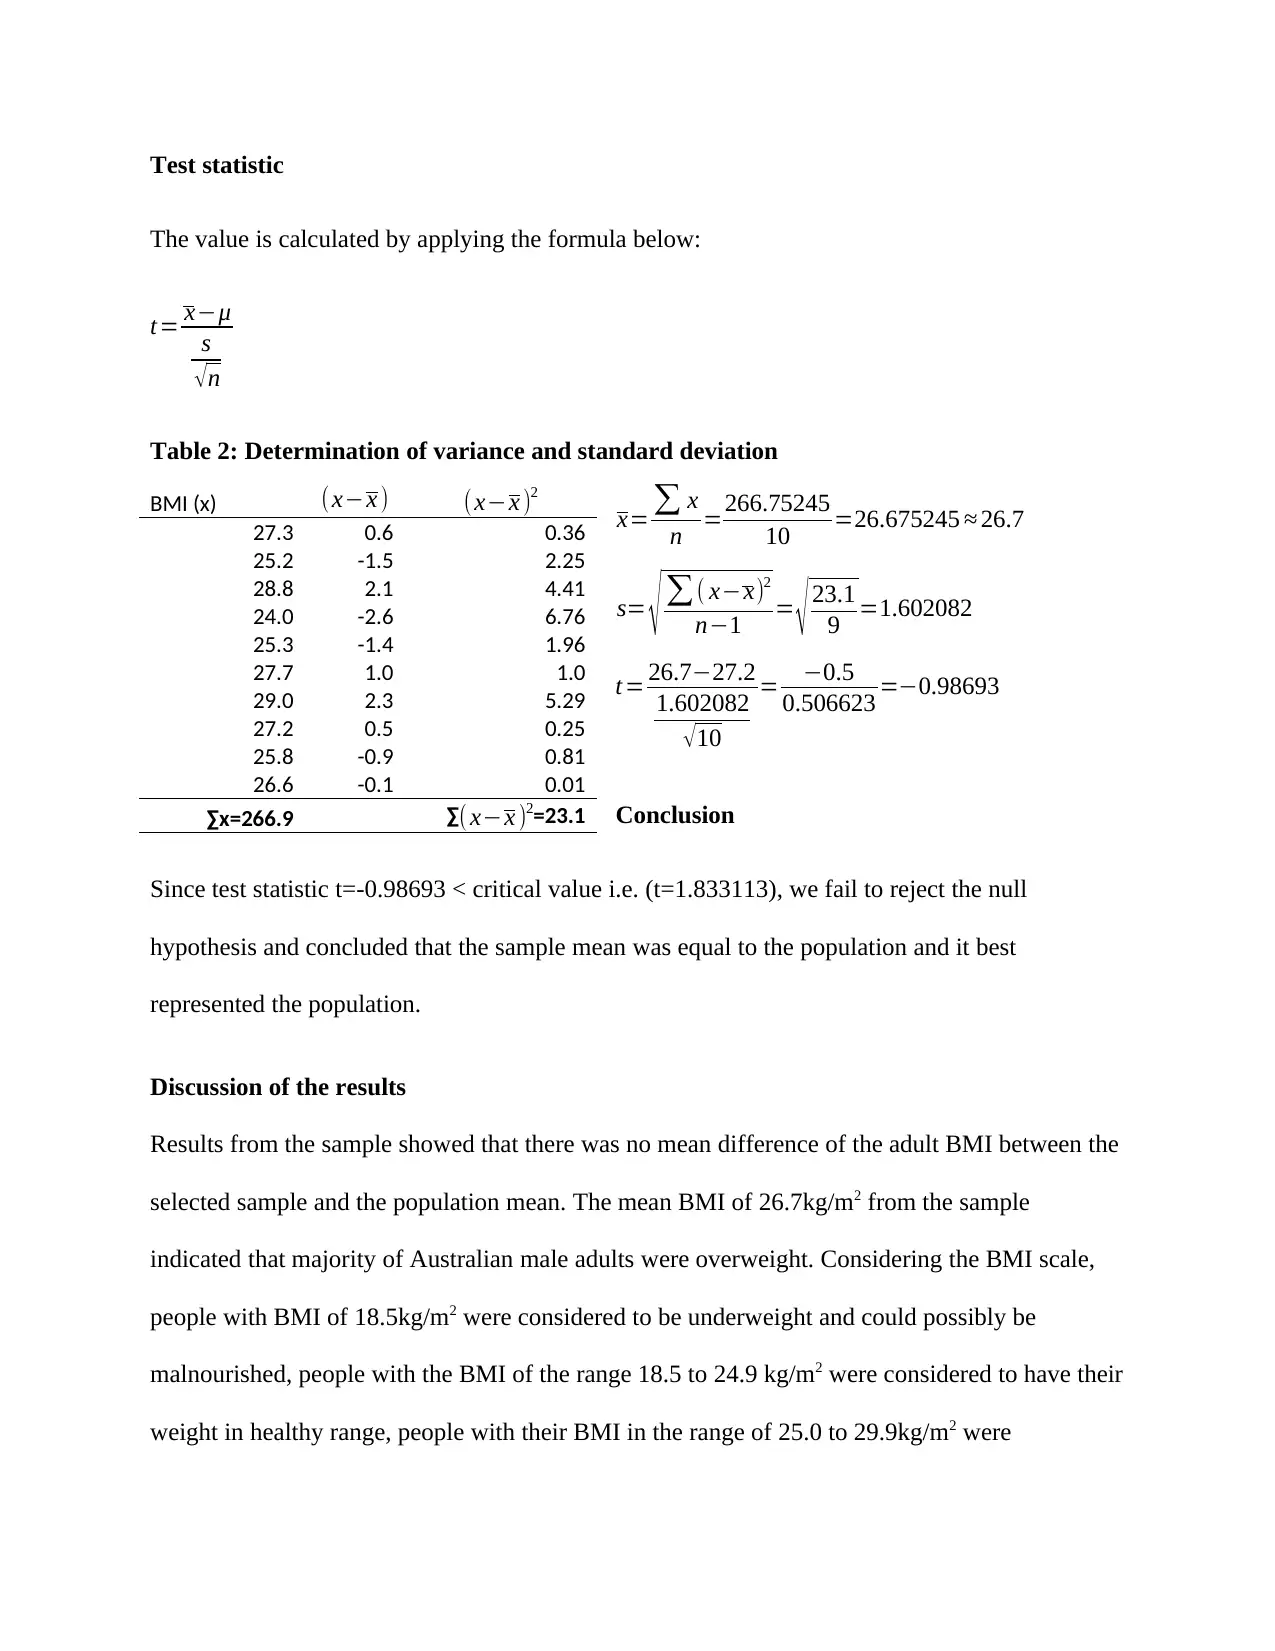
Test statistic
The value is calculated by applying the formula below:
t= x−μ
s
√ n
Table 2: Determination of variance and standard deviation
x= ∑ x
n =266.75245
10 =26.675245 ≈ 26.7
s= √ ∑( x−x)2
n−1 = √ 23.1
9 =1.602082
t= 26.7−27.2
1.602082
√10
= −0.5
0.506623 =−0.98693
Conclusion
Since test statistic t=-0.98693 < critical value i.e. (t=1.833113), we fail to reject the null
hypothesis and concluded that the sample mean was equal to the population and it best
represented the population.
Discussion of the results
Results from the sample showed that there was no mean difference of the adult BMI between the
selected sample and the population mean. The mean BMI of 26.7kg/m2 from the sample
indicated that majority of Australian male adults were overweight. Considering the BMI scale,
people with BMI of 18.5kg/m2 were considered to be underweight and could possibly be
malnourished, people with the BMI of the range 18.5 to 24.9 kg/m2 were considered to have their
weight in healthy range, people with their BMI in the range of 25.0 to 29.9kg/m2 were
BMI (x) (x−x ) (x−x )2
27.3 0.6 0.36
25.2 -1.5 2.25
28.8 2.1 4.41
24.0 -2.6 6.76
25.3 -1.4 1.96
27.7 1.0 1.0
29.0 2.3 5.29
27.2 0.5 0.25
25.8 -0.9 0.81
26.6 -0.1 0.01
∑x=266.9 ∑( x−x )2=23.1
Paraphrase This Document
Need a fresh take? Get an instant paraphrase of this document with our AI Paraphraser
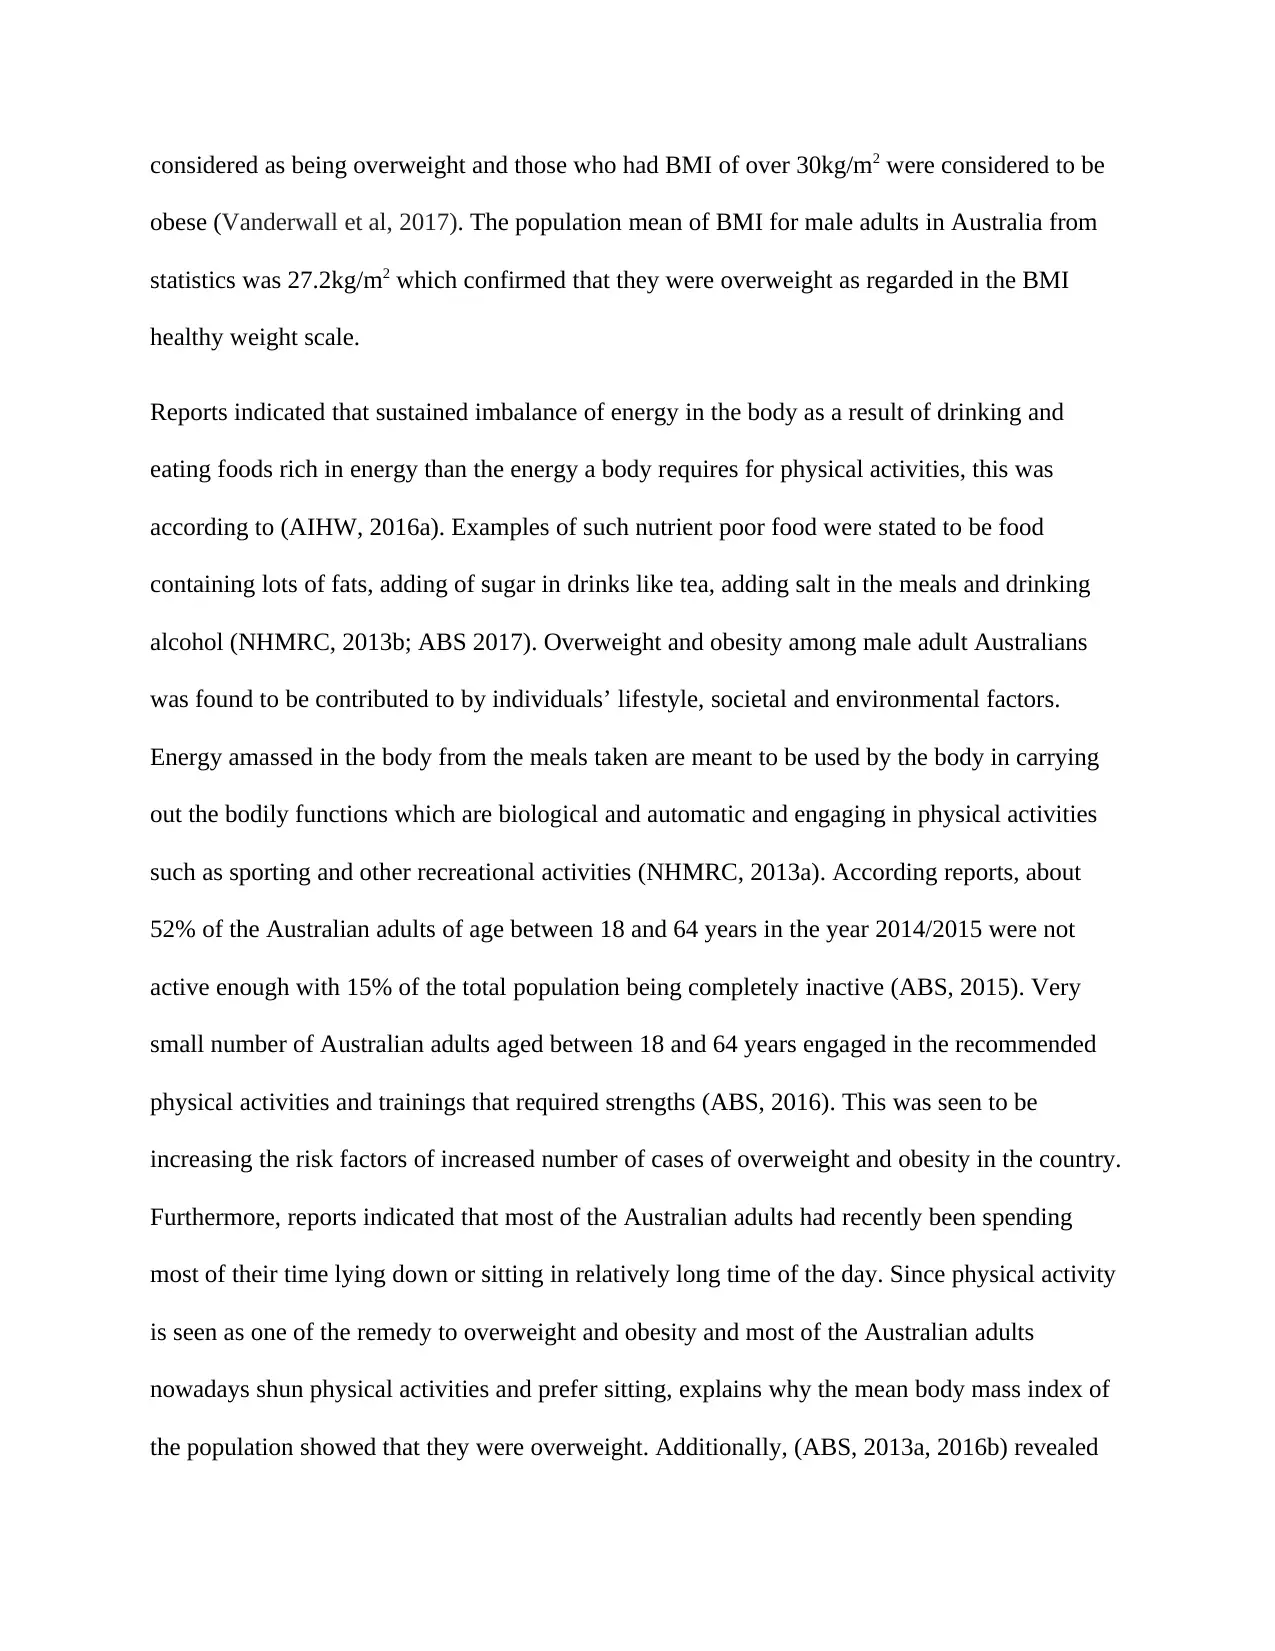
considered as being overweight and those who had BMI of over 30kg/m2 were considered to be
obese (Vanderwall et al, 2017). The population mean of BMI for male adults in Australia from
statistics was 27.2kg/m2 which confirmed that they were overweight as regarded in the BMI
healthy weight scale.
Reports indicated that sustained imbalance of energy in the body as a result of drinking and
eating foods rich in energy than the energy a body requires for physical activities, this was
according to (AIHW, 2016a). Examples of such nutrient poor food were stated to be food
containing lots of fats, adding of sugar in drinks like tea, adding salt in the meals and drinking
alcohol (NHMRC, 2013b; ABS 2017). Overweight and obesity among male adult Australians
was found to be contributed to by individuals’ lifestyle, societal and environmental factors.
Energy amassed in the body from the meals taken are meant to be used by the body in carrying
out the bodily functions which are biological and automatic and engaging in physical activities
such as sporting and other recreational activities (NHMRC, 2013a). According reports, about
52% of the Australian adults of age between 18 and 64 years in the year 2014/2015 were not
active enough with 15% of the total population being completely inactive (ABS, 2015). Very
small number of Australian adults aged between 18 and 64 years engaged in the recommended
physical activities and trainings that required strengths (ABS, 2016). This was seen to be
increasing the risk factors of increased number of cases of overweight and obesity in the country.
Furthermore, reports indicated that most of the Australian adults had recently been spending
most of their time lying down or sitting in relatively long time of the day. Since physical activity
is seen as one of the remedy to overweight and obesity and most of the Australian adults
nowadays shun physical activities and prefer sitting, explains why the mean body mass index of
the population showed that they were overweight. Additionally, (ABS, 2013a, 2016b) revealed
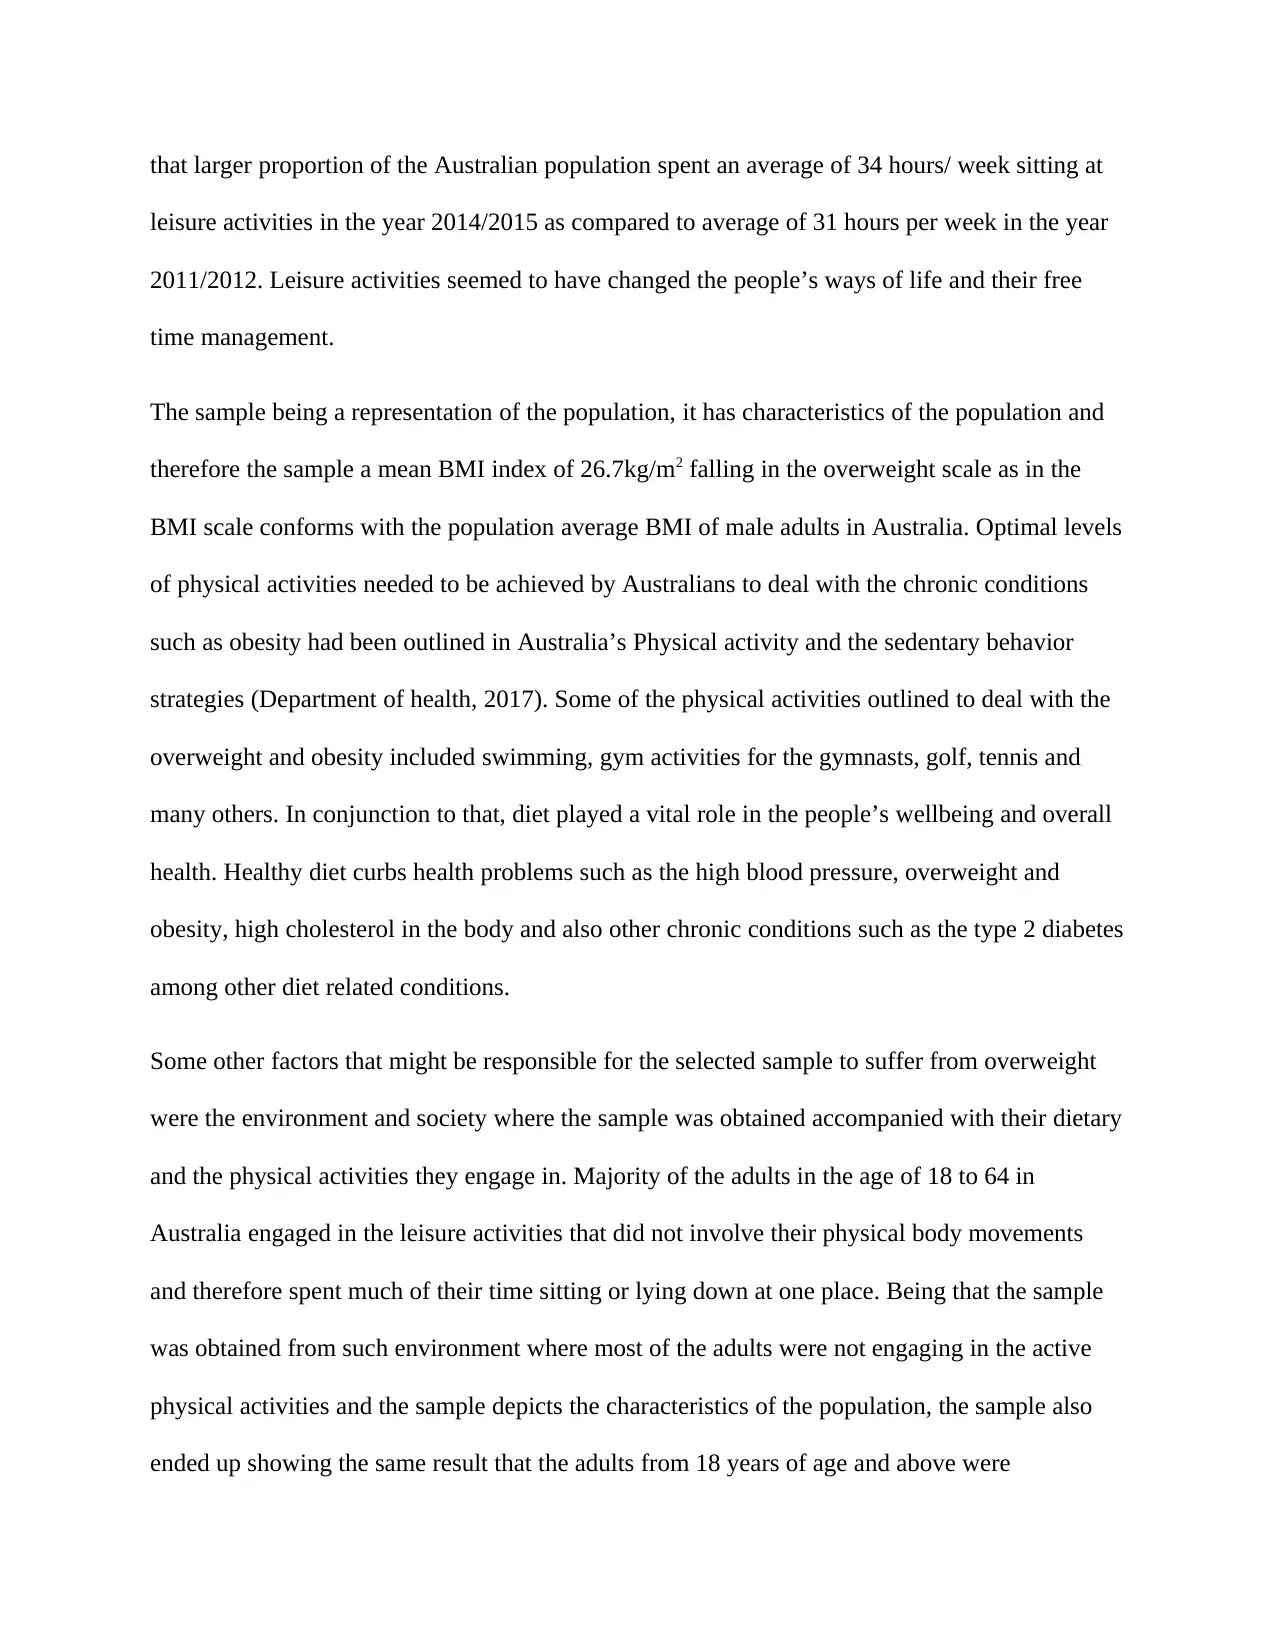
that larger proportion of the Australian population spent an average of 34 hours/ week sitting at
leisure activities in the year 2014/2015 as compared to average of 31 hours per week in the year
2011/2012. Leisure activities seemed to have changed the people’s ways of life and their free
time management.
The sample being a representation of the population, it has characteristics of the population and
therefore the sample a mean BMI index of 26.7kg/m2 falling in the overweight scale as in the
BMI scale conforms with the population average BMI of male adults in Australia. Optimal levels
of physical activities needed to be achieved by Australians to deal with the chronic conditions
such as obesity had been outlined in Australia’s Physical activity and the sedentary behavior
strategies (Department of health, 2017). Some of the physical activities outlined to deal with the
overweight and obesity included swimming, gym activities for the gymnasts, golf, tennis and
many others. In conjunction to that, diet played a vital role in the people’s wellbeing and overall
health. Healthy diet curbs health problems such as the high blood pressure, overweight and
obesity, high cholesterol in the body and also other chronic conditions such as the type 2 diabetes
among other diet related conditions.
Some other factors that might be responsible for the selected sample to suffer from overweight
were the environment and society where the sample was obtained accompanied with their dietary
and the physical activities they engage in. Majority of the adults in the age of 18 to 64 in
Australia engaged in the leisure activities that did not involve their physical body movements
and therefore spent much of their time sitting or lying down at one place. Being that the sample
was obtained from such environment where most of the adults were not engaging in the active
physical activities and the sample depicts the characteristics of the population, the sample also
ended up showing the same result that the adults from 18 years of age and above were
⊘ This is a preview!⊘
Do you want full access?
Subscribe today to unlock all pages.
Trusted by 1+ million students worldwide
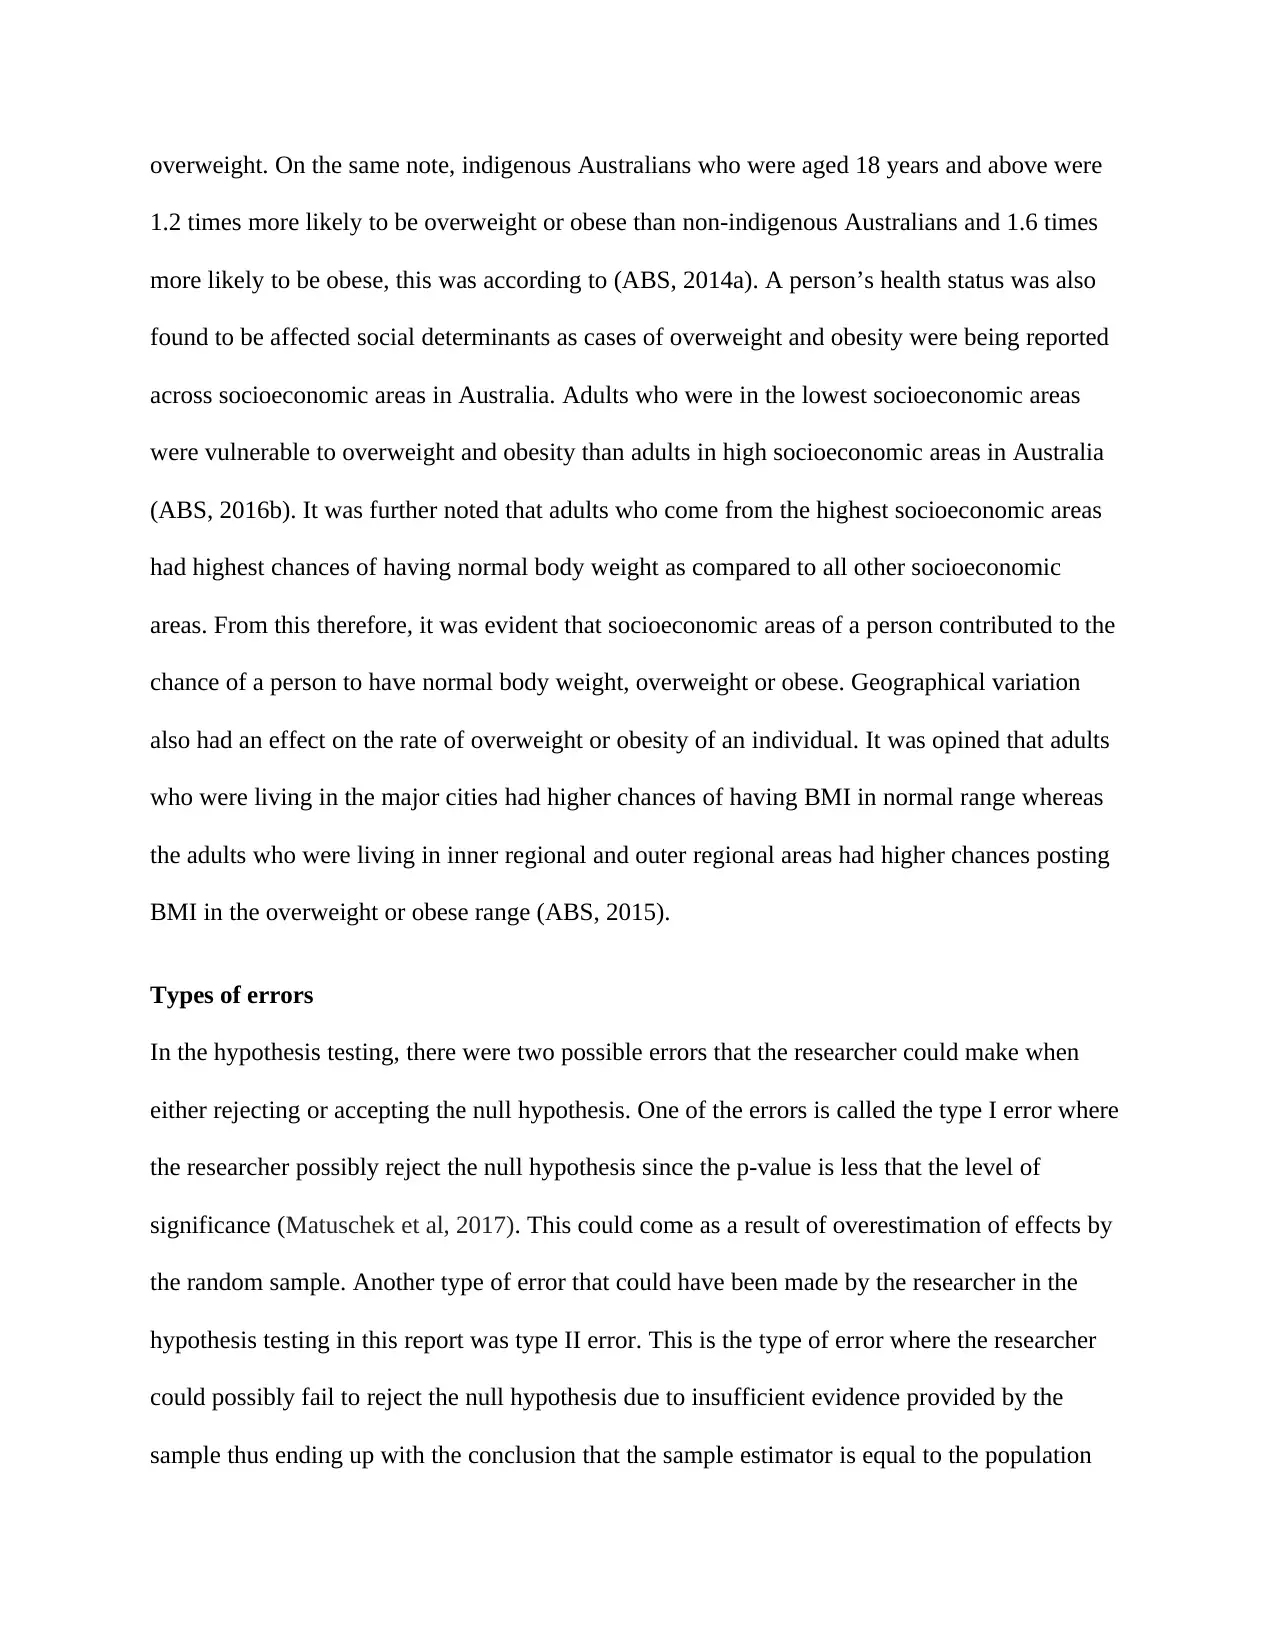
overweight. On the same note, indigenous Australians who were aged 18 years and above were
1.2 times more likely to be overweight or obese than non-indigenous Australians and 1.6 times
more likely to be obese, this was according to (ABS, 2014a). A person’s health status was also
found to be affected social determinants as cases of overweight and obesity were being reported
across socioeconomic areas in Australia. Adults who were in the lowest socioeconomic areas
were vulnerable to overweight and obesity than adults in high socioeconomic areas in Australia
(ABS, 2016b). It was further noted that adults who come from the highest socioeconomic areas
had highest chances of having normal body weight as compared to all other socioeconomic
areas. From this therefore, it was evident that socioeconomic areas of a person contributed to the
chance of a person to have normal body weight, overweight or obese. Geographical variation
also had an effect on the rate of overweight or obesity of an individual. It was opined that adults
who were living in the major cities had higher chances of having BMI in normal range whereas
the adults who were living in inner regional and outer regional areas had higher chances posting
BMI in the overweight or obese range (ABS, 2015).
Types of errors
In the hypothesis testing, there were two possible errors that the researcher could make when
either rejecting or accepting the null hypothesis. One of the errors is called the type I error where
the researcher possibly reject the null hypothesis since the p-value is less that the level of
significance (Matuschek et al, 2017). This could come as a result of overestimation of effects by
the random sample. Another type of error that could have been made by the researcher in the
hypothesis testing in this report was type II error. This is the type of error where the researcher
could possibly fail to reject the null hypothesis due to insufficient evidence provided by the
sample thus ending up with the conclusion that the sample estimator is equal to the population
Paraphrase This Document
Need a fresh take? Get an instant paraphrase of this document with our AI Paraphraser
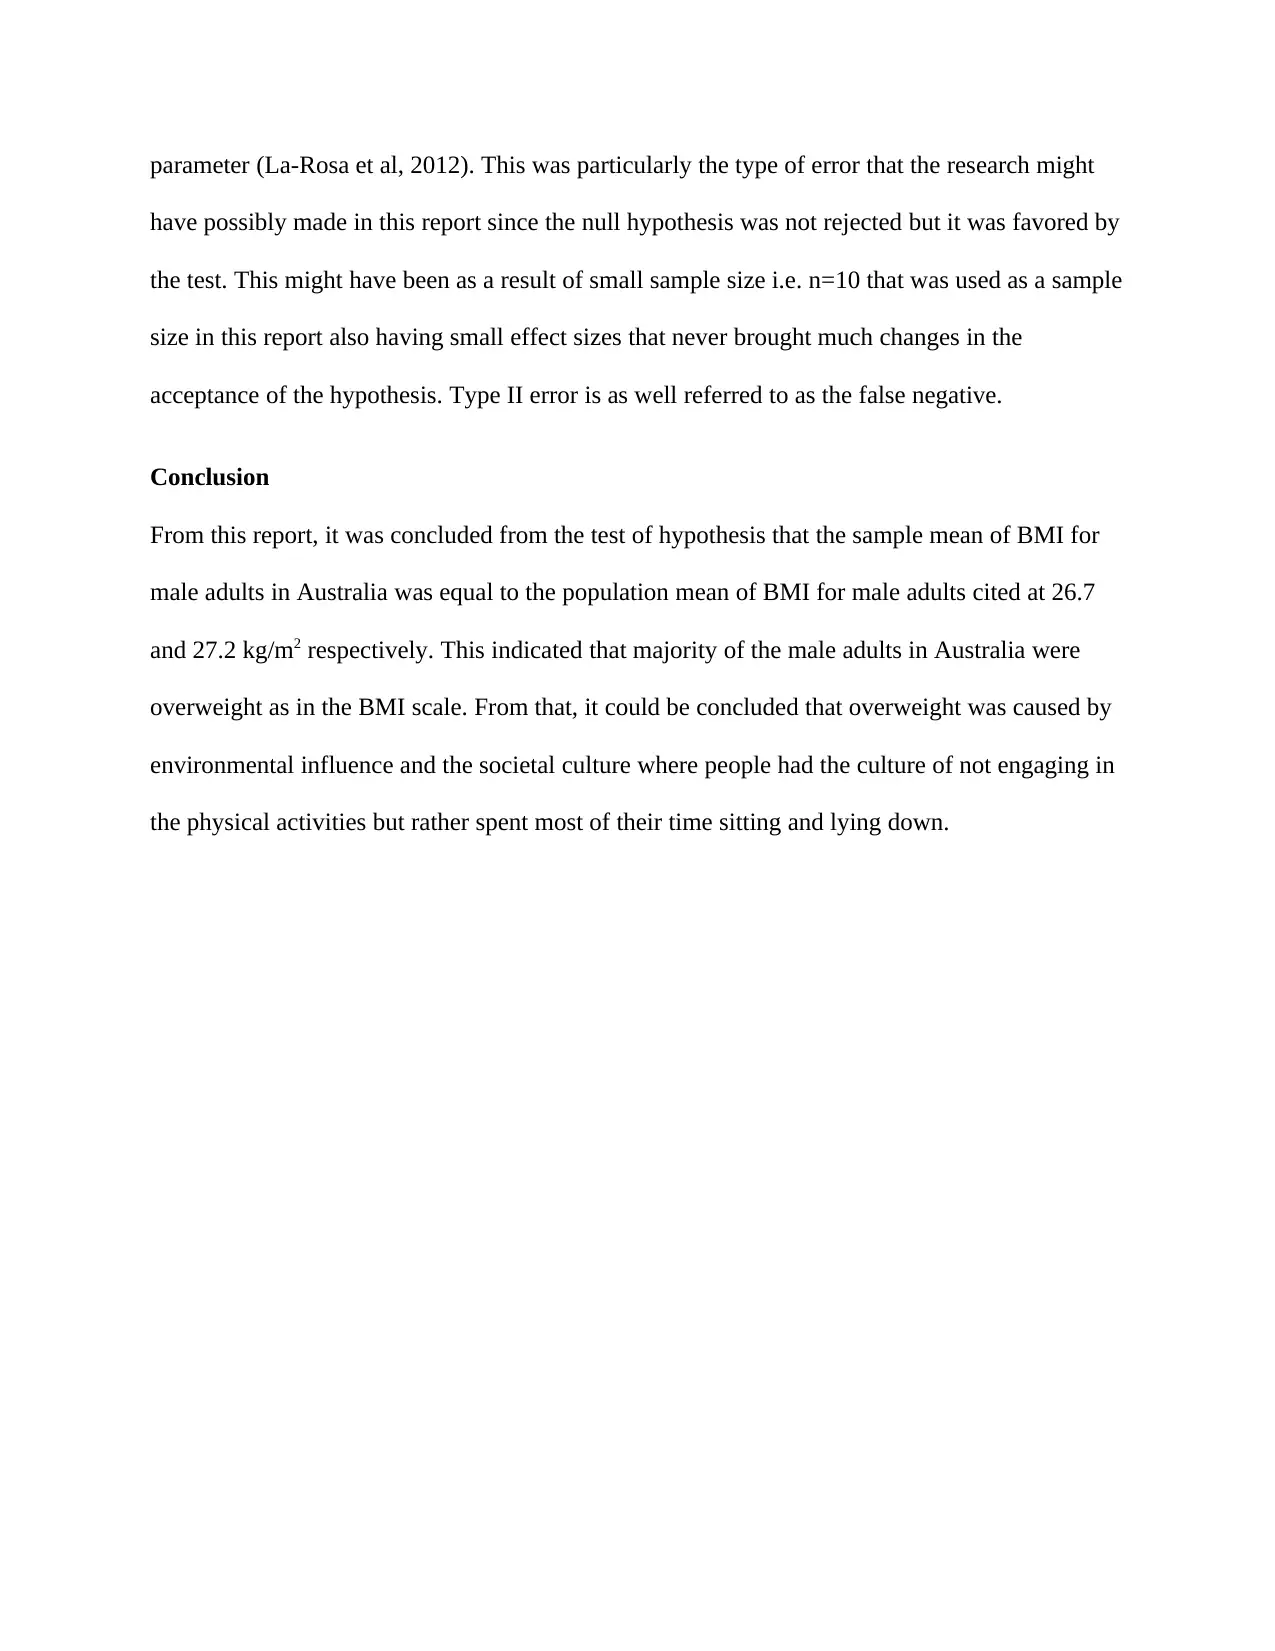
parameter (La-Rosa et al, 2012). This was particularly the type of error that the research might
have possibly made in this report since the null hypothesis was not rejected but it was favored by
the test. This might have been as a result of small sample size i.e. n=10 that was used as a sample
size in this report also having small effect sizes that never brought much changes in the
acceptance of the hypothesis. Type II error is as well referred to as the false negative.
Conclusion
From this report, it was concluded from the test of hypothesis that the sample mean of BMI for
male adults in Australia was equal to the population mean of BMI for male adults cited at 26.7
and 27.2 kg/m2 respectively. This indicated that majority of the male adults in Australia were
overweight as in the BMI scale. From that, it could be concluded that overweight was caused by
environmental influence and the societal culture where people had the culture of not engaging in
the physical activities but rather spent most of their time sitting and lying down.
References
ABS 2013a. Australian Health Survey: updated results, 2011–2012. ABS cat. no. 4364.0.55.003.
Canberra: ABS.
ABS 2014a. Australian Aboriginal and Torres Strait Islander Health Survey: updated results,
2012–13. ABS cat. no. 4727.0.55.006. Canberra: ABS. AIHW analysis of Basic Confidentialised
Unit Record File.
ABS 2015. National Health Survey: first results, 2014–15. ABS cat. no. 4364.0.55.001.
Canberra: ABS.
AIHW 2016a. Australia’s health 2016. Australia’s health series no. 15. Cat. no. AUS 199.
Canberra: AIHW.
ABS 2016b. Microdata: National Health Survey, 2014–15. ABS cat. no. 4324.0.55.001.
Canberra: ABS. AIHW analysis of Expanded Confidentialised Unit Record File.
ABS 2017. Australian Health Survey: consumption of added sugars, 2011–12. ABS cat. no.
4364.0.55.011. Canberra: ABS.
ABS 2016. Microdata: National Health Survey, 2014–15. ABS cat. no. 4324.0.55.001. Canberra:
ABS. AIHW analysis of Basic Confidentialised Unit Record File.
Department of Health 2017. Australia’s Physical Activity and Sedentary Behaviour Guidelines.
Canberra: Department of Health. Viewed 29 January 2018,
http://www.health.gov.au/internet/main/publishing.nsf/
content/health-pubhlth-strateg-phys-act-guidelines>.
⊘ This is a preview!⊘
Do you want full access?
Subscribe today to unlock all pages.
Trusted by 1+ million students worldwide
La Rosa, P.S., Brooks, J.P., Deych, E., Boone, E.L., Edwards, D.J., Wang, Q., Sodergren, E.,
Weinstock, G. and Shannon, W.D., 2012. Hypothesis testing and power calculations for
taxonomic-based human microbiome data. PloS one, 7(12), p.e52078.
Matuschek, H., Kliegl, R., Vasishth, S., Baayen, H. and Bates, D., 2017. Balancing Type I error
and power in linear mixed models. Journal of Memory and Language, 94, pp.305-315.
NHMRC 2013. Australian Dietary Guidelines. Canberra: NHMRC.
Ogden, C.L., Carroll, M.D., Fryar, C.D. and Flegal, K.M., 2015. Prevalence of obesity among
adults and youth: United States, 2011–2014.
Vanderwall, C., Clark, R.R., Eickhoff, J. and Carrel, A.L., 2017. BMI is a poor predictor of
adiposity in young overweight and obese children. BMC pediatrics, 17(1), p.135.
Wang, Y., Cai, L., Wu, Y., Wilson, R.F., Weston, C., Fawole, O., Bleich, S.N., Cheskin, L.J.,
Showell, N.N., Lau, B.D. and Chiu, D.T., 2015. What childhood obesity prevention programmes
work? A systematic review and meta‐analysis. Obesity reviews, 16(7), pp.547-565.
1 out of 10
Related Documents


Your All-in-One AI-Powered Toolkit for Academic Success.
+13062052269
info@desklib.com
Available 24*7 on WhatsApp / Email
![[object Object]](/_next/static/media/star-bottom.7253800d.svg)
Unlock your academic potential
Copyright © 2020–2026 A2Z Services. All Rights Reserved. Developed and managed by ZUCOL.