Comprehensive Report: Sample Size, Sampling Methods, Research Design
VerifiedAdded on 2020/03/13
|9
|2709
|159
Report
AI Summary
This report critically examines key aspects of research methodology, starting with the importance of sample size and the formula for its calculation, highlighting the advantages and disadvantages of large sample sizes, and the factors to consider when choosing a sample size. It then delves into sampling methods, specifically stratified sampling, its advantages, disadvantages, and how it was applied in a study involving Belgian bank workers, with suggestions for improvement. The report also analyzes cross-sectional research design, its advantages, and disadvantages, comparing it with longitudinal design. The report further explores the procedure of data collection, focusing on the use of questionnaires, identifying potential problems such as respondents' dishonesty, unclear questions, difficulty of analysis, emotional responses, skipped questions, and accessibility issues, and suggesting solutions to mitigate these challenges. Finally, it discusses the use of secondary data, its benefits, and the importance of checking for representativeness, competency, and accuracy before utilization.
Q1 Sample Size
Sample size is a proportion or a subset of a population. The choice of correct sample size is
important in gathering accurate information Kühberger et al (2014). This therefore makes sample
size a very fundamental factor in the reliability of the information collected. When making a
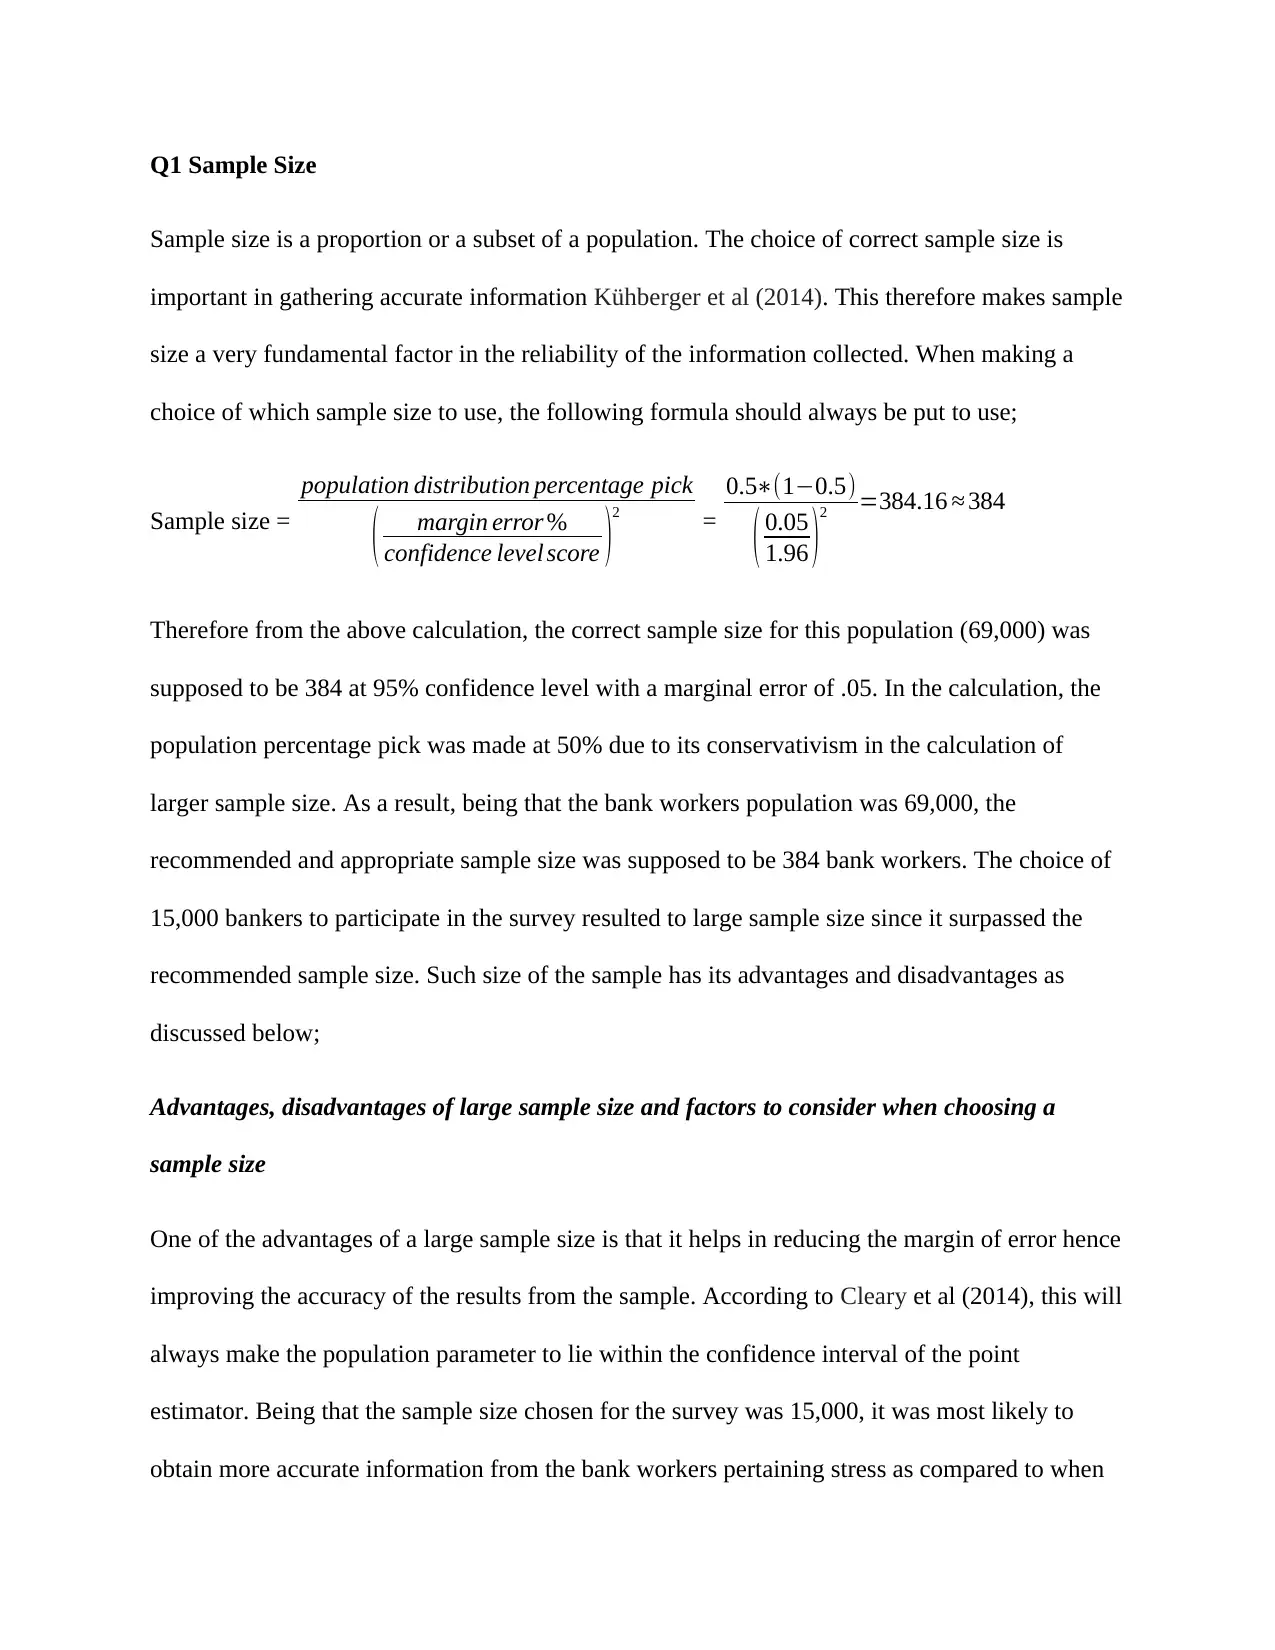
choice of which sample size to use, the following formula should always be put to use;
Sample size =
population distribution percentage pick
( margin error %
confidence level score )2 =
0.5∗(1−0.5)
( 0.05
1.96 )2 =384.16 ≈ 384
Therefore from the above calculation, the correct sample size for this population (69,000) was
supposed to be 384 at 95% confidence level with a marginal error of .05. In the calculation, the
population percentage pick was made at 50% due to its conservativism in the calculation of
larger sample size. As a result, being that the bank workers population was 69,000, the
recommended and appropriate sample size was supposed to be 384 bank workers. The choice of
15,000 bankers to participate in the survey resulted to large sample size since it surpassed the
recommended sample size. Such size of the sample has its advantages and disadvantages as
discussed below;
Advantages, disadvantages of large sample size and factors to consider when choosing a
sample size
One of the advantages of a large sample size is that it helps in reducing the margin of error hence
improving the accuracy of the results from the sample. According to Cleary et al (2014), this will
always make the population parameter to lie within the confidence interval of the point
estimator. Being that the sample size chosen for the survey was 15,000, it was most likely to
obtain more accurate information from the bank workers pertaining stress as compared to when
Sample size is a proportion or a subset of a population. The choice of correct sample size is
important in gathering accurate information Kühberger et al (2014). This therefore makes sample
size a very fundamental factor in the reliability of the information collected. When making a
choice of which sample size to use, the following formula should always be put to use;
Sample size =
population distribution percentage pick
( margin error %
confidence level score )2 =
0.5∗(1−0.5)
( 0.05
1.96 )2 =384.16 ≈ 384
Therefore from the above calculation, the correct sample size for this population (69,000) was
supposed to be 384 at 95% confidence level with a marginal error of .05. In the calculation, the
population percentage pick was made at 50% due to its conservativism in the calculation of
larger sample size. As a result, being that the bank workers population was 69,000, the
recommended and appropriate sample size was supposed to be 384 bank workers. The choice of
15,000 bankers to participate in the survey resulted to large sample size since it surpassed the
recommended sample size. Such size of the sample has its advantages and disadvantages as
discussed below;
Advantages, disadvantages of large sample size and factors to consider when choosing a
sample size
One of the advantages of a large sample size is that it helps in reducing the margin of error hence
improving the accuracy of the results from the sample. According to Cleary et al (2014), this will
always make the population parameter to lie within the confidence interval of the point
estimator. Being that the sample size chosen for the survey was 15,000, it was most likely to
obtain more accurate information from the bank workers pertaining stress as compared to when
Paraphrase This Document
Need a fresh take? Get an instant paraphrase of this document with our AI Paraphraser
smaller sample size would have been used by the two research institutions i.e. Katholike
Universteit Leuven and the private company in Belgium. Additionally, large sample sizes are
important in that they are representative of the wider range of elements contained in the
population. Due to this therefore, all or most of the outliers will be captured in the sample unlike
when the sample is size is small Belli et al (2014).
One major disadvantage of large sample is its costly nature. Reaching and covering a wider
proportion of the population involves high expense incurred in the process Goodman et al
(2013). The Union of Belgian Banks would therefore incur much through the assigned research
institutes in the data collection from the targeted 15,000 bank workers. Being that the
participants were not found from the same bank institution, the process would also be time
consuming to get to various parts of the country for other bank workers.
Cost that will be involved in obtaining the sample is one among other factors that should be
considered when coming up with which sample size to use in a survey. The risk involved in the
values collected from the sample will also act as the determinant of the sample size i.e. if only
the risk value matters in the collected values then as a result therefore, low risk values will call
for large sample sizes. Prior information about the topic of study will also help in either reducing
or increasing the sample size since prior estimates of means and variances will be used to help
dealing with variation that could be found within groups (Button et al, 2013).
Q2 Sampling Methods
Sampling method is the process by which representative groups are selected from the population
that is being studied. In the selection of the 15,000 bank workers for the sample by the research
institutions, they used stratified sampling method. One of the advantages of the currently used
sampling method by the institutions is that the sampling method minimizes sampling errors Ye et
al (2013). This is achieved though dividing the population into subgroups called strata. The strata
are spread to ensure that each characteristic of the population is represented by the strata and
having the elements in each stratum selected by simple random sampling hence reducing sample
selection bias. Also, stratified sampling method ensures that the targeted population is highly
represented in the sample. Difficulty to identify ways of subdividing the population into
subpopulations makes it at times unusable by the researchers, where this forms one of the major
disadvantages. Additionally, stratified sampling method is time consuming where a lot of time is
spent in the identification of the strata and then later select the sample from each strata through
simple random sampling method (Acharya et al, 2013). In relation to the situation at hand, the
research institutions i.e. the private specialized company in stress at work and Katholike
Universteit Leuven, they first had to identify all the bank institutions in Belgium then divide the
workers according to their bank institutions to form strata where further, the workers were now
to be selected from the bank institutions through simple random sampling method to provide
equal chances of obtaining the workers that will form the useable subset of the population. In
order to improve the effectiveness of this sampling method (stratified sampling method), I
therefore suggest that the number of strata to be increased. This will increase from where
sampling of the individuals in the population will be selected hence representing almost the
entire population thus reducing the marginal error in sampling.
Q3 Research Design
Cross-sectional design is a tool used by the researchers to obtain specific point time information
from the collected data. It has some of the advantages and disadvantages. One of the advantages
as noted by (Shen and Björk, 2015) is that the cross-sectional research design through cross-
⊘ This is a preview!⊘
Do you want full access?
Subscribe today to unlock all pages.
Trusted by 1+ million students worldwide
sectional study can help in ascertaining the worthiness of assumptions in the study. Also, as
compared to other research designs, cross-sectional design is less time consuming. Since
information is for specific point time of the already collected information, it therefore take cross-
sectional research design less time to identify information of interest. Furthermore, the research
design inexpensive. Unlike cross-sectional research design, longitudinal design has the potential
to display the pattern of variable or variables for a certain period of time as it major advantage.
Disadvantages of cross-sectional design is that it cannot be relied on to predict the relationship
between and the findings this is due to it lacking the time element since it only measures point
time information. Prevalence as a result of extended period of time cases, these are seen from the
cases that exist for a long period of time and they may be perceived less serious. On the other
hand therefore, longitudinal research design is more expensive since it covers a long period of
time. Longitudinal design is as well time consuming due to its ability to predict pattern over
period of time. Also, when the expected outcomes are less, longitudinal design becomes less
efficient (Shen and Björk, 2015).
Q4 Procedure of Data Collection
In the collection of data from the bank workers, the research institutions used questionnaires that
were structured with questions where the respondents were only required to give their responses
on the provided spaces. Just like any other method of data collection methods, collection of data
through questionnaires face some of the problems that need to be addressed.
According to Chernick et al (2011), respondents’ dishonesty is one of the major problems that
questionnaires have. Respondents can decide not to be truthful when they are responding to the
questions with the fear that their identities can be disclosed to the public. This can tamper with
Paraphrase This Document
Need a fresh take? Get an instant paraphrase of this document with our AI Paraphraser
the accuracy and reliability of the results if such happens in the process of data collection. To
eradicate this problem, the researcher is supposed to assure the participants who take part in the
process that their privacy is highly valued and that they be kept private without access of any
unauthorized persons. When this is effected, such problems would not reoccur or they will
reduce in future.
Being that the questionnaires were prepared by the research institutions and distributed to
various banks in the country, there was no physical touch or face to face communication between
the researchers and he respondents, the respondents will respond to the questions according to
their own understanding of the questions and interpretations. For the same results intended by the
subject of study, the questions if not clarified may not result to the common understanding. This
can be as a result of unclear questions to the respondents. This problem therefore can be dealt
with by the researcher through creating or composing questions that are easy and simple to
understand and answer.
Difficulty of the questions to analyze is another problem that questionnaires have. When
constructing the questions in the questionnaire, if the questionnaire happen to contain so many
open ended questions, this will call for the opinion of the respondents hence cannot be coded
during the analysis process. This occur more often whenever there are open ended questions and
people’s opinions vary from one individual to another thus resulting to too much data that cannot
be handled with ease and analyzed. This problem therefore can be dealt with and corrected by
coming up with good question types that are close ended and that will allow for multiple choices
that can be coded for easy analysis.
Face to face communication has been so effective in that one can be able see the emotions of a
person through facial expressions, but with questionnaires it is difficult to capture such emotional
responses that are expressed by the respondents especially when the questionnaire is
administered thus data that could be observed from the respondents on their body language
would be lost or go unnoticed. This particular type of problem can be combated by constructing
questionnaires that have Likert scale that would be used to rate the attitude, feelings or emotions
of the respondents.
At some times, the provided questions in the questionnaires are not always responded to. The
respondents may decide to skip some of the questions due to their own reasons and submit the
questionnaire forms with the skipped questions unanswered. For the case of online survey, they
normally come with clear solution to such kind of problem. They simply make all the fields for
the questions required without which the respondent cannot proceed to the next step or the form
cannot be submitted. But for the case of our research question questionnaires, we can combat this
problem by constructing uncomplicated questions and above all make the survey short, this will
help increase the completion rates.
Accessibility to the questionnaires is another major problem that is faced when data is collected
using questionnaires. Questionnaires do not always take care of people with some forms of
disabilities such as visual or hearing impairment. Such people are not suitable to use the
questionnaires and this can be corrected by using questionnaires whose accessibility options are
built in.
Q5 Secondary Data
Secondary data are second hand information that are obtained from the database archives.
Depending on the subject of study, secondary data that will be used must be relevant to the
subject of study. Also, before the secondary data is used to check for the representativeness of
⊘ This is a preview!⊘
Do you want full access?
Subscribe today to unlock all pages.
Trusted by 1+ million students worldwide
the sample, competency and accuracy of the data to the subject of the study must be first checked
and confirmed, this is according to Piwowar and Vision (2013). Using secondary gives the
researcher a clear picture of what he/ she expects and therefore saves time. Most of the
secondary data are always obtained from the databases where they are stored making their
retrieval easy and cheaper as compared to collecting primary data. Secondary data that were
funded and collected by the government are in most cases involving large samples which result
to the increased statistical precision since larger proportion of the population is represented.
Understanding secondary data can be done through reading the manuals that are stored alongside
the data where thereafter they should be prepared for use in checking for representativeness. All
variables and the treatment of missing data should be appropriately addressed to hold the
meaning of data. Suitable sampling design mostly probabilistic sampling designs are supposed to
be applied where since the sample is large, stratified sampling method is seen appropriate since it
always represent more items from the population. Statistical analysis to be used is supposed to be
ensured that it reflects the sampling design that was used where the point estimates such as
means, variance and standard deviations should be in a manner that they cater for unequal
sampling probabilities. The obtained secondary point estimators are then compared to the
primary point estimators of the subject of study. If they are onto each other or too close to one
another, then there will be confidence that the obtained point estimators are the reflection of the
population parameter and thus the data is representative.
Paraphrase This Document
Need a fresh take? Get an instant paraphrase of this document with our AI Paraphraser
References
Acharya, A.S., Prakash, A., Saxena, P. and Nigam, A., 2013. Sampling: Why and how of
it. Indian Journal of Medical Specialties, 4(2), pp.330-333.
Belli, S., Newman, A.B. and Ellis, R.S., 2014. Velocity dispersions and dynamical masses for a
large sample of quiescent galaxies at z> 1: Improved measures of the growth in mass and
size. The Astrophysical Journal, 783(2), p.117.
Button, K.S., Ioannidis, J.P., Mokrysz, C., Nosek, B.A., Flint, J., Robinson, E.S. and Munafò,
M.R., 2013. Power failure: why small sample size undermines the reliability of
neuroscience. Nature Reviews Neuroscience,14(5), pp.365-376.
Chernick, M.R., González-Manteiga, W., Crujeiras, R.M. and Barrios, E.B., 2011. Bootstrap
methods. In International Encyclopedia of Statistical Science(pp. 169-174). Springer Berlin
Heidelberg.
Cleary, M., Horsfall, J. and Hayter, M., 2014. Data collection and sampling in qualitative
research: does size matter?. Journal of advanced nursing, 70(3), pp.473-475.
Goodman, J.K., Cryder, C.E. and Cheema, A., 2013. Data collection in a flat world: The
strengths and weaknesses of Mechanical Turk samples. Journal of Behavioral Decision
Making, 26(3), pp.213-224.
Kühberger, A., Fritz, A. and Scherndl, T., 2014. Publication bias in psychology: a diagnosis
based on the correlation between effect size and sample size. PloS one, 9(9), p.e105825.
Piwowar, H.A. and Vision, T.J., 2013. Data reuse and the open data citation advantage. PeerJ, 1,
p.e175.

Shen, C. and Björk, B.C., 2015. ‘Predatory’open access: a longitudinal study of article volumes
and market characteristics. BMC medicine, 13(1), p.230.
Ye, Y., Wu, Q., Huang, J.Z., Ng, M.K. and Li, X., 2013. Stratified sampling for feature subspace
selection in random forests for high dimensional data. Pattern Recognition, 46(3), pp.769-787.
and market characteristics. BMC medicine, 13(1), p.230.
Ye, Y., Wu, Q., Huang, J.Z., Ng, M.K. and Li, X., 2013. Stratified sampling for feature subspace
selection in random forests for high dimensional data. Pattern Recognition, 46(3), pp.769-787.
⊘ This is a preview!⊘
Do you want full access?
Subscribe today to unlock all pages.
Trusted by 1+ million students worldwide
1 out of 9
Related Documents


Your All-in-One AI-Powered Toolkit for Academic Success.
+13062052269
info@desklib.com
Available 24*7 on WhatsApp / Email
![[object Object]](/_next/static/media/star-bottom.7253800d.svg)
Unlock your academic potential
Copyright © 2020–2026 A2Z Services. All Rights Reserved. Developed and managed by ZUCOL.