MDM4U Evaluating Research Assignment: Sampling, Bias, and BMI Study

Verified

Added on  2023/06/13

|4
|1530
|58
Homework Assignment
AI Summary
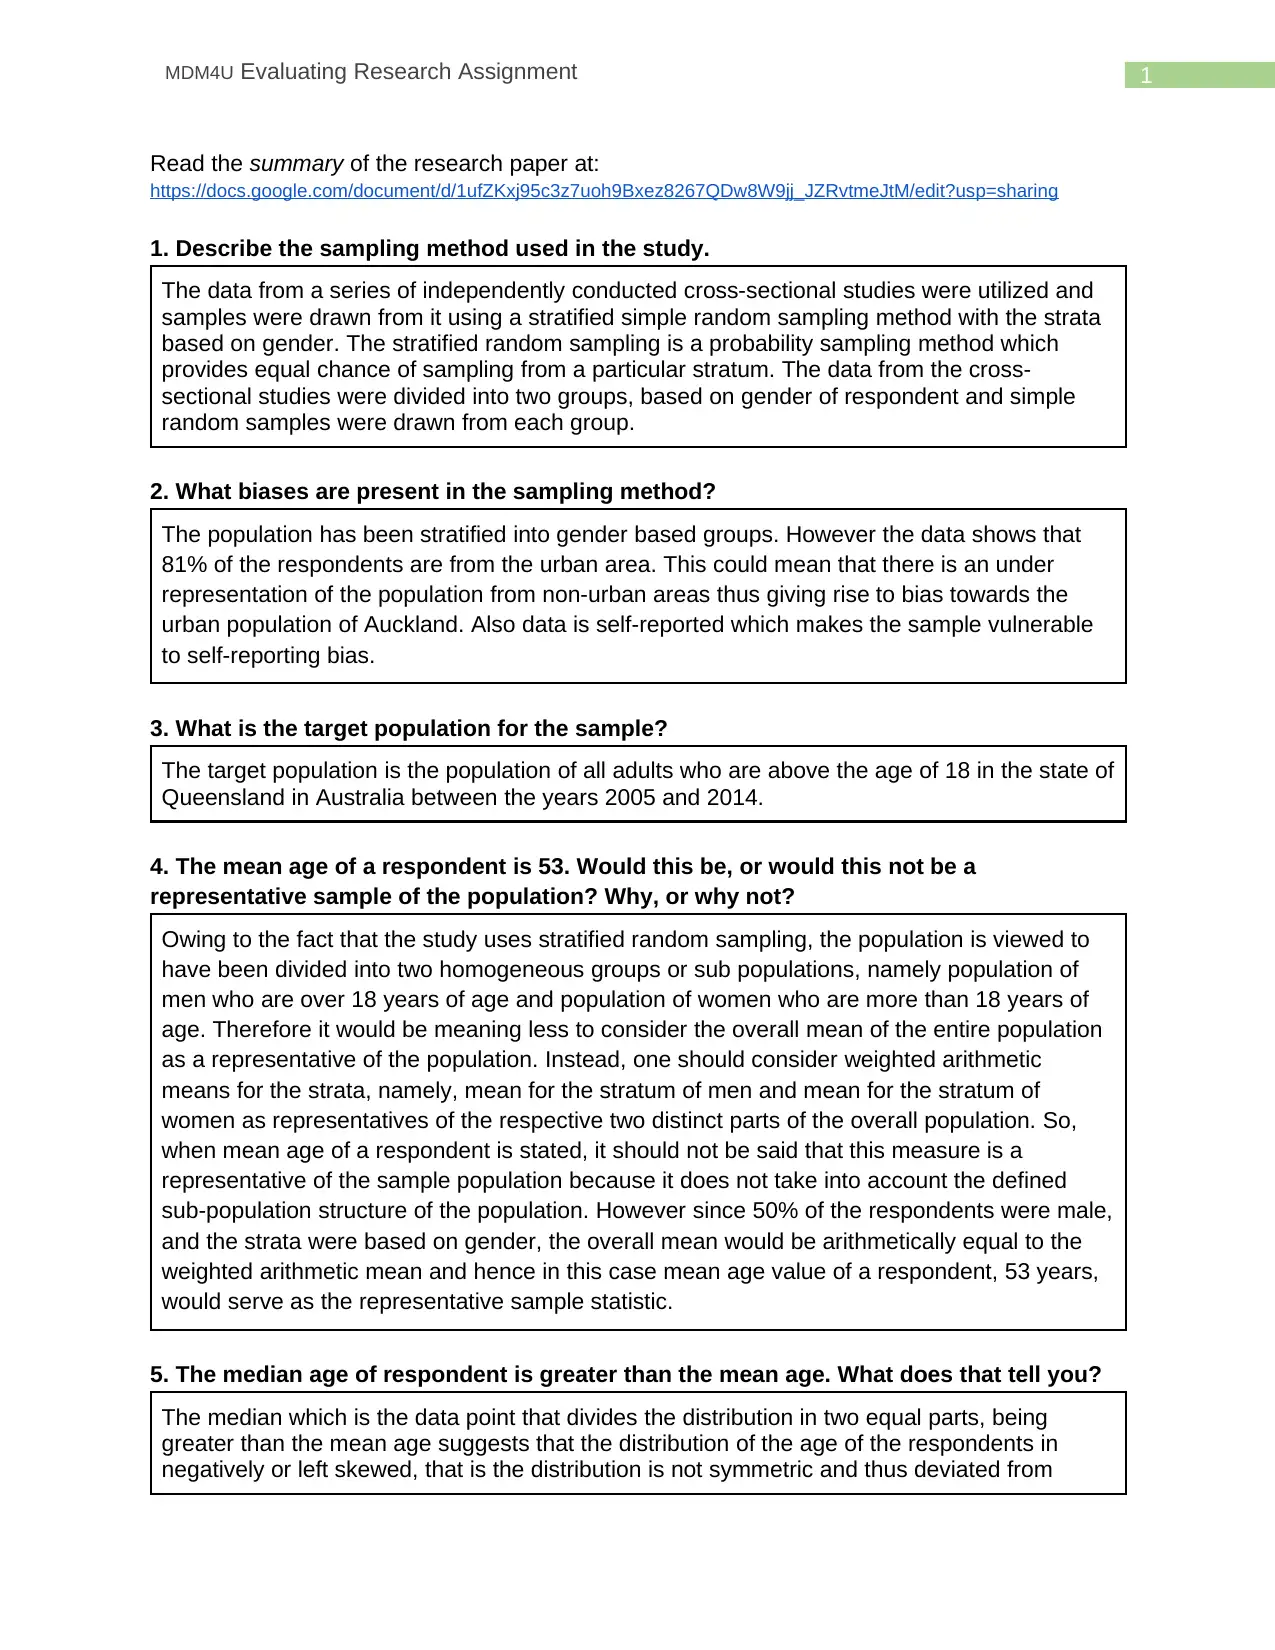
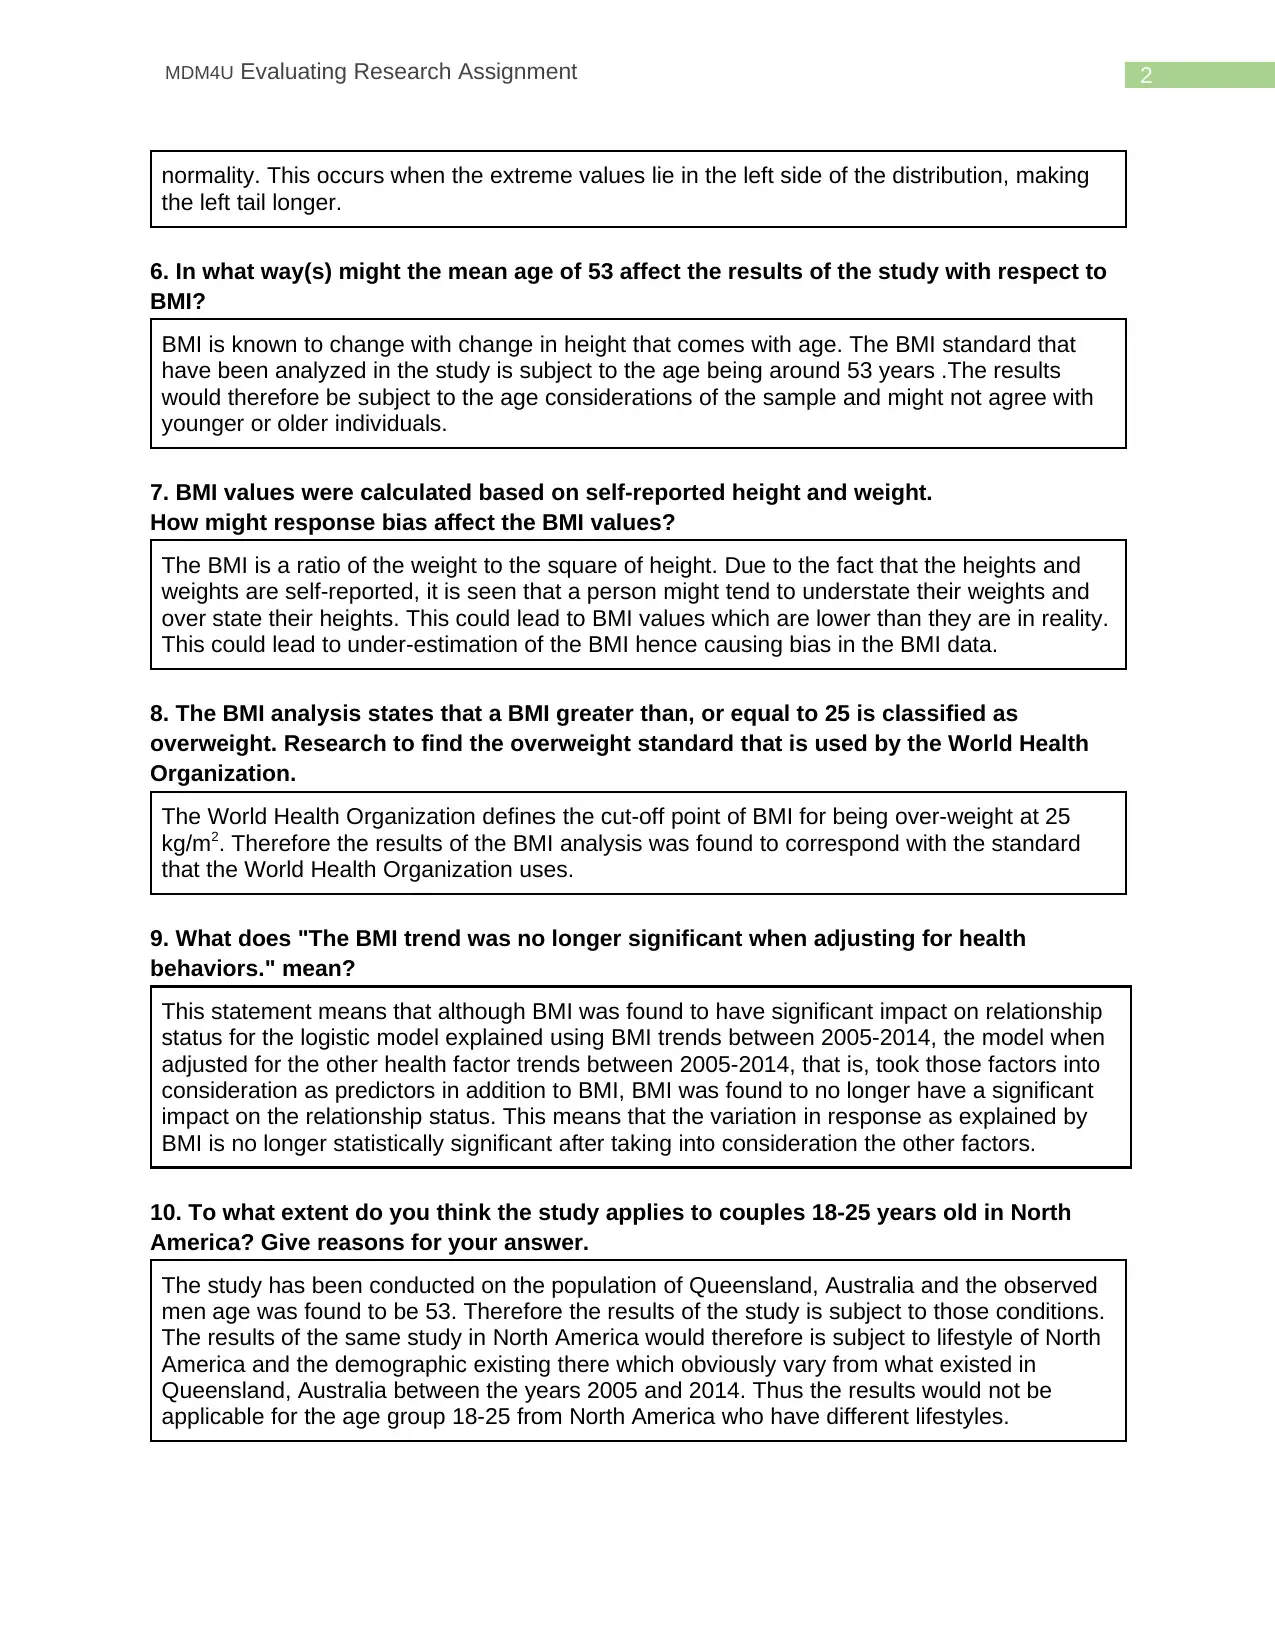
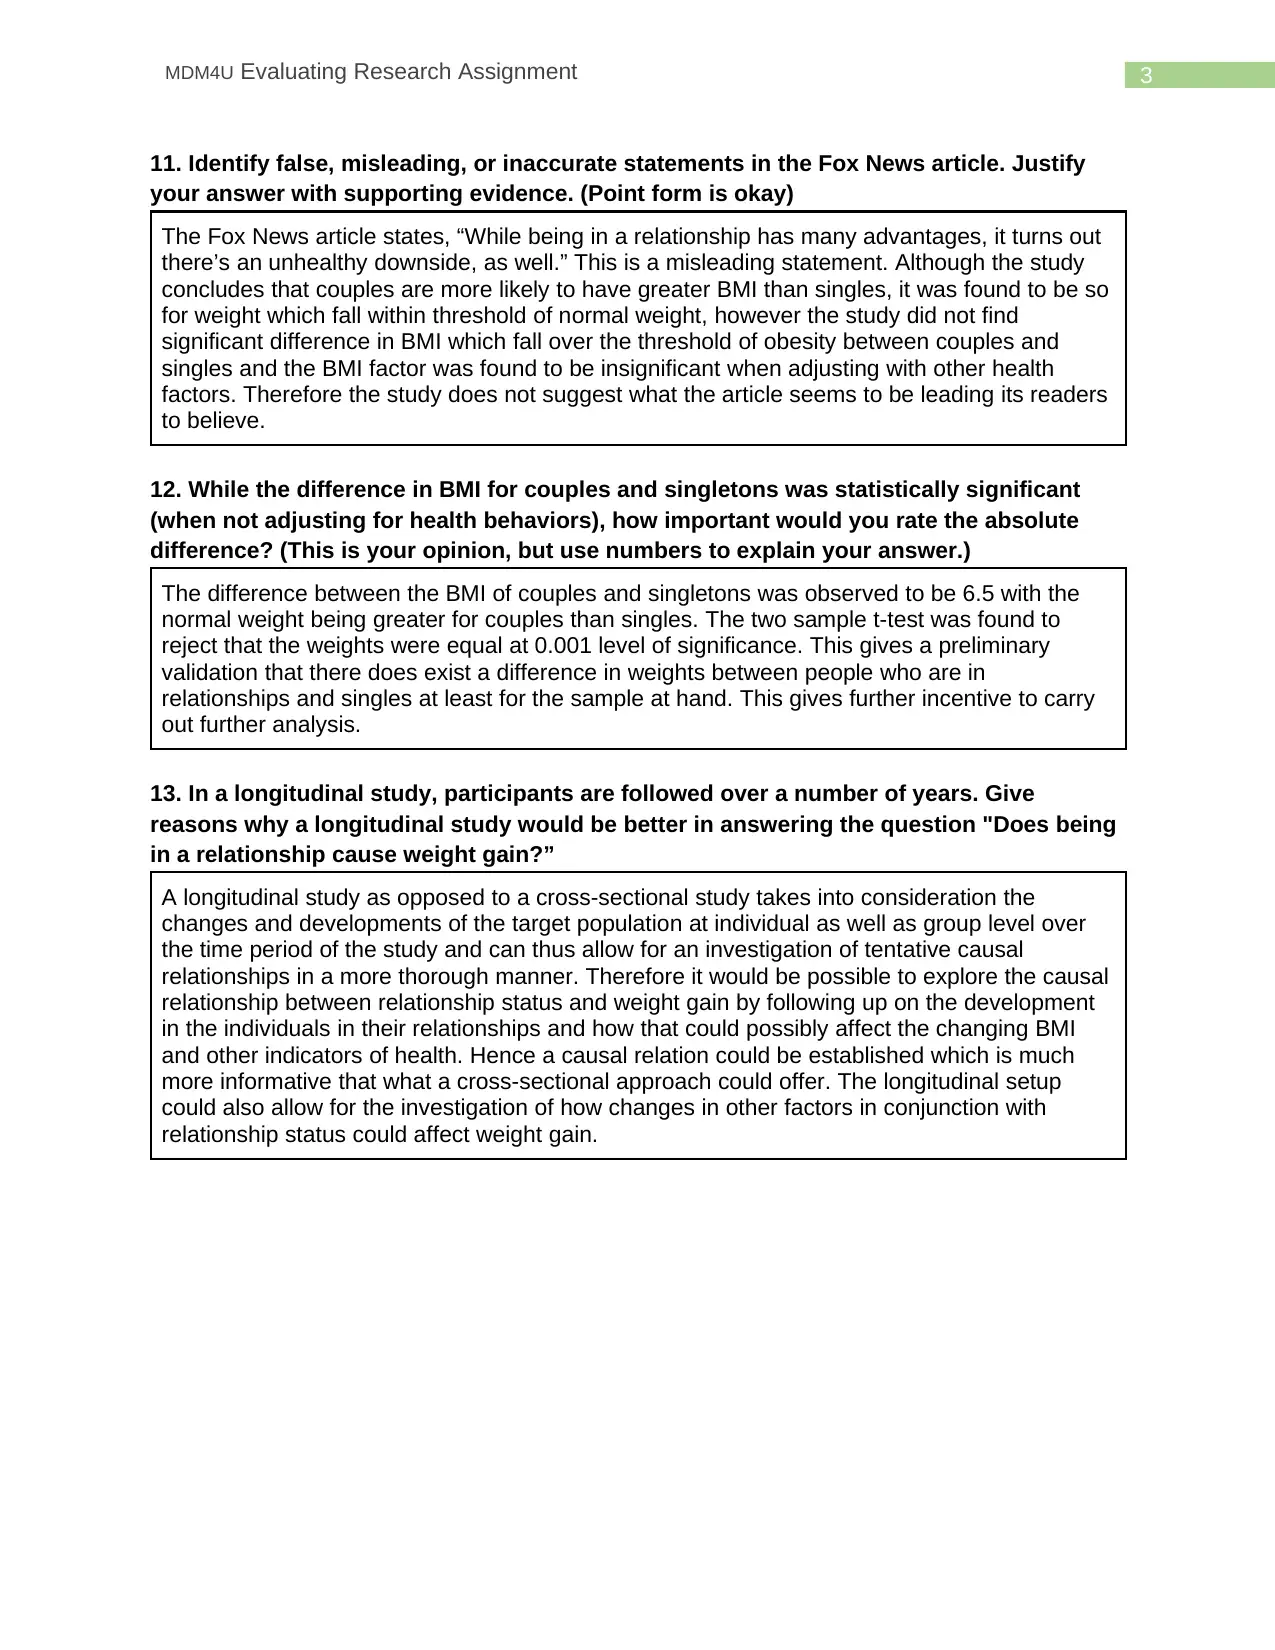
This document presents a student's solution to a research evaluation assignment, focusing on a study related to BMI and relationship status. The solution addresses key aspects of the research, including the sampling method used, potential biases present in the sampling, the target population, and the representativeness of the sample based on mean and median ages. It further examines the impact of age and self-reported data on BMI values, compares the BMI standard used in the study with the World Health Organization's standard, and interprets the significance of BMI trends when adjusted for health behaviors. The solution also evaluates the applicability of the study's findings to a different population (young adults in North America) and identifies misleading statements in a related news article. Finally, it discusses the importance of the absolute difference in BMI between couples and singletons and explains why a longitudinal study would be better suited to investigate the causal relationship between relationship status and weight gain. Desklib offers a wide range of similar solved assignments and study resources for students.
Document Page
MDM4U Evaluating Research Assignment
Evaluating Research Assignment
Name of Student
Name of University
tabler-icon-diamond-filled.svg

Paraphrase This Document

Need a fresh take? Get an instant paraphrase of this document with our AI Paraphraser
Document Page
1MDM4U Evaluating Research Assignment
Read the summary of the research paper at:
https://docs.google.com/document/d/1ufZKxj95c3z7uoh9Bxez8267QDw8W9jj_JZRvtmeJtM/edit?usp=sharing
1. Describe the sampling method used in the study.
The data from a series of independently conducted cross-sectional studies were utilized and
samples were drawn from it using a stratified simple random sampling method with the strata
based on gender. The stratified random sampling is a probability sampling method which
provides equal chance of sampling from a particular stratum. The data from the cross-
sectional studies were divided into two groups, based on gender of respondent and simple
random samples were drawn from each group.
2. What biases are present in the sampling method?
The population has been stratified into gender based groups. However the data shows that
81% of the respondents are from the urban area. This could mean that there is an under
representation of the population from non-urban areas thus giving rise to bias towards the
urban population of Auckland. Also data is self-reported which makes the sample vulnerable
to self-reporting bias.
3. What is the target population for the sample?
The target population is the population of all adults who are above the age of 18 in the state of
Queensland in Australia between the years 2005 and 2014.
4. The mean age of a respondent is 53. Would this be, or would this not be a
representative sample of the population? Why, or why not?
Owing to the fact that the study uses stratified random sampling, the population is viewed to
have been divided into two homogeneous groups or sub populations, namely population of
men who are over 18 years of age and population of women who are more than 18 years of
age. Therefore it would be meaning less to consider the overall mean of the entire population
as a representative of the population. Instead, one should consider weighted arithmetic
means for the strata, namely, mean for the stratum of men and mean for the stratum of
women as representatives of the respective two distinct parts of the overall population. So,
when mean age of a respondent is stated, it should not be said that this measure is a
representative of the sample population because it does not take into account the defined
sub-population structure of the population. However since 50% of the respondents were male,
and the strata were based on gender, the overall mean would be arithmetically equal to the
weighted arithmetic mean and hence in this case mean age value of a respondent, 53 years,
would serve as the representative sample statistic.
5. The median age of respondent is greater than the mean age. What does that tell you?
The median which is the data point that divides the distribution in two equal parts, being
greater than the mean age suggests that the distribution of the age of the respondents in
negatively or left skewed, that is the distribution is not symmetric and thus deviated from
Document Page
2MDM4U Evaluating Research Assignment
normality. This occurs when the extreme values lie in the left side of the distribution, making
the left tail longer.
6. In what way(s) might the mean age of 53 affect the results of the study with respect to
BMI?
BMI is known to change with change in height that comes with age. The BMI standard that
have been analyzed in the study is subject to the age being around 53 years .The results
would therefore be subject to the age considerations of the sample and might not agree with
younger or older individuals.
7. BMI values were calculated based on self-reported height and weight.
How might response bias affect the BMI values?
The BMI is a ratio of the weight to the square of height. Due to the fact that the heights and
weights are self-reported, it is seen that a person might tend to understate their weights and
over state their heights. This could lead to BMI values which are lower than they are in reality.
This could lead to under-estimation of the BMI hence causing bias in the BMI data.
8. The BMI analysis states that a BMI greater than, or equal to 25 is classified as
overweight. Research to find the overweight standard that is used by the World Health
Organization.
The World Health Organization defines the cut-off point of BMI for being over-weight at 25
kg/m2. Therefore the results of the BMI analysis was found to correspond with the standard
that the World Health Organization uses.
9. What does "The BMI trend was no longer significant when adjusting for health
behaviors." mean?
This statement means that although BMI was found to have significant impact on relationship
status for the logistic model explained using BMI trends between 2005-2014, the model when
adjusted for the other health factor trends between 2005-2014, that is, took those factors into
consideration as predictors in addition to BMI, BMI was found to no longer have a significant
impact on the relationship status. This means that the variation in response as explained by
BMI is no longer statistically significant after taking into consideration the other factors.
10. To what extent do you think the study applies to couples 18-25 years old in North
America? Give reasons for your answer.
The study has been conducted on the population of Queensland, Australia and the observed
men age was found to be 53. Therefore the results of the study is subject to those conditions.
The results of the same study in North America would therefore is subject to lifestyle of North
America and the demographic existing there which obviously vary from what existed in
Queensland, Australia between the years 2005 and 2014. Thus the results would not be
applicable for the age group 18-25 from North America who have different lifestyles.
Document Page
3MDM4U Evaluating Research Assignment
11. Identify false, misleading, or inaccurate statements in the Fox News article. Justify
your answer with supporting evidence. (Point form is okay)
The Fox News article states, “While being in a relationship has many advantages, it turns out
there’s an unhealthy downside, as well.” This is a misleading statement. Although the study
concludes that couples are more likely to have greater BMI than singles, it was found to be so
for weight which fall within threshold of normal weight, however the study did not find
significant difference in BMI which fall over the threshold of obesity between couples and
singles and the BMI factor was found to be insignificant when adjusting with other health
factors. Therefore the study does not suggest what the article seems to be leading its readers
to believe.
12. While the difference in BMI for couples and singletons was statistically significant
(when not adjusting for health behaviors), how important would you rate the absolute
difference? (This is your opinion, but use numbers to explain your answer.)
The difference between the BMI of couples and singletons was observed to be 6.5 with the
normal weight being greater for couples than singles. The two sample t-test was found to
reject that the weights were equal at 0.001 level of significance. This gives a preliminary
validation that there does exist a difference in weights between people who are in
relationships and singles at least for the sample at hand. This gives further incentive to carry
out further analysis.
13. In a longitudinal study, participants are followed over a number of years. Give
reasons why a longitudinal study would be better in answering the question "Does being
in a relationship cause weight gain?”
A longitudinal study as opposed to a cross-sectional study takes into consideration the
changes and developments of the target population at individual as well as group level over
the time period of the study and can thus allow for an investigation of tentative causal
relationships in a more thorough manner. Therefore it would be possible to explore the causal
relationship between relationship status and weight gain by following up on the development
in the individuals in their relationships and how that could possibly affect the changing BMI
and other indicators of health. Hence a causal relation could be established which is much
more informative that what a cross-sectional approach could offer. The longitudinal setup
could also allow for the investigation of how changes in other factors in conjunction with
relationship status could affect weight gain.
chevron_up_icon
1 out of 4
circle_padding
hide_on_mobile
zoom_out_icon
[object Object]