Evaluation of Sampling Methods and Sample Size: Statistics Report
VerifiedAdded on 2022/08/18
|13
|3099
|16
Report
AI Summary
This report evaluates three primary sampling methods: stratified, simple random, and systematic sampling. Part 1 provides detailed explanations and case studies for each method, outlining their processes, advantages, and limitations. The stratified sampling method is exemplified by a professional organization, dividing members into subgroups and randomly selecting members. Simple random sampling, using a local newspaper subscriber list, ensures an equal chance for selection, while systematic sampling addresses clustered selection by introducing an interval. Part 2 delves into sample size determination using G*Power, analyzing scenarios and compromise solutions for reduced sample sizes. It discusses the implications of Type I and Type II errors, relating them to the alpha and beta values, and concludes that a smaller sample size might require design compromises. The report emphasizes the importance of sample size in achieving reliable research outcomes and highlights the trade-offs involved in compromising on the power of a test.

Evaluating Sampling Methods and Sample Size
Paraphrase This Document
Need a fresh take? Get an instant paraphrase of this document with our AI Paraphraser
Evaluating Sampling Methods and Sample Size
Part 1
Case 1
The stratified sampling method is an approach to sampling that gives consideration to the
aspect of a sample being representative of the population it is drawn from (Marshall & Rossman,
2011). The stratified sampling method achieves this by creating homogenous subgroups from the
entire population and then carrying out random sampling in each of the subgroups (Lance &
Hattori, 2016). As the name suggests, the subgroups are called strata with a single subgroup
being a stratum. Through the creation of homogenous subgroups from the population (strata), the
sampling plan is able to accommodate all subgroups in the population hence being adequately
representative.
The stratified sampling method has three steps for arriving at the final sample. The first
step is the identification of possible subgroups in the population and division of the population
into these subgroups (Zekic-Susac & Has, 2015). The identification process for the subgroups is
heavily dependent on the nature of the research being carried out. For instance, if the research is
interested in gender, then the possible subgroups are females and males, whereas if the research
is interested in education qualification, then the possible subgroups are high school diploma
holders (graduates), Bachelor Degree holders, Master’s Degree holders and PhD holders. The
second step is the collection of random samples from the created strata (Zekic-Susac & Has,
2015). In each of the strata, a random sample of a predetermined size is selected. The final step
combines the samples selected from each of the stratum in the over sample for the given
population and it then ready for use in the data analysis stage of the research (Zekic-Susac &
Has, 2015).
2
Evaluating Sampling Methods and Sample Size
In the context of case one, the entire population comprises all the individuals that are
registered as members of the professional organization. The research is interested in the
profession of the members of the professional organization, hence in step one we identify the
possible homogenous sub groups as doctors, lawyers and engineers. After the identification of
the professions, we proceed to divide the members of the professional organization into groups
(strata) of doctors, lawyers and engineers. In step two, in each of the strata, 75 members are
randomly selected, resulting in 75 engineers, 75 lawyers and 75 doctors. This form of stratified
sampling is called the proportionate stratified sampling method. The proportionate stratified
sampling method is stratified sampling approach in which the sample size of the items
(individuals, as in this case members) selected in each of the strata is equal (Lance & Hattori,
2016). In the final step of the stratified sampling method, members randomly selected in each of
the strata are combined together to form the final sample of 225 members from the professional
organization.
The stratified random sampling method is efficient in ensuring the representativeness of
the sample as well as precision, which make it cost effective by enabling the use of a smaller
sample size (Punch, 2013). The creation of strata and collection of random samples from them
allow for further analysis to be conducted, focused on each of the resulting homogenous groups.
The sampling technique is however limited, in terms of time consumed both in the sample
selection process as well as in the analysis process, which is more complex.
3
⊘ This is a preview!⊘
Do you want full access?
Subscribe today to unlock all pages.
Trusted by 1+ million students worldwide
Evaluating Sampling Methods and Sample Size
Case 2
The simple random sampling method is an approach to sampling that allows for all
members of a population to have an equally likely opportunity of being selected to be in the
sample (Babbie, 2010). The simple random sampling method achieves this by not having preset
conditions for a member of a population to be selected in a sample. This non-discriminant
approach ensures that any member can be selected as part of the sample regardless of other
characteristics that they possess (Creswell, 2014).
Six steps are involved in arriving at the final sample in the simple random sampling
method as follows (Creswell, 2014): The first step is definition of the population, which involves
the identification of the target population for the study. The second step is the selection of the
sample size for the research. The sample size is based either on mathematical calculations of the
sample size or the budget for the research. The third step is the listing of the population; this
mainly involves obtaining information on the members of the entire population of interest in the
research. The fourth step is the assigning of numbers, in which all the members of the population
are given a number ranging from 1 to N (where N is the population size). The fifth step is the
generation of random numbers either through the use of data analytics software algorithms or the
use of the random numbers tables. The random numbers are generated in the range of the
numbers assigned to the members of the population (that is 1 to N). The final step is the random
sample selection; this is done by looking at the random numbers generated in the fifth step and
identifying the corresponding assigned numbers of the members of the population. The
corresponding members are selected as the final sample for the research.
In the context of case two, in the first step, the population is defined as all the individuals
that are subscribers to the local newspaper. In the second step, the sample size is selected as 150
4
Paraphrase This Document
Need a fresh take? Get an instant paraphrase of this document with our AI Paraphraser
Evaluating Sampling Methods and Sample Size
subscribers for the research based on either mathematical formulae or budget constraints. The
entire population of the subscribers to the local newspaper is then listed, using the information
provided by the local newspaper on their subscribers, in the third step. Once the subscribers to
the local newspaper are listed, they are assigned numbers from 1 to N in the fourth step. The fifth
step will involve using algorithms in the data analytics software or the random numbers tables to
generate random numbers totaling to 150 between 1 and N. In the final step, the subscribers
whose assigned numbers correspond to the 150 random numbers generated in the fifth step are
identified and selected into the sample for the research.
The simple random sampling method’s equally likely chance approach is important in
eliminating bias in the research (Creswell, 2014). The method is also simple to perform making
simpler in both selecting the sample and computation in the analysis stage. However, the
approach is not cost effective and is likely to consume a lot of time especially in the listing stage
for the entire population.
Case 3
The systematic sampling method is an approach to sampling that is designing to address
clustered selection in sampling (Bernard, 2012). The systematic sampling method achieves this
by eliminating any chance of two consecutive items in a population being selected in the sample
(Saris & Gallhofer, 2014). This method introduces an interval after which an item is selected for
the sample. The interval, in this sampling method, ensures that there is not possibility of two
consecutive items being selected in the sample.
5
Evaluating Sampling Methods and Sample Size
There are three main steps involved in obtaining the final sample in the systematic
sampling method (Cao, Cox, & Eslick, 2016). The first step is interval determination, in which
the interval is obtained by dividing the population size by the sample size. This step is preceded
by the selection of the target population, identification of the population size (N) and
determination of the sample size (n). The interval is then given as i = N/n (Cao, Cox, & Eslick,
2016). The second step is identification of the starting point, which involves the selection of an
item in the population as the initial point to begin the sampling. This point has to be selected
randomly in order to prevent and emergence of bias in the sampling process. The final step
involves the actual sampling, by adding the interval i to the location of the initial item and
selecting the resultant item into the sample. This step is repeated until the sample size for the
research is satisfied.
In the context of case two, the first step would involve the determination of the interval
by dividing the total number of individuals that have subscribed to the trading publication, say N,
by the predetermined sample size of 250 subscribers. This would be given as interval, i = N/250.
In the second step, from the subscribers’ list for the trading publication, a starting point would be
randomly selected by randomly choosing a subscriber in the list. Finally, the third step would be
selecting the initial subscriber (selected as the starting point in the second step) into the sample,
then adding i = N/250 to the location of this subscriber in the list and selecting the subscriber in
the resulting location into the sample, and repeating the process until there are 250 subscribers
selected in the sample.
The random selection of the starting point and addressing clustered selection makes the
systematic sampling approach efficient in unbiased selection of items from a population into the
sample (George, Osinga, Lavie, & Scott, 2016). The systematic sampling method is also
6
⊘ This is a preview!⊘
Do you want full access?
Subscribe today to unlock all pages.
Trusted by 1+ million students worldwide
Evaluating Sampling Methods and Sample Size
reasonably simpler to conduct as well as cost effective. The method is however susceptible to
producing samples that are either under representative or over representative of the population
characteristics of interest in a study (George, Osinga, Lavie, & Scott, 2016).
Part 2
Question a
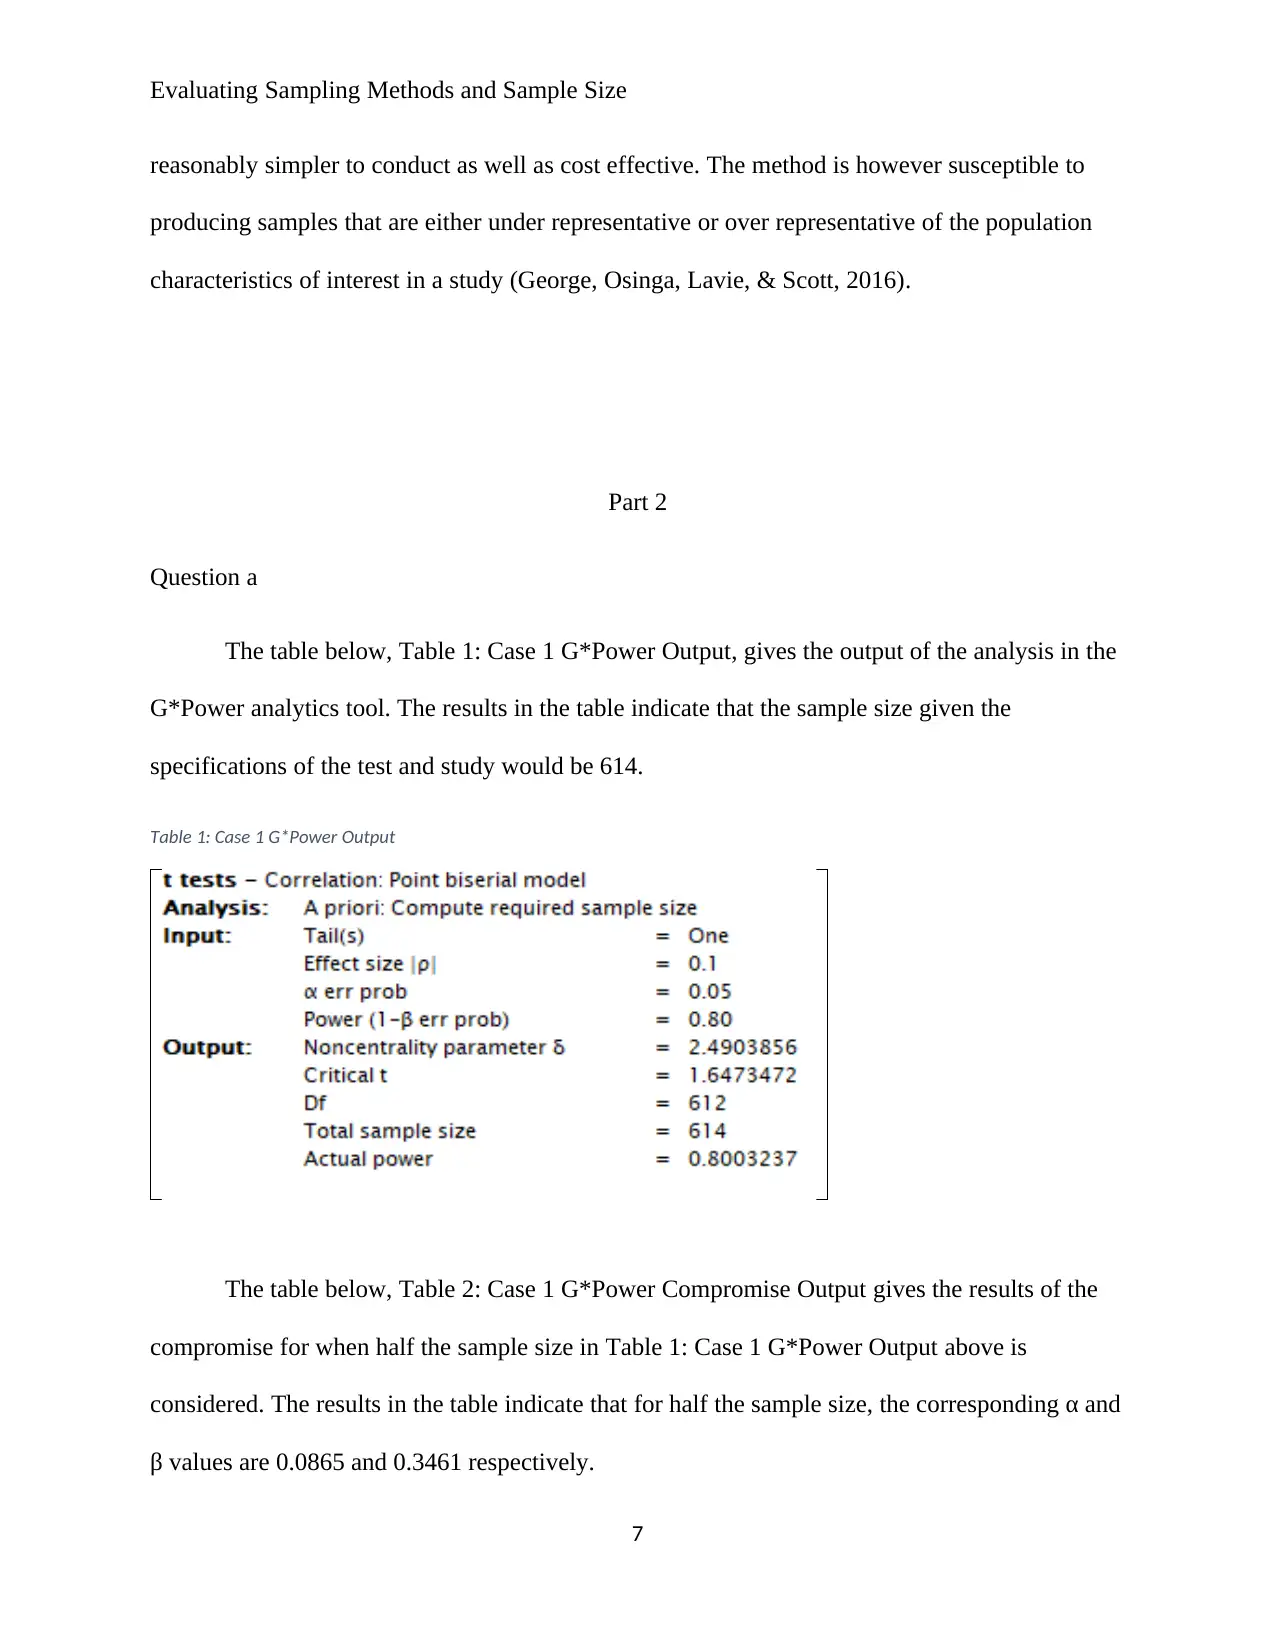
The table below, Table 1: Case 1 G*Power Output, gives the output of the analysis in the
G*Power analytics tool. The results in the table indicate that the sample size given the
specifications of the test and study would be 614.
Table 1: Case 1 G*Power Output
The table below, Table 2: Case 1 G*Power Compromise Output gives the results of the
compromise for when half the sample size in Table 1: Case 1 G*Power Output above is
considered. The results in the table indicate that for half the sample size, the corresponding α and
β values are 0.0865 and 0.3461 respectively.
7
reasonably simpler to conduct as well as cost effective. The method is however susceptible to
producing samples that are either under representative or over representative of the population
characteristics of interest in a study (George, Osinga, Lavie, & Scott, 2016).
Part 2
Question a
The table below, Table 1: Case 1 G*Power Output, gives the output of the analysis in the
G*Power analytics tool. The results in the table indicate that the sample size given the
specifications of the test and study would be 614.
Table 1: Case 1 G*Power Output
The table below, Table 2: Case 1 G*Power Compromise Output gives the results of the
compromise for when half the sample size in Table 1: Case 1 G*Power Output above is
considered. The results in the table indicate that for half the sample size, the corresponding α and
β values are 0.0865 and 0.3461 respectively.
7
Paraphrase This Document
Need a fresh take? Get an instant paraphrase of this document with our AI Paraphraser
Evaluating Sampling Methods and Sample Size
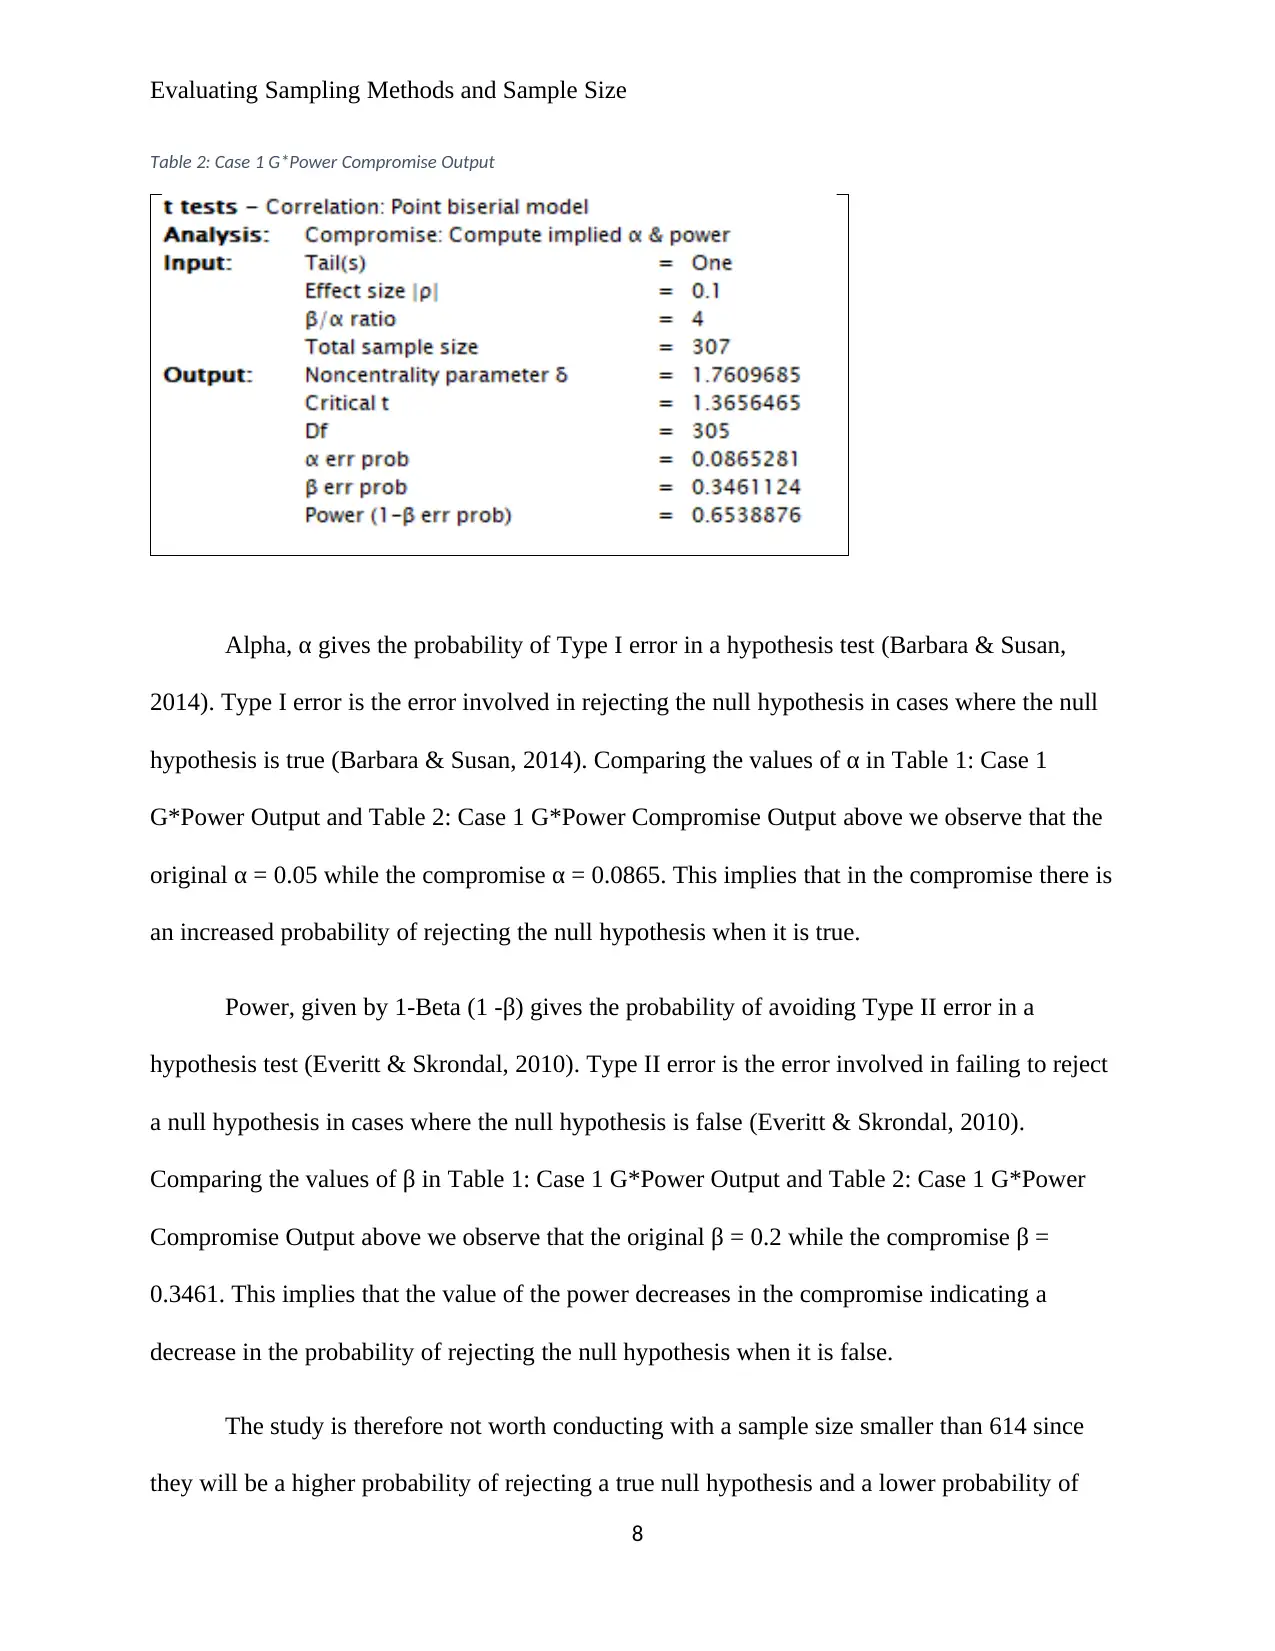
Table 2: Case 1 G*Power Compromise Output
Alpha, α gives the probability of Type I error in a hypothesis test (Barbara & Susan,
2014). Type I error is the error involved in rejecting the null hypothesis in cases where the null
hypothesis is true (Barbara & Susan, 2014). Comparing the values of α in Table 1: Case 1
G*Power Output and Table 2: Case 1 G*Power Compromise Output above we observe that the
original α = 0.05 while the compromise α = 0.0865. This implies that in the compromise there is
an increased probability of rejecting the null hypothesis when it is true.
Power, given by 1-Beta (1 -β) gives the probability of avoiding Type II error in a
hypothesis test (Everitt & Skrondal, 2010). Type II error is the error involved in failing to reject
a null hypothesis in cases where the null hypothesis is false (Everitt & Skrondal, 2010).
Comparing the values of β in Table 1: Case 1 G*Power Output and Table 2: Case 1 G*Power
Compromise Output above we observe that the original β = 0.2 while the compromise β =
0.3461. This implies that the value of the power decreases in the compromise indicating a
decrease in the probability of rejecting the null hypothesis when it is false.
The study is therefore not worth conducting with a sample size smaller than 614 since
they will be a higher probability of rejecting a true null hypothesis and a lower probability of
8
Evaluating Sampling Methods and Sample Size
rejecting a false null hypothesis. To make the small sample size workable, they will be a
compromise on the power of the test, settling with a lower probability to reject a false null
hypothesis. A compromise will also have to be made on the study design, with the inclusion of
stratification necessary (Lisa, 2017).
Question b
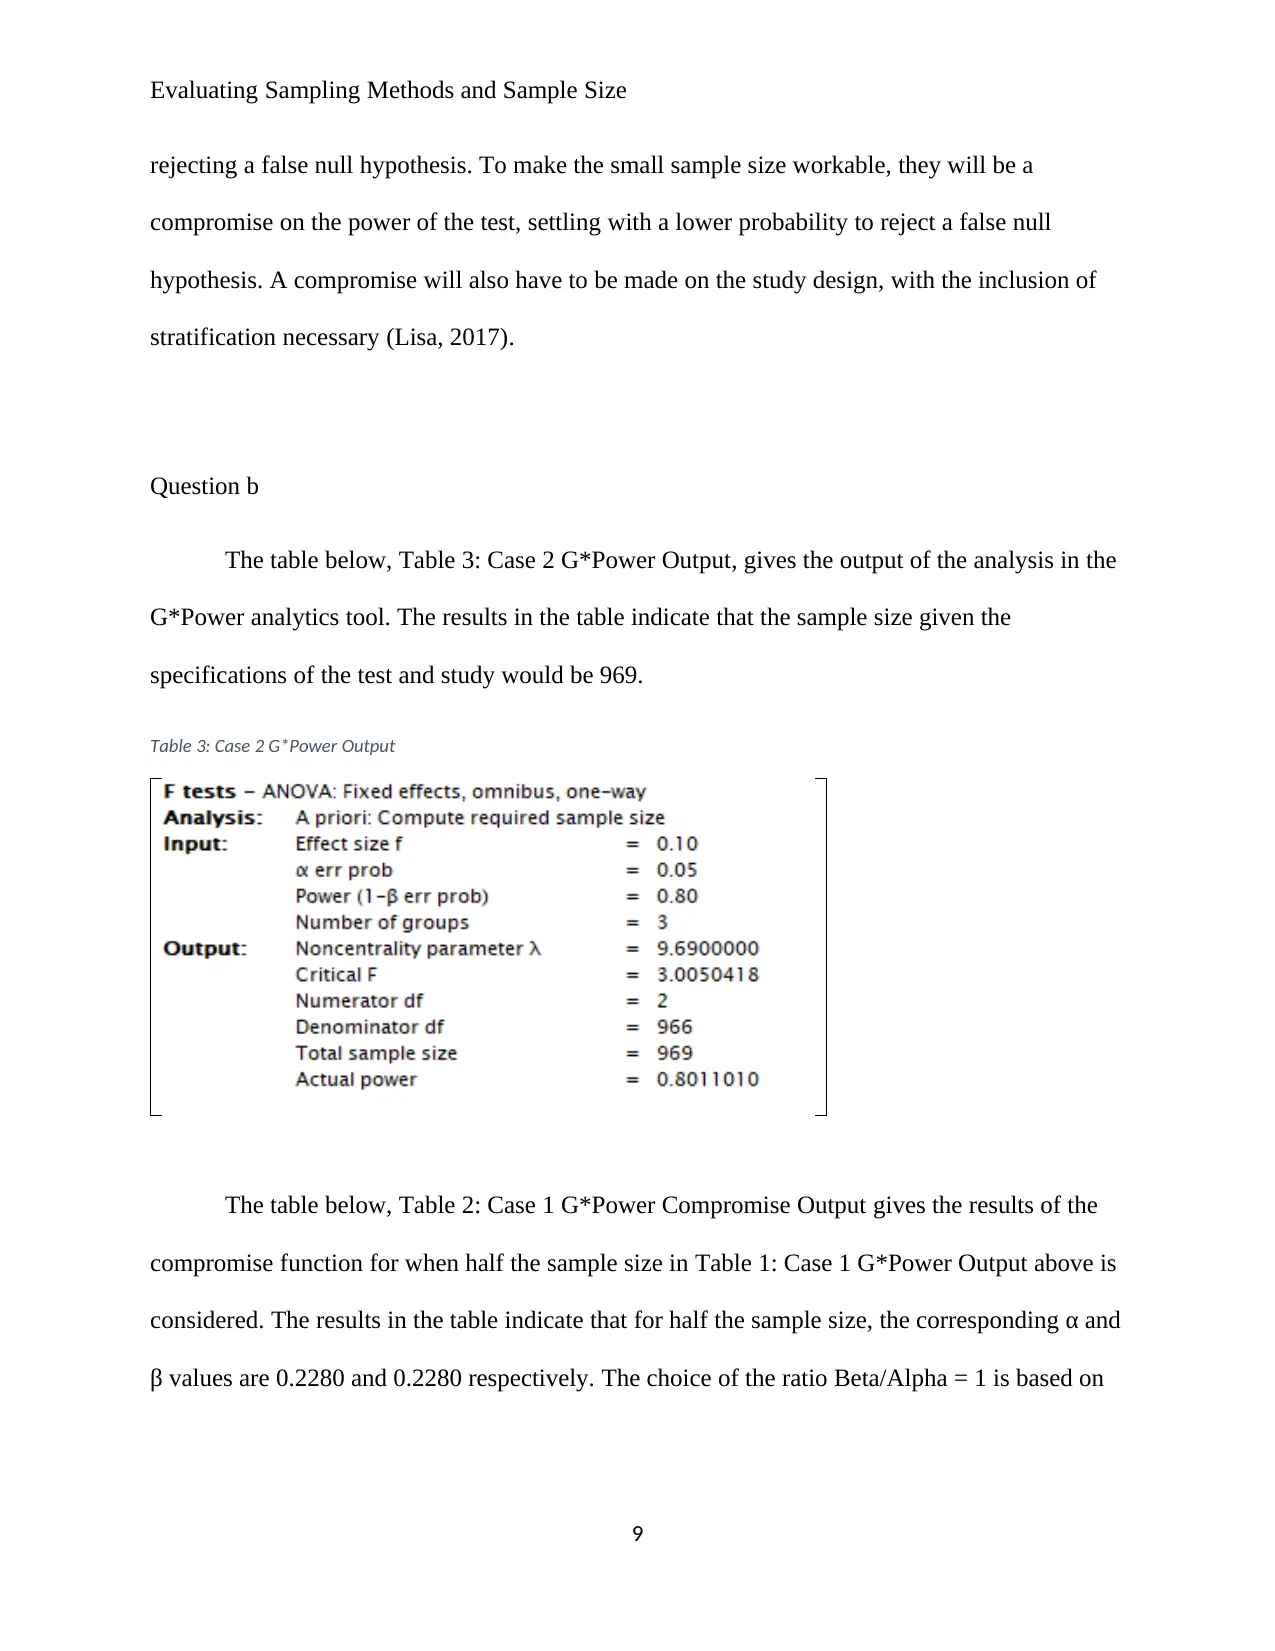
The table below, Table 3: Case 2 G*Power Output, gives the output of the analysis in the
G*Power analytics tool. The results in the table indicate that the sample size given the
specifications of the test and study would be 969.
Table 3: Case 2 G*Power Output
The table below, Table 2: Case 1 G*Power Compromise Output gives the results of the
compromise function for when half the sample size in Table 1: Case 1 G*Power Output above is
considered. The results in the table indicate that for half the sample size, the corresponding α and
β values are 0.2280 and 0.2280 respectively. The choice of the ratio Beta/Alpha = 1 is based on
9
rejecting a false null hypothesis. To make the small sample size workable, they will be a
compromise on the power of the test, settling with a lower probability to reject a false null
hypothesis. A compromise will also have to be made on the study design, with the inclusion of
stratification necessary (Lisa, 2017).
Question b
The table below, Table 3: Case 2 G*Power Output, gives the output of the analysis in the
G*Power analytics tool. The results in the table indicate that the sample size given the
specifications of the test and study would be 969.
Table 3: Case 2 G*Power Output
The table below, Table 2: Case 1 G*Power Compromise Output gives the results of the
compromise function for when half the sample size in Table 1: Case 1 G*Power Output above is
considered. The results in the table indicate that for half the sample size, the corresponding α and
β values are 0.2280 and 0.2280 respectively. The choice of the ratio Beta/Alpha = 1 is based on
9
⊘ This is a preview!⊘
Do you want full access?
Subscribe today to unlock all pages.
Trusted by 1+ million students worldwide
Evaluating Sampling Methods and Sample Size
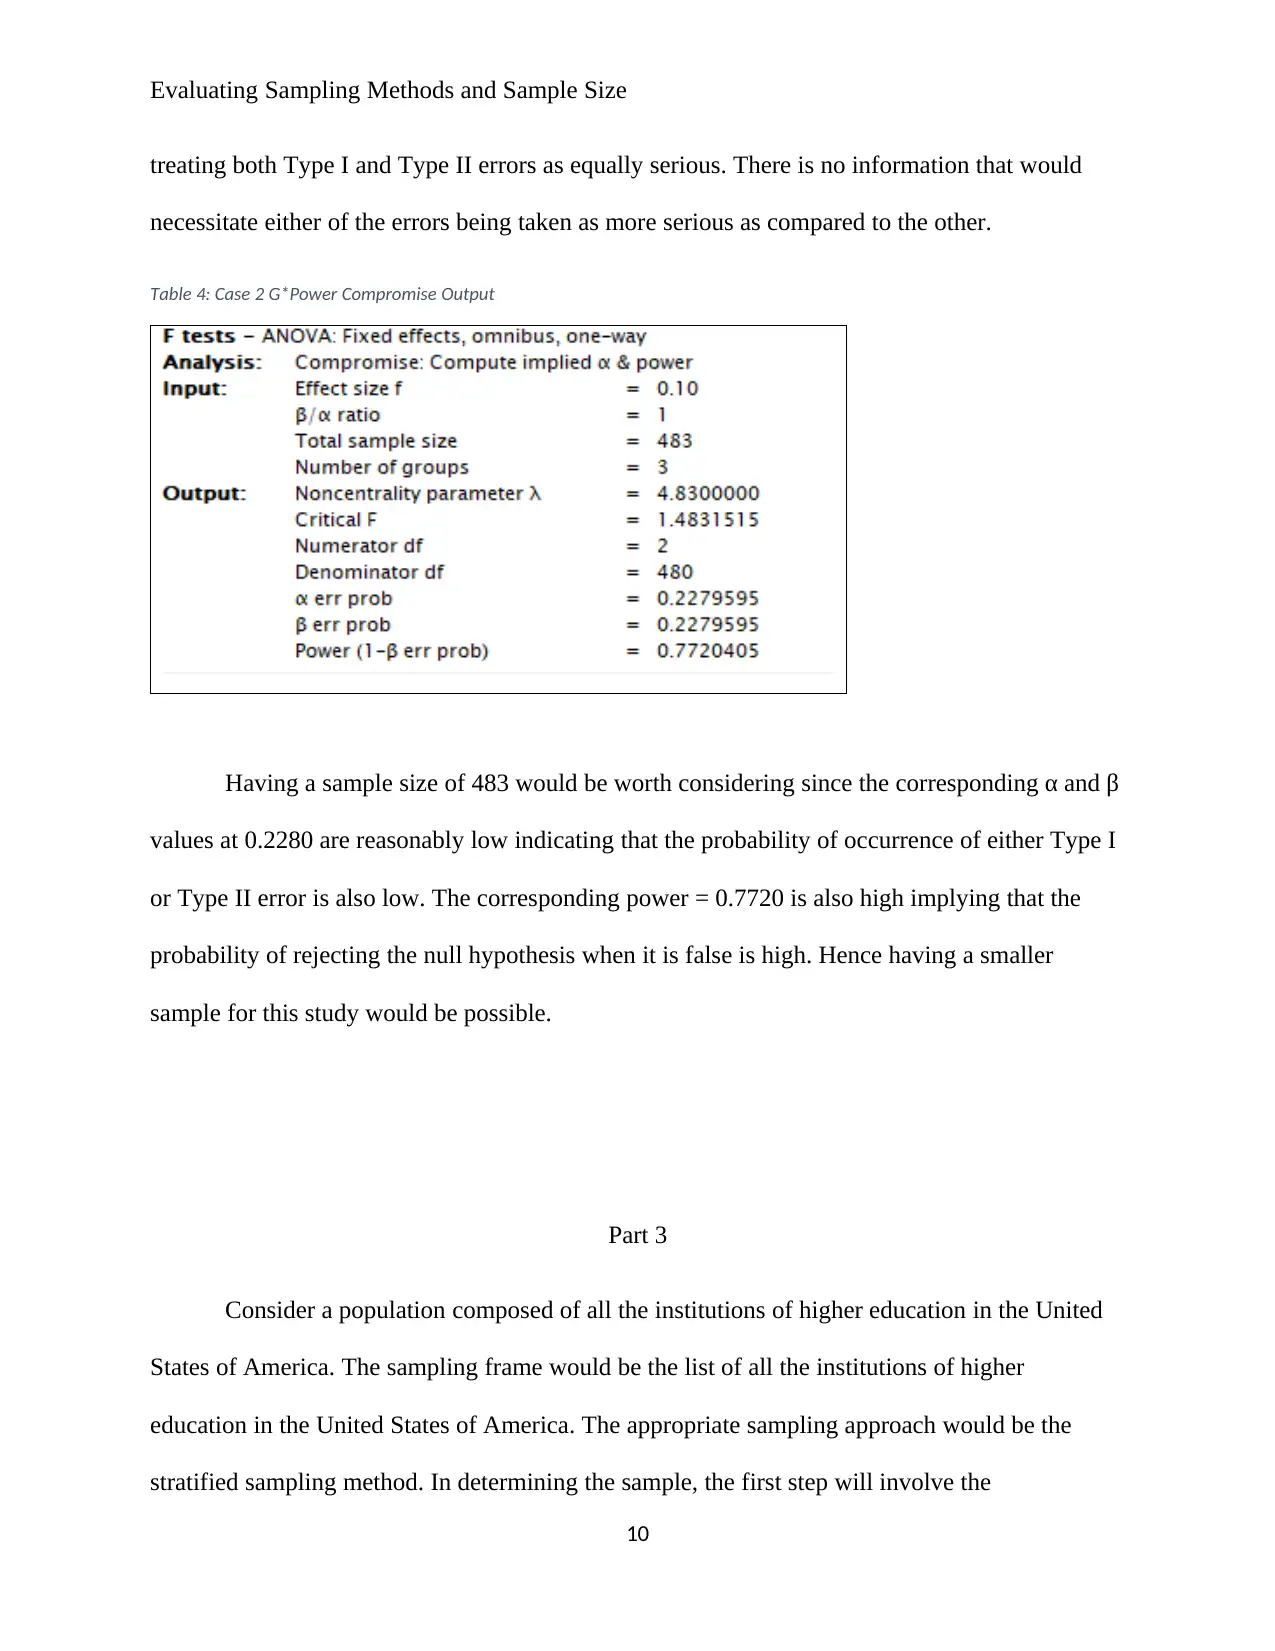
treating both Type I and Type II errors as equally serious. There is no information that would
necessitate either of the errors being taken as more serious as compared to the other.
Table 4: Case 2 G*Power Compromise Output
Having a sample size of 483 would be worth considering since the corresponding α and β
values at 0.2280 are reasonably low indicating that the probability of occurrence of either Type I
or Type II error is also low. The corresponding power = 0.7720 is also high implying that the
probability of rejecting the null hypothesis when it is false is high. Hence having a smaller
sample for this study would be possible.
Part 3
Consider a population composed of all the institutions of higher education in the United
States of America. The sampling frame would be the list of all the institutions of higher
education in the United States of America. The appropriate sampling approach would be the
stratified sampling method. In determining the sample, the first step will involve the
10
Paraphrase This Document
Need a fresh take? Get an instant paraphrase of this document with our AI Paraphraser

Evaluating Sampling Methods and Sample Size
identification of the possible subgroups for the institutions of higher education in the United
States of America. In this case, the groups from the Carnegie classification are going to be
considered for the subgroups. The resultant subgroups would therefore be; Tribal Universities,
Doctoral Universities, Special Focus Institutions, Master’s Colleges and Universities,
Baccalaureate Colleges, Associate’s Colleges and Baccalaureate/Associate’s Colleges (Carnegie
Classifications, 2020). These subgroups then form the strata for the sampling process for the
institutions of higher education in the United States of America. Random samples, of institutions,
of equal sizes will then be collected in each of these strata. Finally, the random samples of
institutions from each of the stratum are going to be combined together to form the sample for
the study.
11
Evaluating Sampling Methods and Sample Size
References
Babbie, E. R. (2010). The Practice of Social Research 12th edition (1st ed.). Belmont, CA:
Wadsworth Cengage.
Barbara, I., & Susan, D. (2014). Introductory Statistics (1st ed.). New York: OpenStax CNX.
Bernard, H. R. (2012). Social Research Methods: Qualitative and Quantitative Approaches (1st
ed.). New York: Sage.
Cao, A. M., Cox, M. R., & Eslick, G. D. (2016). Study Design in Evidence-Based Surgery. What
is The Role of Case-Control Studies? World Journal of Methodology. 6(1)., 101-104.
Carnegie Classifications. (2020). Basic Classification. Retrieved from
https://carnegieclassifications.iu.edu/classification_descriptions/basic.php
Creswell, J. W. (2014). Research Design: Qualitative, Quantitative and Mixed Approaches (4th
ed.). Michigan: SAGE Publications, Inc.
Everitt, B. S., & Skrondal, A. (2010). Cambridge Dictionary of Statistics (4th ed.). London:
Cambridge University Press.
George, G., Osinga, E. C., Lavie, D., & Scott, B. A. (2016). Big data and data science methods
for management research. Academy of Management Journal, 59(5), 1493-1507.
Lance, P., & Hattori, A. (2016). Sampling and Evaluation: A Guide To Sampling for Program
Impact Evaluation. Measure Evaluation, 6-8. London.
Lisa, M. P. (2017). A Framework for Determining Research Credibility. Crimson Publishers,
1(1), 1-4.
12
⊘ This is a preview!⊘
Do you want full access?
Subscribe today to unlock all pages.
Trusted by 1+ million students worldwide
1 out of 13
Related Documents


Your All-in-One AI-Powered Toolkit for Academic Success.
+13062052269
info@desklib.com
Available 24*7 on WhatsApp / Email
![[object Object]](/_next/static/media/star-bottom.7253800d.svg)
Unlock your academic potential
Copyright © 2020–2026 A2Z Services. All Rights Reserved. Developed and managed by ZUCOL.