Samsung Australia Business Intelligence Dashboard Evaluation Report
VerifiedAdded on 2023/04/19
|18
|3090
|265
Report
AI Summary
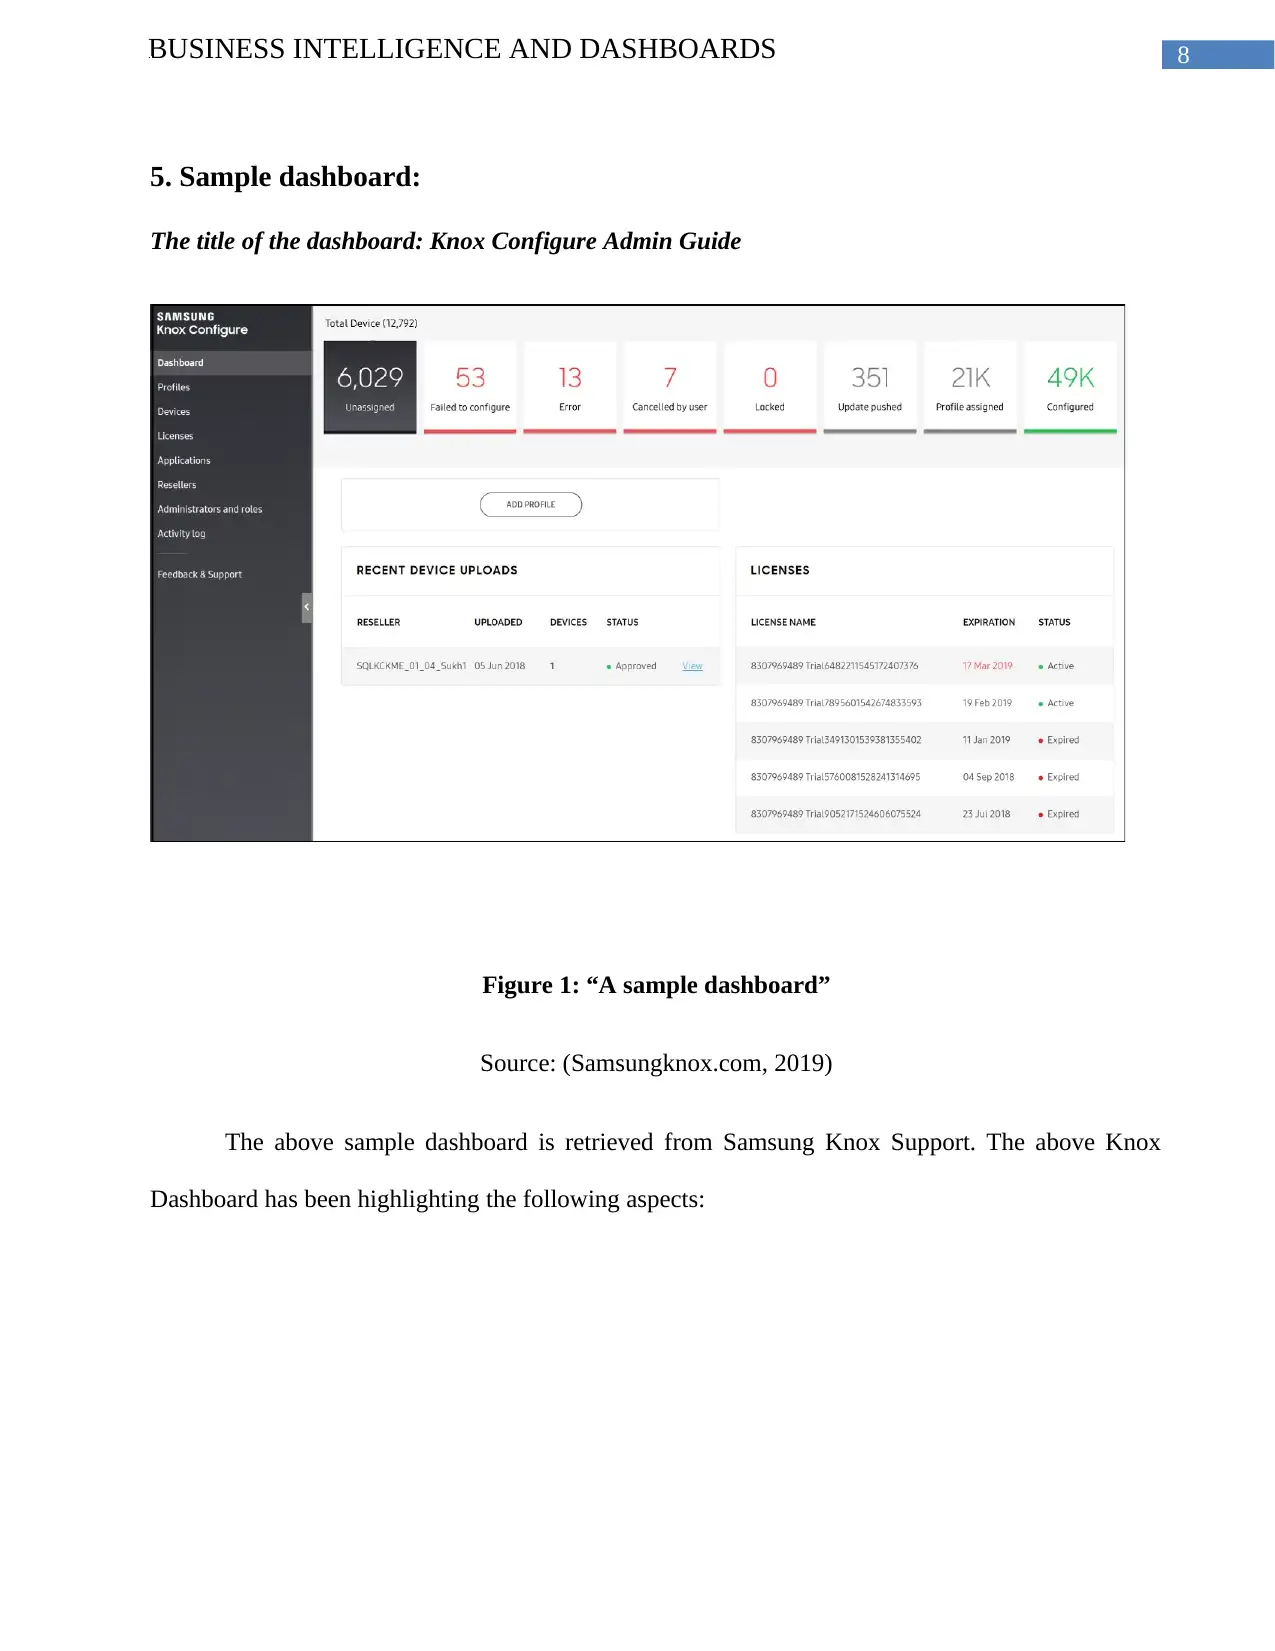
This report provides an evaluation of Samsung Australia's business intelligence dashboards, focusing on key organizational priorities such as reducing GHG emissions, financial strategy, and operations management. It explores questions that dashboards should answer, including tracking KPIs and business performance, and examines various data sources used by Samsung. A sample dashboard from Samsung Knox Support is analyzed, highlighting aspects like total devices managed, profile assignments, and configuration trends. The report also identifies potential issues and challenges related to dashboard design and implementation, such as failing to define the purpose, offering too much data, failing to automate data feeds, displaying unclear metrics, creating similar dashboards for various users, misusing colors, and providing no context. This comprehensive analysis offers insights into improving Samsung's business intelligence capabilities through effective dashboard design and data management, providing a detailed overview of the current state and potential areas for enhancement. Desklib provides access to similar solved assignments and study resources for students.

Running head: BUSINESS INTELLIGENCE AND DASHBOARDS
Business Intelligence and dashboards
(Samsung)
Name of the student:
Name of the university:
Author Note
Business Intelligence and dashboards
(Samsung)
Name of the student:
Name of the university:
Author Note
Secure Best Marks with AI Grader
Need help grading? Try our AI Grader for instant feedback on your assignments.

1BUSINESS INTELLIGENCE AND DASHBOARDS
Executive summary
Here, in the report, the dashboard of Samsung Australia is evaluated. This is done through making a
discussion on key priorities. Apart from this various queries on the dashboards are analyzed. At last
the issues with the dashboard are identified here.
Executive summary
Here, in the report, the dashboard of Samsung Australia is evaluated. This is done through making a
discussion on key priorities. Apart from this various queries on the dashboards are analyzed. At last
the issues with the dashboard are identified here.

2BUSINESS INTELLIGENCE AND DASHBOARDS
Table of Contents
1. Introduction:......................................................................................................................................3
2. Explanation and description of the key priority:...............................................................................3
3. Questions to be answered by dashboards:.........................................................................................4
4. Data and data sources:.......................................................................................................................5
5. Sample dashboard:.............................................................................................................................7
6. Potential issues and challenges:.......................................................................................................11
7. Conclusion:......................................................................................................................................13
8. References:......................................................................................................................................14

3BUSINESS INTELLIGENCE AND DASHBOARDS
1. Introduction:
The business intelligence is the process which is technology-driven. This is to assess
information and present actionable data. This is to help the executives, managers and various
additional end users to undertake important business decisions.
The Samsung Company is a significant organization at Australia that helps the users to find
broad categories of home electronics consisting of cutting-edge technology. This includes the home
appliances, TVs, Tablets, smartphones.
In this study the analysis of business intelligence at Samsung is understood through the key
priorities. Further, various questions that are to be answered by the dashboards are evaluated. Lastly,
the potential challenges and issues are analyzed here.
2. Explanation and description of the key priority:
Here, the organizational priorities of Samsung are identified.
First of all Samsung is involved in various aims to decrease the GHG emissions. The
company has acknowledged that the fight against the change of climate and additional international
problems are liable for the government and companies. Then there is financial strategy. For the
organization to remain on the suitable path economically, the strategy has been covering various
elements. These are to provide with care consideration with effective monitoring (Hair et al. 2015).
Further, regarding operation management the organization has been performing various activities.
They are liable to manage the planning, amount of raw materials and goods and provide the stock of
distinctive records. Besides, they are liable for the direct usage of acquisition and financing. Lastly,
Secure Best Marks with AI Grader
Need help grading? Try our AI Grader for instant feedback on your assignments.

4BUSINESS INTELLIGENCE AND DASHBOARDS
they are also liable for managing the business consistently with marketing departments, sales and
supply chains (Bacic 2017).
Thus the strategy of Samsung has been to form the plans in producing the products. This
must attract the attention of public and announcing the unseen product line. Besides, the most
important priority is to keep the organization reliable and stable. This is because its aims are to
provide higher quality of products consisting of flexibility as the usages and functions are
considered.
3. Questions to be answered by dashboards:
The creation of the smart dashboard as per the best practices for designing the dashboard is
seen as the culmination of various types of comprehensive process of BI. This involves the
collection of requirements, creating data models and defining the KPIs. Thus the significance of the
suitable designing of dashboard is never meant to be understood (Lin et al. 2018). Besides, the
poorly developed dashboard of Samsung has been conveying the helpful data and various insights.
This has been making the data to be less comprehensible instead of its originality.
This tool is helpful in visually tracking, displaying and analyzing the KPIs, key data and
metrics for monitoring the business health, specific process and departments. Thus, they are been
customizable in meeting the particular necessities of the company and department. It is helpful to
connect the files beyond the scenes along with APIs, services, attachments and files (Amini, Akbari
and Pashootanizadeh 2016). However, over the surface it has been highlighting the data in table
format, bar charts, line charts and gauges. For Samsung, it is proved to be the smartest method of
tracking numerous information sources. This is because it has been providing the core location for
businesses. It is monitor and assess the performances. This the monitoring in real-time has decreased

5BUSINESS INTELLIGENCE AND DASHBOARDS
the time to assess along with long line of communication. It has been comprised of previously
problematic businesses. At first, the users has been knowing the definition of dashboard on the role
that it has been playing under Samsung. Al the users utilize the data in different manner (Wakeling
et al. 2015). However, all the business dashboards has been serving the similar purpose. It is the
cause why this crucial users has been understanding what type of KPIs could be tracked and the
reason behind that. Thus the most important dashboards to be answered are the following.
What are the types of business questions that can be answered by the dashboard?
What are the kinds of data that could be tracked over the dashboards?
In what way the dashboards are been interactive?
Here, the smarted data dashboards provides responses to the queries about Samsung’s business.
This is unlike the advanced tools of business intelligence and the dashboards are designed for fast
assessment and various types of un-formal awareness. This is the smartest approach in designing the
business dashboard. This deals with the effective question answer format. These includes:
What is the quick ratio? In what place is the quick ratio been compared to where it has been?
What number of calls has the call center of Samsung been performing this week? Is this less
or more as compared to the previous week?
What are the top products and opportunities in sales revenue?
What has been the traffic sources and rise in search?
What has been the marketing funnel look like and is that on the target?
4. Data and data sources:
These are demonstrated below:
Data item:

6BUSINESS INTELLIGENCE AND DASHBOARDS
For creating the data items, the needed field are chosen from the browser of data sources and
dropping that to roper sections in the area of data items. In order to eradicate and include the
items in data items, the DataDashboardItem.HiddenMeasures and
DataDashboardItem.HiddenDimensions properties are used. One can perform various actions
through the secrete data items (Yang et al. 2019). They include conditional formatting, Top N,
Sorting and Filtering.
Data sources:
For Samsung’s data sources the following types are supported.
The following data source types are supported.
SQL Data Source:
This permits the establishment of connections for different kinds of SQL databases and to
work with the data connected.
OLAP cubes:
This delivers the ability to connect to OLAP Cube and the database of Microsoft analysis
Services.
Excel data source:
This is utilized for selecting the data from CSV Files and Microsoft
Description:
Paraphrase This Document
Need a fresh take? Get an instant paraphrase of this document with our AI Paraphraser

7BUSINESS INTELLIGENCE AND DASHBOARDS
The data item is named as reading like sensor reading. The values of data items are
timestamped in sequences. The values of data items are utilized over custom objects and platform of
expression rules performing business logic.
The data item is named as reading like sensor reading. The values of data items are
timestamped in sequences. The values of data items are utilized over custom objects and platform of
expression rules performing business logic.

8BUSINESS INTELLIGENCE AND DASHBOARDS
5. Sample dashboard:
The title of the dashboard: Knox Configure Admin Guide
Figure 1: “A sample dashboard”
Source: (Samsungknox.com, 2019)
The above sample dashboard is retrieved from Samsung Knox Support. The above Knox
Dashboard has been highlighting the following aspects:
5. Sample dashboard:
The title of the dashboard: Knox Configure Admin Guide
Figure 1: “A sample dashboard”
Source: (Samsungknox.com, 2019)
The above sample dashboard is retrieved from Samsung Knox Support. The above Knox
Dashboard has been highlighting the following aspects:

9BUSINESS INTELLIGENCE AND DASHBOARDS
Total number of devices This lists the devices managed currently under the configure
console.
Unassigned This shows the overall number of devices includes to the console and
has been receiving the profile assignment.
Failed to configure This displays the overall devices assigned a profile of configuration
and failed prior finishing.
Error This shows the overall devices where the profile assignment has given
rise to the error and put the device under the state of error and await the
assistance of troubleshooting.
Cancelled by user This shows the overall amount of devices where the profile assignment
is cancelled by the admin prior finishing.
Updating the pushed This shows the overall amount of devices that has been successfully
receiving the profile push updating since the past trending period.
Profile assigned This lists the overall amount of devices receiving the profile
assignment in successful manner despite any error or cancelation.
Configured This highlights the overall newly configured devices from the past
period of trending.
From the mid portion of the Dashboard it is seen that the device uploads and current profiles
are identified.
The area is been colour coded and can simply determine the problems needs the
administration for the configuration failure and uploaded error.
Secure Best Marks with AI Grader
Need help grading? Try our AI Grader for instant feedback on your assignments.

10BUSINESS INTELLIGENCE AND DASHBOARDS
In the current uploads of the recent device area, there is the displaying of current uploads by
the RESLLERS and the device date UPLPOADED, along with amount of uploaded DEVICES by
every reseller and the STATUS upload.
The license area reviews the available KNOX Configure license resources. This can be done
through STATUS, EXPIRATION and LICENSE NAME.

11BUSINESS INTELLIGENCE AND DASHBOARDS
The configured trend graph can be considered. At the bottom of the dashboard is filtering of
the amount of configured profiles that are reviewed and displayed at the administrator intervals of
definition. Utilizing the display menus of drop down a specific profile can be selected with every
profiles. They should be defining whether the graph has been displaying the monthly, weekly and
daily view. This depends of configuration tasks that is been historically dispersed. As the period of
trending is chosen, the display can be refined through the period calendar setting for drilling down to
particular time of activities of profile configuration.

12BUSINESS INTELLIGENCE AND DASHBOARDS
6. Potential issues and challenges:
Failing to define the purpose of dashboard:
Here, the issues can occur as Samsung fails to define the purpose of the dashboard. Besides,
dashboard can be created that has been failing to serve numerous reasons (Zimmerman and Vatrapu
2015).
Offering much data:
This is the common issue that can be found in the dashboard of Samsung’s business. Instead
of going for the vital metrics, Samsung can try to cram the overwhelming quantity of data under a
single dashboard.
Failure to automate the feeds of data:
The dashboard requires the current and clean data. As one feed the old data on the dashboard,
Samsung is better off not in creating the one at the initial place. This led to unsmarts decisions and
can be abandoned eventually (Rahman, Adamu and Harun 2017). Apart from this, the businesses has
been making that mistake. This is helpful for them to design the dashboards having the assumptions
Paraphrase This Document
Need a fresh take? Get an instant paraphrase of this document with our AI Paraphraser

13BUSINESS INTELLIGENCE AND DASHBOARDS
that the information can be manually upgraded. Though it has been working in short terms, this has
been a nightmare in long terms.
Displaying unclear metrics:
Any efficient dashboard is that can drive the business decision. However, too many amount
of noting just charts under one single page can be the design across the action.
Creating the similar dashboard for various users:
One single dashboard can never cover everything to every people. Thus many has been
making the mistakes to try the cram the dashboards full of data that has been applying to various
audiences. Prior creating the dashboard for team of users, proper research must be done. They must
understand the technical skill levels, needs and goals. Thus the dashboard has been creating the
focus on the user group. However, this has not been sopping here. Various users under the similar
user group needs to make the dashboards get customized in various manners. Further, some has
expected to fetch distinct set of data. Moreover, other people has been needing the dashboard to be
formatted in distinct manner. It generates high issues and not been addressing from the beginning.
Misusing colours:
As used properly, the colour is considered as the powerful tool for the dashboards. This is
helpful for the users to determine the bad and good trends at one glance instead of the necessity to
analyse the data point. Here, the issue is the colour can be misused. While utilized improperly, the
colour can never distract from dashboard and turn that to be more confusing.

14BUSINESS INTELLIGENCE AND DASHBOARDS
Providing no contexts:
Here, the common error with the dashboard has been revolving across the lack of contents. It
must be reminded that in spite any context the data indicates nothing. For instance, let there is a chart
that lists all the rates of website conversion. This reveals what amount of percentage the visitors of
the website is purchased in the product. It must be also supposed that the rate of conversion is 10%.
This is abnormally higher conversion rates. Instead of the context in the dashboard, one is unable to
answer the question.
7. Conclusion:
It is seen that relying on the goal of the dashboard of Samsung, the business scan fix the
operational and analytical dashboard. It is vital to find out the reason of the dashboard assuring that
the audience receives the maximum of data. Apart from this all the areas of the business requires to
fetch the metric specific for the initiates. Samsung can assure that once they are planning the
business dashboard one must consider the audience and that metrics has been best fitting the
necessities.

15BUSINESS INTELLIGENCE AND DASHBOARDS
8. References:
Amini, M.T., Akbari, M. and Pashootanizadeh, H., 2016. Business Strategic Control; Dynamic
Approach Application of Quality Function Deployment Method Based on The Balanced Scorecard
Dashboard. Journal of Administrative Management, Education and Training, 12(4), pp.156-170.
Bacic, D., 2017. Understanding business dashboard design user impact: triangulation approach using
eye-tracking, facial expression, galvanic skin response and EEG sensors.
Bordeleau, F.E., Mosconi, E. and Santa-Eulalia, L.A., 2018, January. Business Intelligence in
Industry 4.0: State of the art and research opportunities. In Proceedings of the 51st Hawaii
International Conference on System Sciences.
Breedvelt-Schouten, I.M., International Business Machines Corp, 2016. Pattern representation
images for business intelligence dashboard objects. U.S. Patent 9,240,061.
Brugler, T.S., Conzola, V.C., Craig, R.A., Eischeid, T.M. and Molander, M.E., International
Business Machines Corp, 2015. Displaying computer dashboard information. U.S. Patent 9,218,676.
Calof, J., Richards, G. and Smith, J., 2015. Foresight, competitive intelligence and business analytics
—tools for making industrial programmes more efficient. Форсайт, 9(1 (eng)).
Hair Jr, J.F., Wolfinbarger, M., Money, A.H., Samouel, P. and Page, M.J., 2015. Essentials of
business research methods. Routledge.
Laursen, G.H. and Thorlund, J., 2016. Business analytics for managers: Taking business intelligence
beyond reporting. John Wiley & Sons.
Secure Best Marks with AI Grader
Need help grading? Try our AI Grader for instant feedback on your assignments.

16BUSINESS INTELLIGENCE AND DASHBOARDS
Lin, C.Y., Liang, F.W., Li, S.T. and Lu, T.H., 2018. 5S Dashboard Design Principles For Self-
service Business Intelligence Tool Users. Journal of Big Data Research, 1(1), p.5.
Madni, A.M., Richey, M., Ordoukhanian, E., Venkatesh, J., Zender, F. and Chang, K., 2016.
Exploiting storytelling in collaborative systems engineering: towards a smart experiential dashboard.
In Conference on Systems Engineering Research Hunstville, Alabama.
Rahman, A.A., Adamu, Y.B. and Harun, P., 2017, July. Review on dashboard application from
managerial perspective. In 2017 International Conference on Research and Innovation in
Information Systems (ICRIIS) (pp. 1-5). IEEE.
Samsungknox.com. (2019). Knox Configure | Configure mobile device settings in bulk. [online]
Available at: https://www.samsungknox.com/en/solutions/it-solutions/knox-configure [Accessed 25
Mar. 2019].
Scholtz, B., Calitz, A. and Haupt, R., 2018. A business intelligence framework for sustainability
information management in higher education. International Journal of Sustainability in Higher
Education, 19(2), pp.266-290.
Wakeling, S., Clough, P.D., Wyper, J. and Balmain, A., 2015. Graph literacy and business
intelligence: Investigating user understanding of dashboard data visualizations. Business Intelligence
Journal, 20(4), pp.8-19.
Yang, N., Clements, J.V., Helmoski, R.D. and Casper, M.J., International Business Machines Corp,
2019. Dashboard generation based on user interaction. U.S. Patent Application 10/168,878.
Zimmerman, C. and Vatrapu, R., 2015, May. The Social Newsroom: Visual Analytics for Social
Business Intelligence. In International Conference on Design Science Research in Information
Systems (pp. 386-390). Springer, Cham.

17BUSINESS INTELLIGENCE AND DASHBOARDS
1 out of 18
Related Documents

Your All-in-One AI-Powered Toolkit for Academic Success.
+13062052269
info@desklib.com
Available 24*7 on WhatsApp / Email
Unlock your academic potential
© 2024 | Zucol Services PVT LTD | All rights reserved.