Samsung: Business Intelligence Report on Production Cost Reduction
VerifiedAdded on 2023/04/20
|15
|2706
|100
Report
AI Summary
This report focuses on Samsung's key priority: reducing production costs. It provides an executive summary, outlining the need for cost reduction and demonstrating how business intelligence can assist in achieving this goal. The report addresses questions a CEO might have regarding production, such as optimal location and employee productivity. It details data items, sources, and a sample dashboard to visualize production volume, costs, and maintenance expenses. The report explores potential challenges like real-time data availability and data integration, while also highlighting the benefits of using a dashboard for monitoring business decisions and identifying areas for improvement. The conclusion emphasizes the importance of implementing dashboards for data-driven decision-making, employee productivity and cost reduction.
0
Running head: BUSINESS INTELLIGENCE
BUSINESS INTELLIGENCE
Student’s Name
University Name
Author note
Running head: BUSINESS INTELLIGENCE
BUSINESS INTELLIGENCE
Student’s Name
University Name
Author note
Paraphrase This Document
Need a fresh take? Get an instant paraphrase of this document with our AI Paraphraser
1
BUSINESS INTELLIGENCE
Executive summary
The key priority for the chosen organization, Samsung is how to reduce the
production cost. The assignment provides an overview of the key priority and demonstrates to
the CEO of the organization. It demonstrates the needs of the company and provides an
overview of the key priority that is reduction of production costs. The overview prioritizes
the needs of the organization. The assignment explains and answers the questions of the
dashboard. This questions and answers would help the CEO to understand and plan the
priority of the organization. A table will be provided which includes the data items, sources
and provides descriptions of the data items. Sample dashboard is to be included in the
assignment which provides an idea to the CEO about the key priority. Further, the assignment
includes the potential challenges and issues that can be faced by the company on using
dashboard. Lastly, it concludes with the uses and effectiveness of the dashboard for the
business.
2
BUSINESS INTELLIGENCE
Table of Contents
Introduction................................................................................................................................3
Overview of key priority............................................................................................................4
Questions to be answered by Dashboard...................................................................................5
Data and data sources to tract production..................................................................................7
Sample dashboard......................................................................................................................8
Potential challenges and issues................................................................................................10
Conclusion................................................................................................................................12
References................................................................................................................................13
⊘ This is a preview!⊘
Do you want full access?
Subscribe today to unlock all pages.
Trusted by 1+ million students worldwide
3
BUSINESS INTELLIGENCE
Introduction
The key priority is how to reduce the production costs of the selected company,
Samsung. It demonstrates the needs of the company and provides an overview of the key
priority that is reduction of production costs. The overview prioritizes the needs of the
organization. Further the report, provides answers to the questions by dashboard, this will
help the CEO to understand the plan for the priority for reducing production cost. It identifies
the data sources which will allow answering the selected questions that has been discussed. A
sample dashboard has been provided in the report. Further, it provides explanation of the
potential challenges and issues which might be encountered. Lastly, it concludes and
summarizes the key points of the proposed dashboard which would be a solution for the
organization to pursue.
Paraphrase This Document
Need a fresh take? Get an instant paraphrase of this document with our AI Paraphraser
4
BUSINESS INTELLIGENCE
Overview of key priority
` The key priority is how to reduce the manufacturing cost of Samsung. Samsung can
adopt the lean manufacturing principles. Samsung can process the data generated at every
stage during the process of manufacturing. This will reduce waste, improve the efficiency of
the functioning and help the employees of the organization to run the activities and the
operations autonomously (Al-Aqrabi et al. 2015). In order to reduce the manufacturing cost
the company can eliminate the use of paper. The company can use various devices and
technologies which can store relevant data from the process of manufacturing. Eliminating
paper would help the organization to save time from having to record all the sales orders,
inventories and assets management. The company can use latest technologies and models
which can scan several data is less time and enabling the electronic data interchange in the
organization will help to reduce the repetitive entry of data and errors. Further, by managing
the inventory of the company efficiently, the company will be able to reduce the production
cost. Several uses of technologies will enable the company to save time and cost (Chang
2014). Such as inventory management software can ensure that enough inventories is
available and provide data which showcase, the emergency level of data thereby decreasing
the manufacturing cost.
The top priority of Samsung is to reduce the production cost. By implementing
predictive maintenance the company will be able to reduce its production costs. Models and
technology can be used to determine the potential equipment malfunctions of the organization
Continuous scanning and monitoring the performance of the activities and productions using
a device (Homann 2013). These measures will increase the manufacturing uptime and saves
the production costs of the company. Moreover, the company can replace incompetent
employees with proper compensation and replace them with machines and technologies.
5
BUSINESS INTELLIGENCE
These will enables the company to increased its production is lesser time and reduce the
production costs of the company (Kambatla 2014). The company could also implement
measures to increase the productivity of the employees. The company can tackles measures to
track the productivity of the employees and record data. This will help the company to
determine and access the work of the employee and thereby will reduce the production costs.
Samsung production is located in countries such as Vietnam, China, India, Brazil, Indonesia
and Korea. 50% of the Samsung mobile phones are manufactured in Vietnam. Vietnam is
best suited for Samsung production (Homann 2013). It is a prime location. It will be highly
effective to start its production there, as the demand is high with high population. Therefore it
will be beneficial to start its production in other regions (Chang 2014). This will help to
increase its production. The dashboard compares the production location and identifies the
best suited production location (Lim et al. 2013).
The company has to reduce the cost of materials as well in order to reduce the
manufacturing cost of the company. The company can utilize only fewer materials, only the
necessary ones to reduce the production costs. The company can reduce of materials while
producing a particular unit must be efficiently handled so that it does not affect or impact the
quality of the manufactured product (Rouse and Stedman 2014). It has to be analyzed that the
company reduce the materials in such as way, that it does not harm or effect the quality of the
product. The materials which do not directly contribute to the product can be easily reduced,
such as the packaging and the documentation Supervisor needs to ensure that the production
is performing well in the organization, by constant monitoring and over viewing the work
done by the employees. Supervisors would provide instant help and assistance to the workers
who require it. Utilizing the materials efficiently will reduce the cost of production
significantly. The company must utilize lean manufacturing principles in order to reduce the
manufacturing costs (Sarkar and Moon 2014). Utilizing lean manufacturing will enable the
⊘ This is a preview!⊘
Do you want full access?
Subscribe today to unlock all pages.
Trusted by 1+ million students worldwide
6
BUSINESS INTELLIGENCE
company to keep the costs of materials low. Other factors such as overproduction have to be
avoided at any cost, as overproduction of goods will not be sold in the market or has to be
sold at a lower price. This would affect the bottom line of the company. Moreover, the
company must take measures to reduce the overhead costs which are associated with the
running of the business activities, utilities, office supplies, building costs and insurance
coverage. This cost adds up to the production costs, therefore, it needs to be avoided (Brown
et al. 2017).
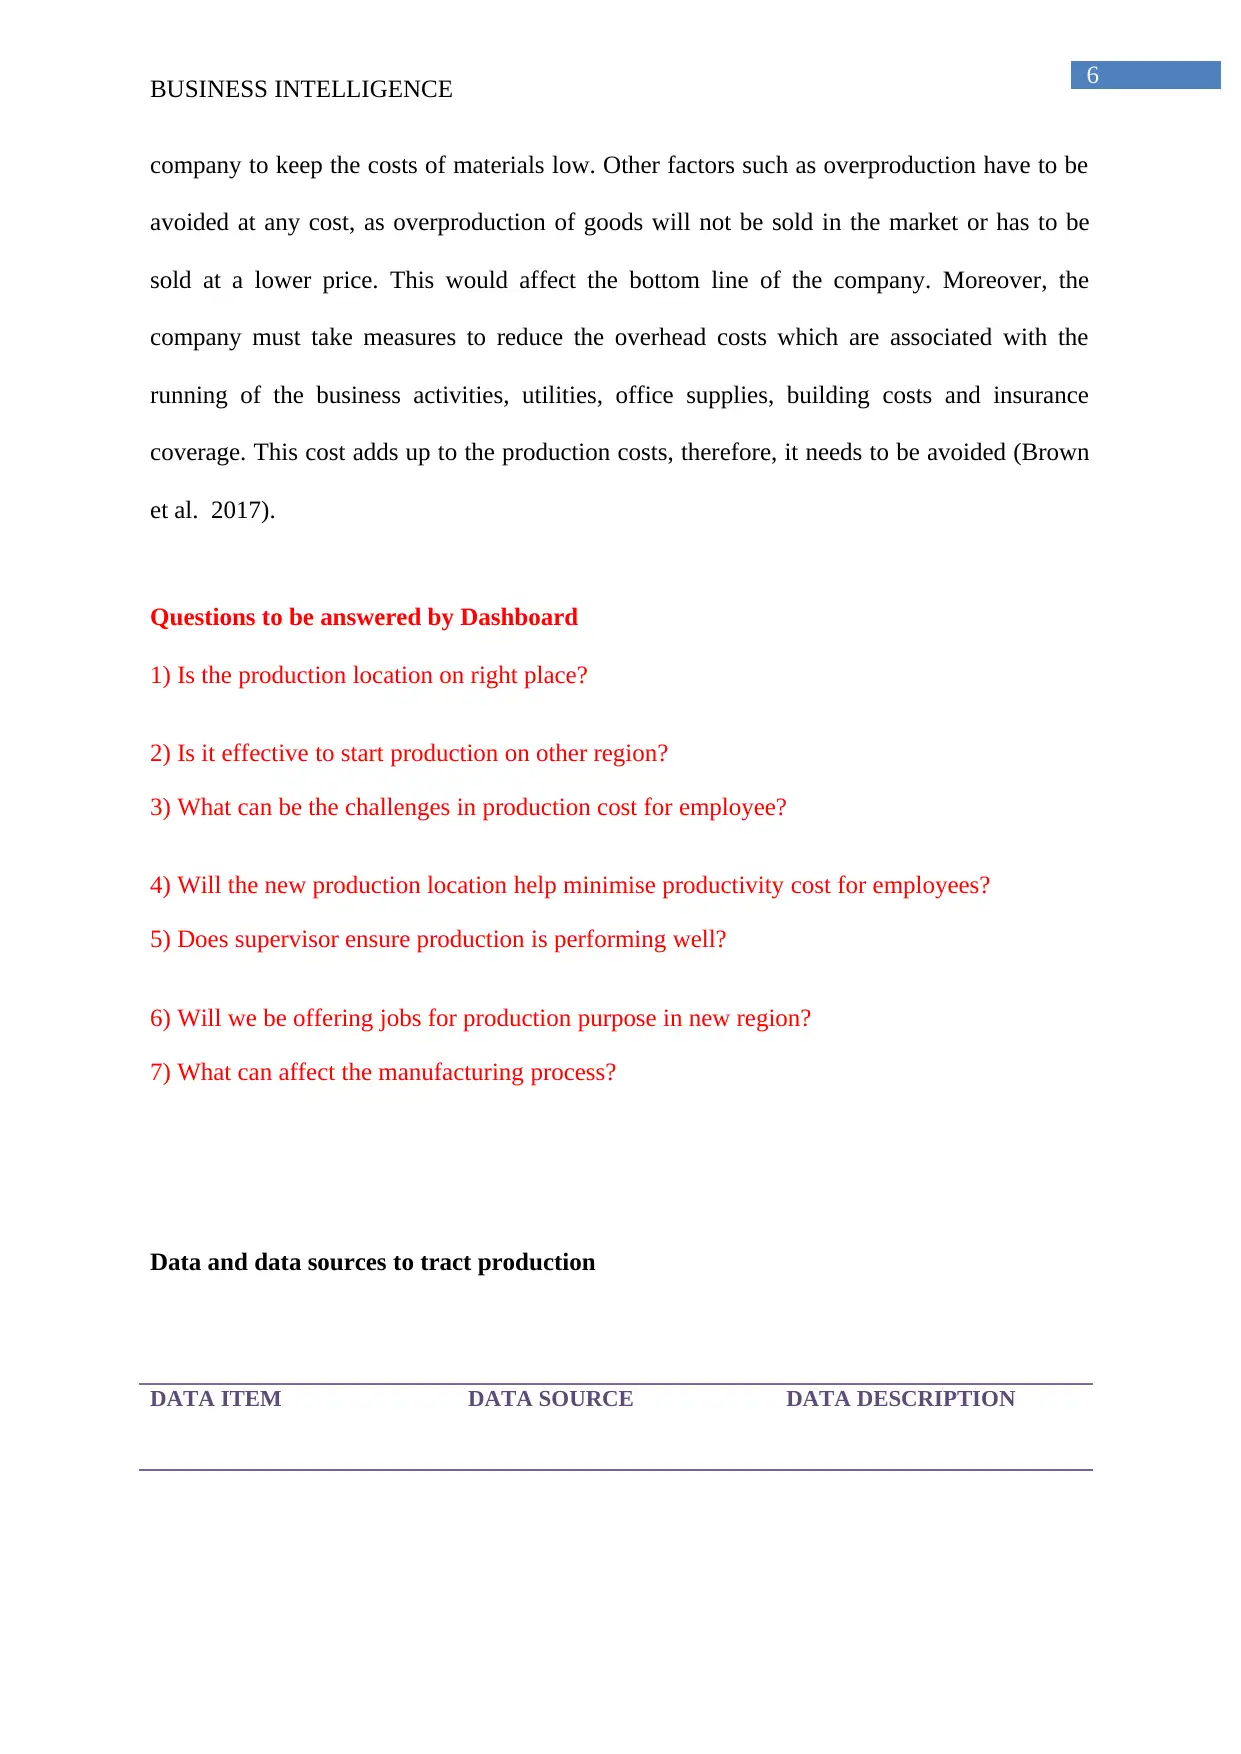
Questions to be answered by Dashboard
1) Is the production location on right place?
2) Is it effective to start production on other region?
3) What can be the challenges in production cost for employee?
4) Will the new production location help minimise productivity cost for employees?
5) Does supervisor ensure production is performing well?
6) Will we be offering jobs for production purpose in new region?
7) What can affect the manufacturing process?
Data and data sources to tract production
DATA ITEM DATA SOURCE DATA DESCRIPTION
BUSINESS INTELLIGENCE
company to keep the costs of materials low. Other factors such as overproduction have to be
avoided at any cost, as overproduction of goods will not be sold in the market or has to be
sold at a lower price. This would affect the bottom line of the company. Moreover, the
company must take measures to reduce the overhead costs which are associated with the
running of the business activities, utilities, office supplies, building costs and insurance
coverage. This cost adds up to the production costs, therefore, it needs to be avoided (Brown
et al. 2017).
Questions to be answered by Dashboard
1) Is the production location on right place?
2) Is it effective to start production on other region?
3) What can be the challenges in production cost for employee?
4) Will the new production location help minimise productivity cost for employees?
5) Does supervisor ensure production is performing well?
6) Will we be offering jobs for production purpose in new region?
7) What can affect the manufacturing process?
Data and data sources to tract production
DATA ITEM DATA SOURCE DATA DESCRIPTION
Paraphrase This Document
Need a fresh take? Get an instant paraphrase of this document with our AI Paraphraser
7
BUSINESS INTELLIGENCE
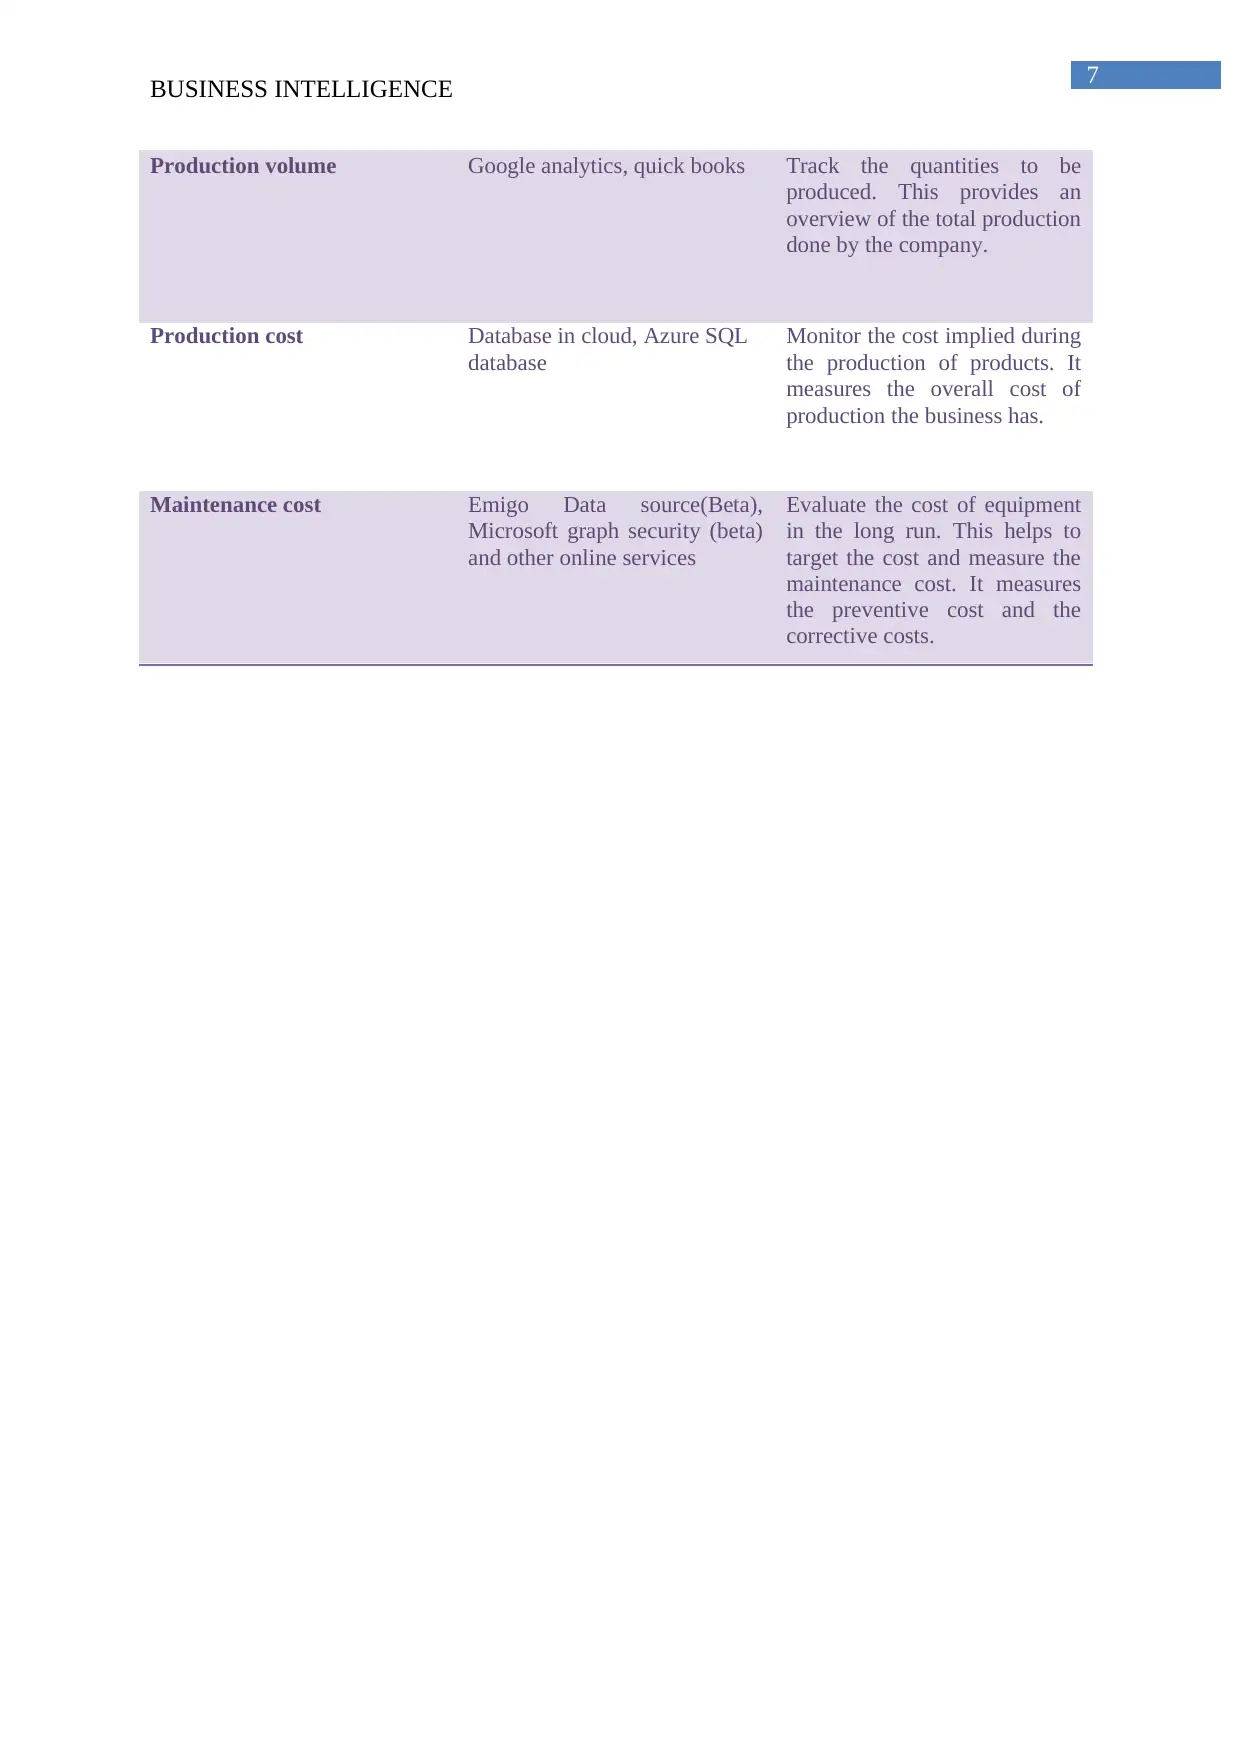
Production volume Google analytics, quick books Track the quantities to be
produced. This provides an
overview of the total production
done by the company.
Production cost Database in cloud, Azure SQL
database
Monitor the cost implied during
the production of products. It
measures the overall cost of
production the business has.
Maintenance cost Emigo Data source(Beta),
Microsoft graph security (beta)
and other online services
Evaluate the cost of equipment
in the long run. This helps to
target the cost and measure the
maintenance cost. It measures
the preventive cost and the
corrective costs.
BUSINESS INTELLIGENCE
Production volume Google analytics, quick books Track the quantities to be
produced. This provides an
overview of the total production
done by the company.
Production cost Database in cloud, Azure SQL
database
Monitor the cost implied during
the production of products. It
measures the overall cost of
production the business has.
Maintenance cost Emigo Data source(Beta),
Microsoft graph security (beta)
and other online services
Evaluate the cost of equipment
in the long run. This helps to
target the cost and measure the
maintenance cost. It measures
the preventive cost and the
corrective costs.
8
BUSINESS INTELLIGENCE
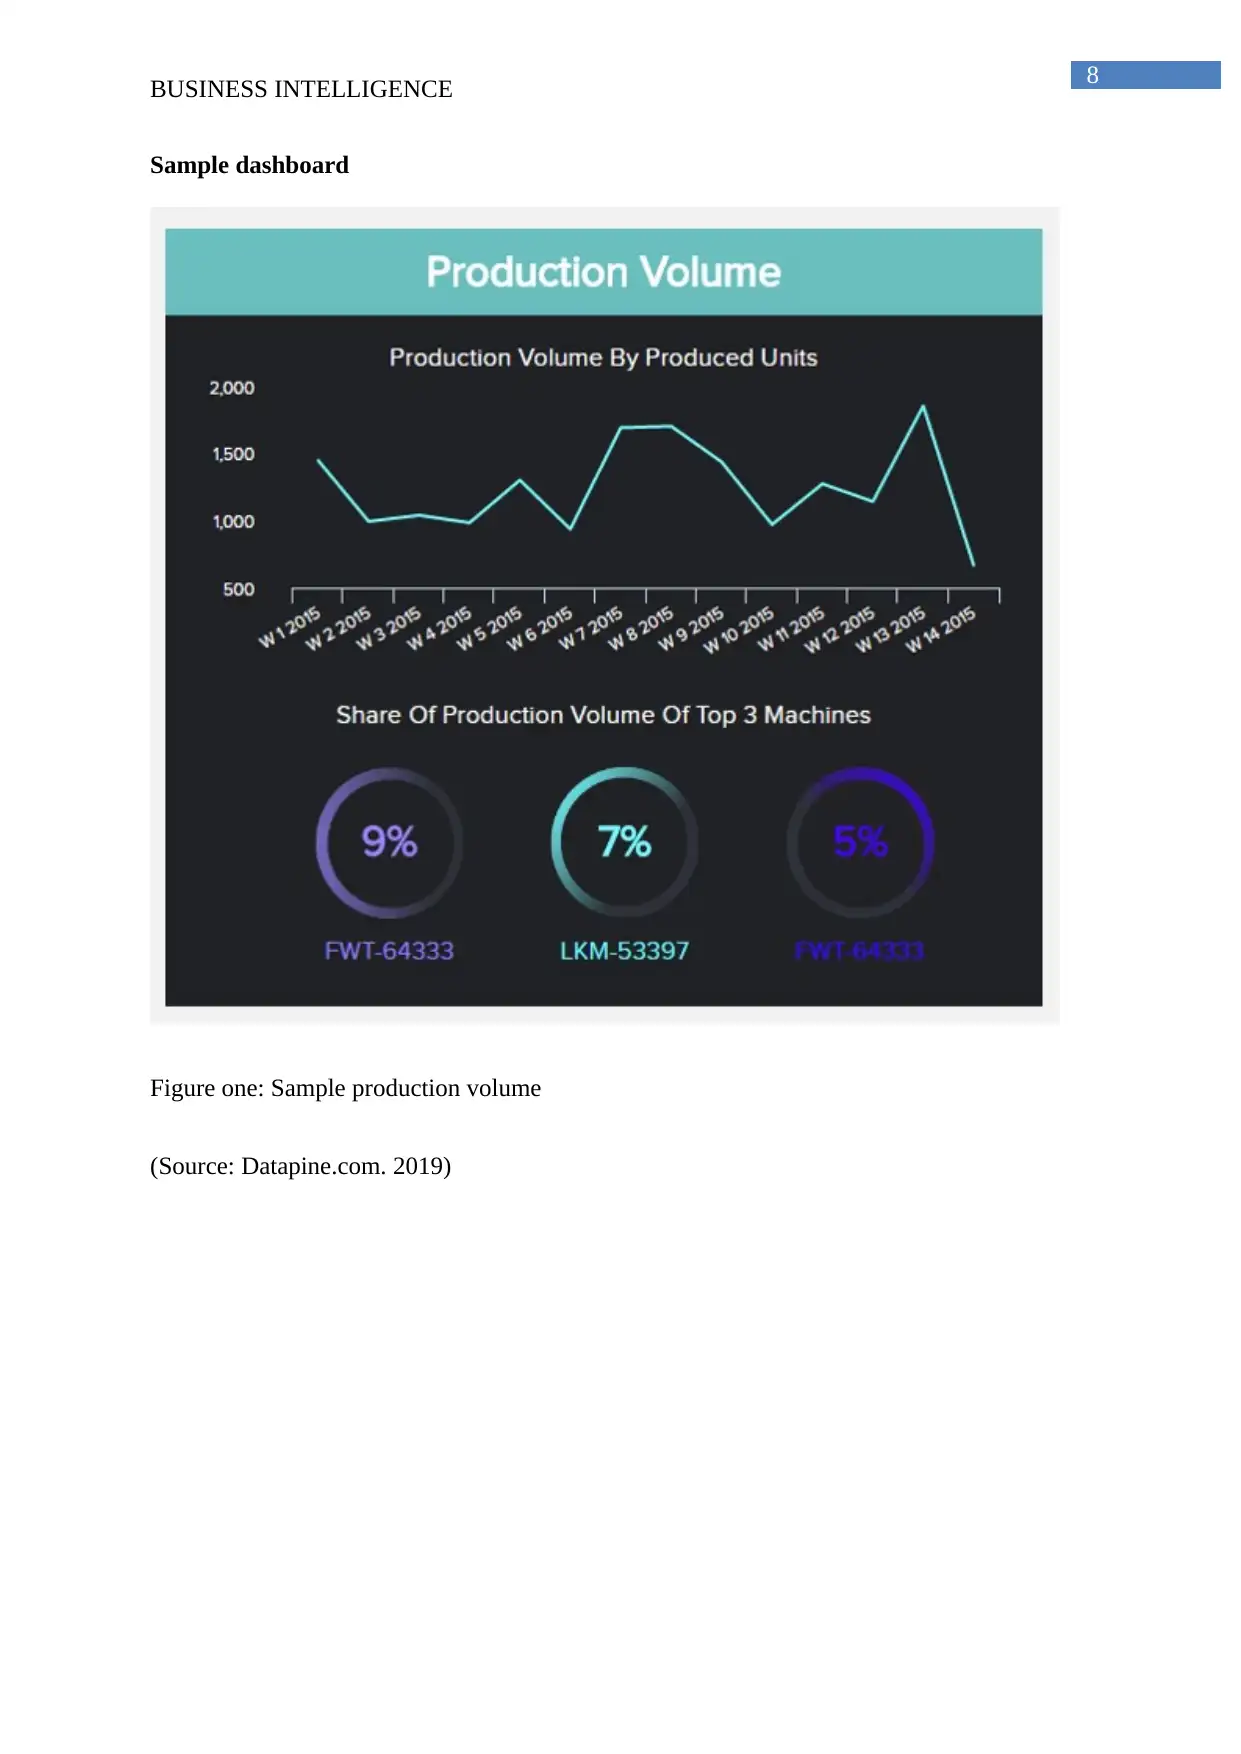
Sample dashboard
Figure one: Sample production volume
(Source: Datapine.com. 2019)
BUSINESS INTELLIGENCE
Sample dashboard
Figure one: Sample production volume
(Source: Datapine.com. 2019)
⊘ This is a preview!⊘
Do you want full access?
Subscribe today to unlock all pages.
Trusted by 1+ million students worldwide
9
BUSINESS INTELLIGENCE
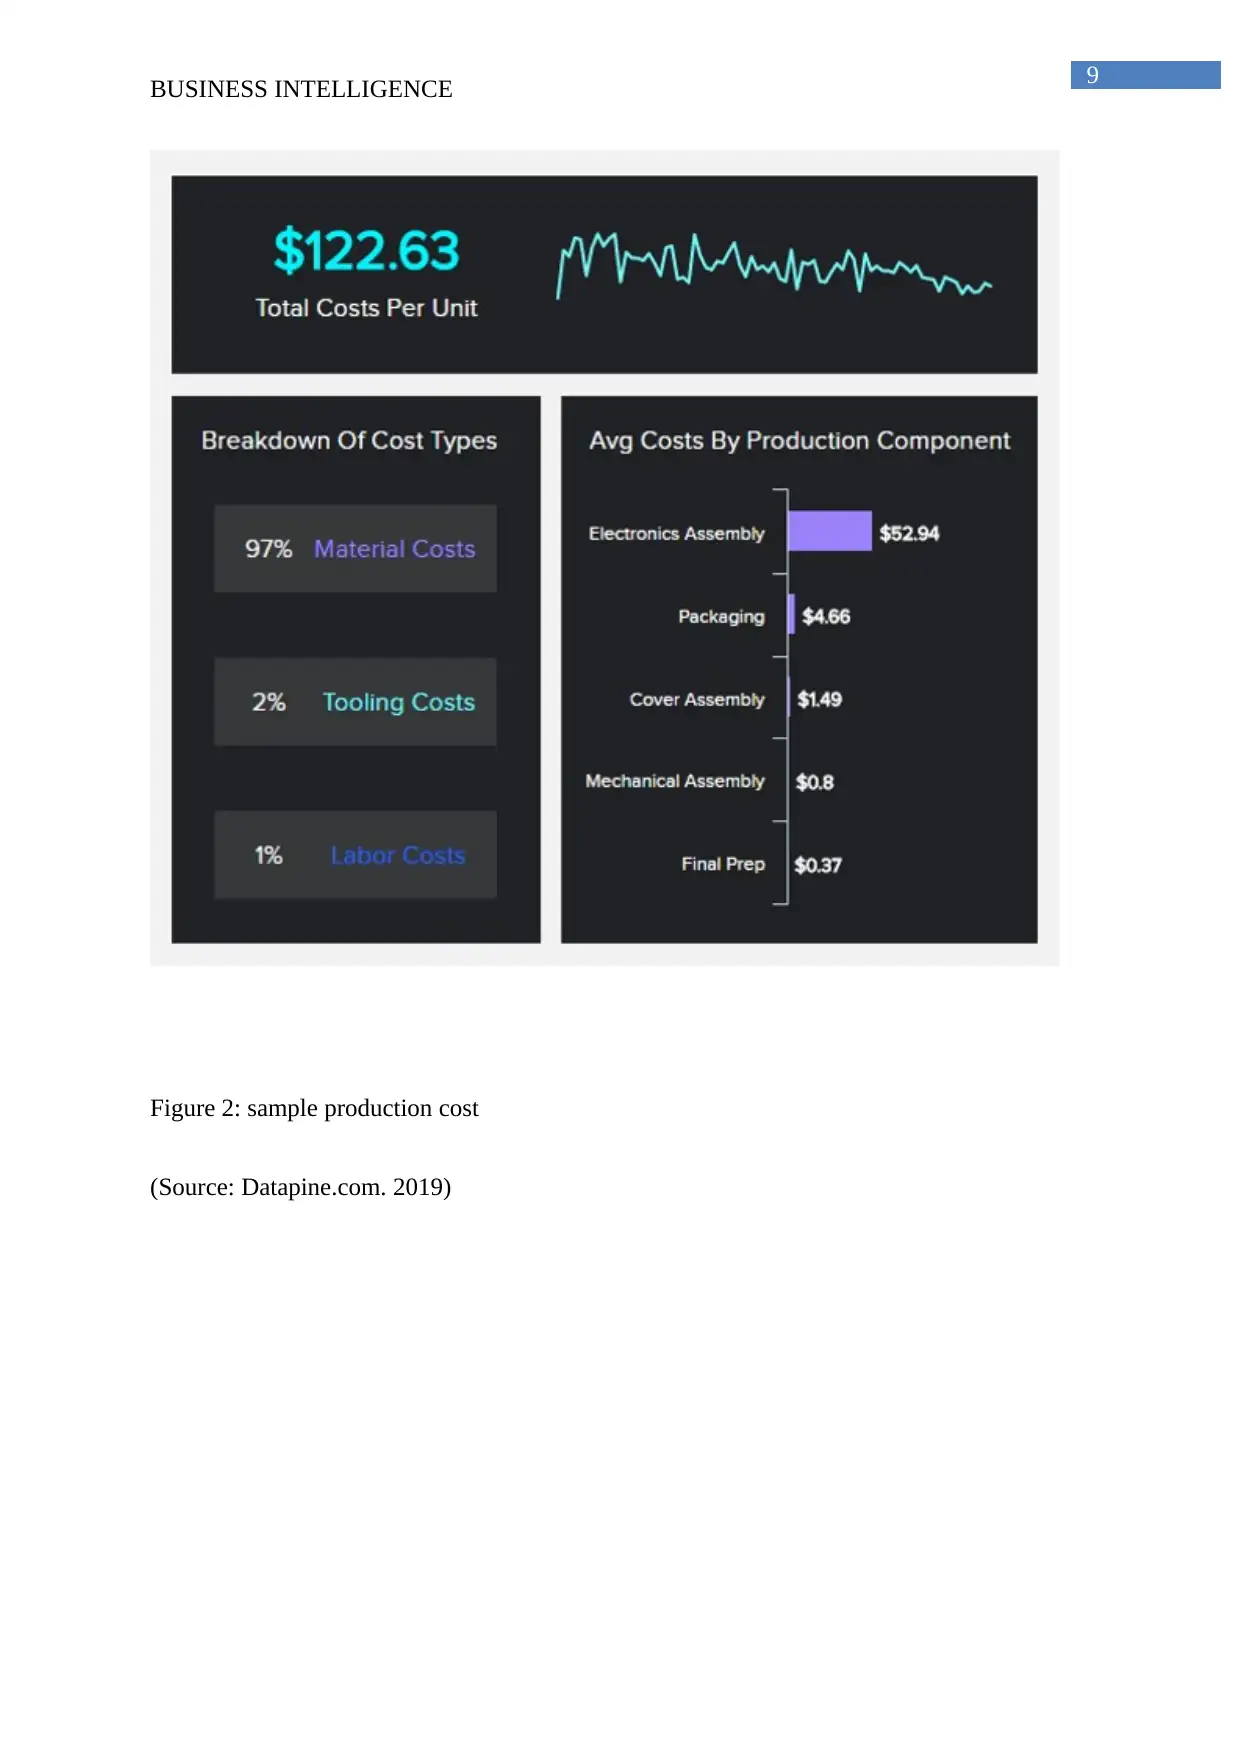
Figure 2: sample production cost
(Source: Datapine.com. 2019)
BUSINESS INTELLIGENCE
Figure 2: sample production cost
(Source: Datapine.com. 2019)
Paraphrase This Document
Need a fresh take? Get an instant paraphrase of this document with our AI Paraphraser
10
BUSINESS INTELLIGENCE
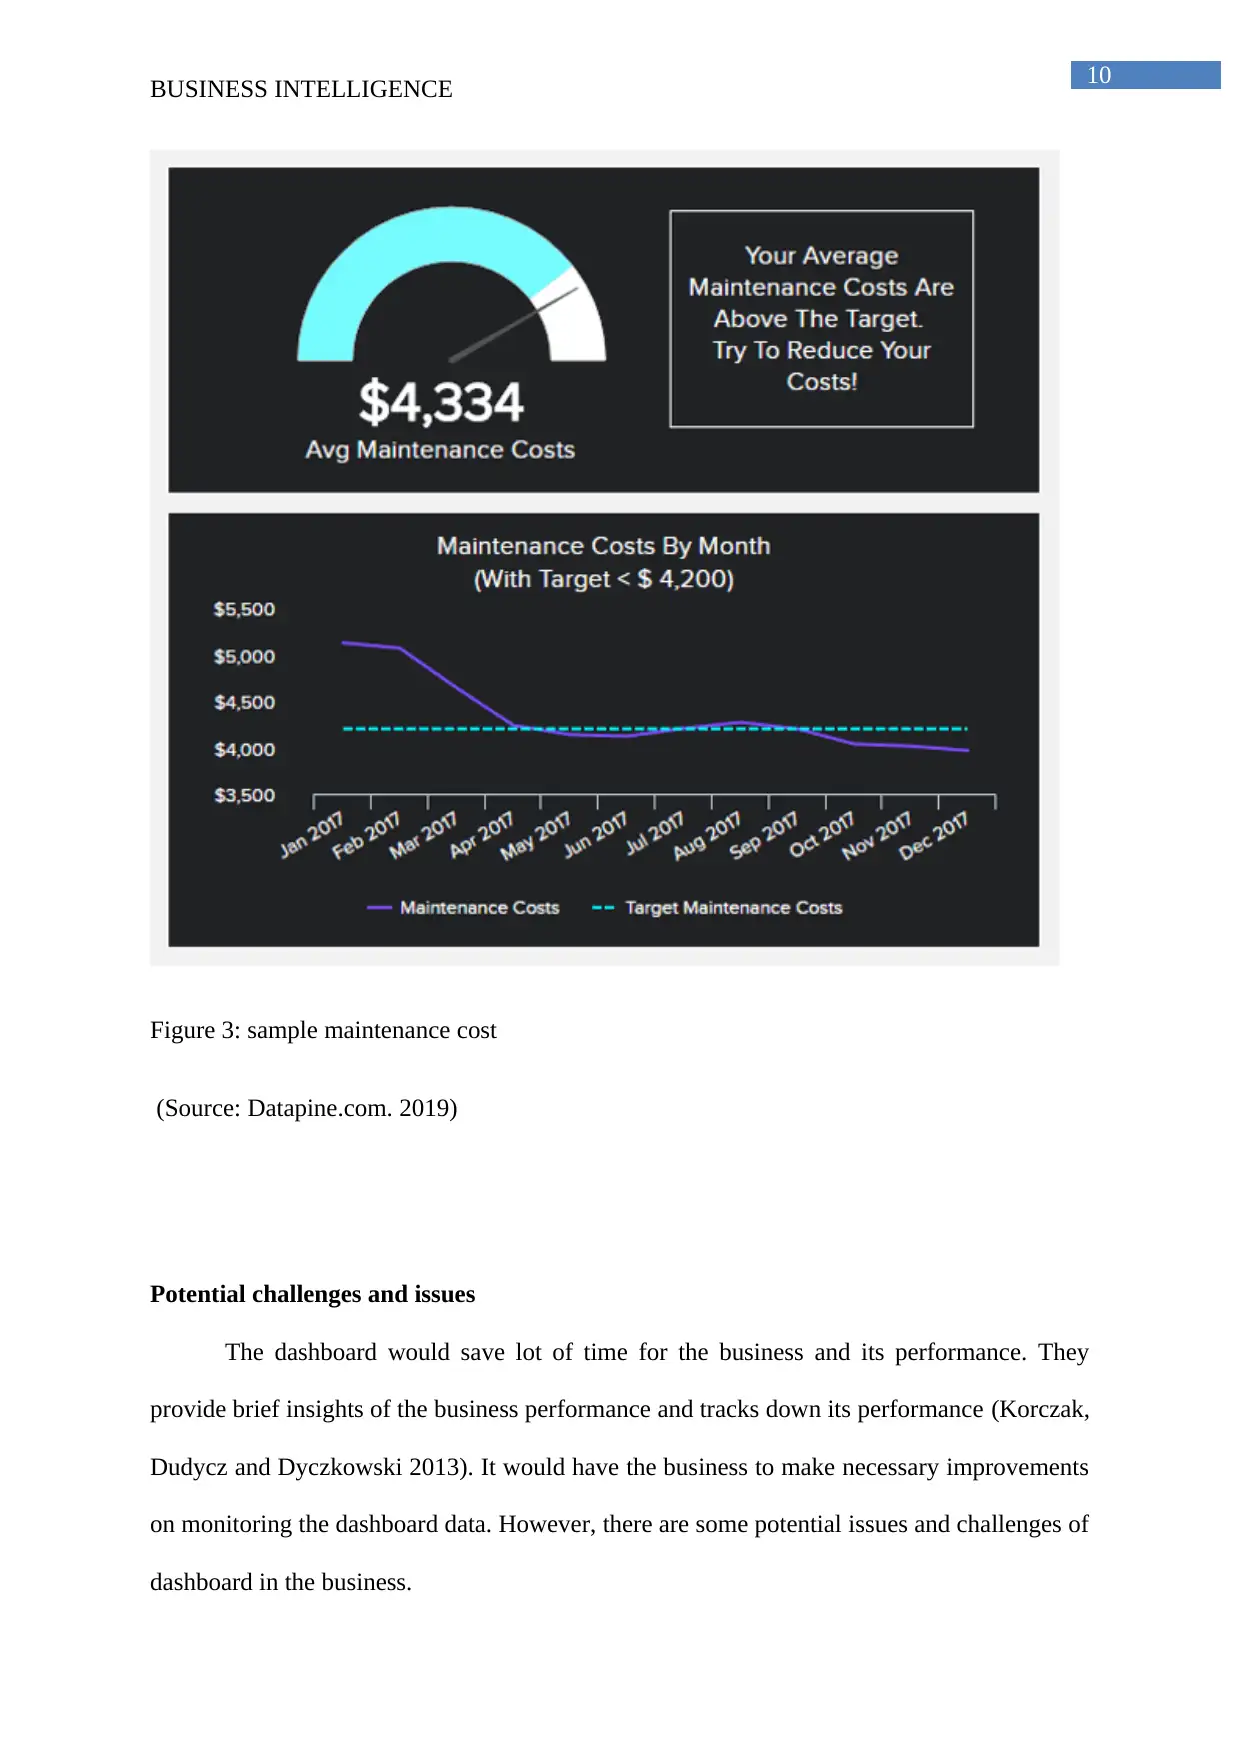
Figure 3: sample maintenance cost
(Source: Datapine.com. 2019)
Potential challenges and issues
The dashboard would save lot of time for the business and its performance. They
provide brief insights of the business performance and tracks down its performance (Korczak,
Dudycz and Dyczkowski 2013). It would have the business to make necessary improvements
on monitoring the dashboard data. However, there are some potential issues and challenges of
dashboard in the business.
BUSINESS INTELLIGENCE
Figure 3: sample maintenance cost
(Source: Datapine.com. 2019)
Potential challenges and issues
The dashboard would save lot of time for the business and its performance. They
provide brief insights of the business performance and tracks down its performance (Korczak,
Dudycz and Dyczkowski 2013). It would have the business to make necessary improvements
on monitoring the dashboard data. However, there are some potential issues and challenges of
dashboard in the business.
11
BUSINESS INTELLIGENCE
The challenges of dashboard are:
Real time availability: The dashboard data might not be able to refresh the real time and
delay the actions of the business to fix the issues. The business requires accessing the data of
the dashboard in real time. Real time availability of data is very crucial for the business (Lim
et al. 2013). The information provided in the dashboard might be outdated therefore, the
business needs to check and refresh the data and make necessary actions to implement
changes.
Incompatibility: there might be an issue with the dashboard when it is incompatible with the
business systems. This can be potentially encountered by the business organization. The data
displayed on the dashboard might not be correct or might be outdated at times. Therefore, the
business might avoid these challenges by fixing this issue (Rouse and Stedman 2014). To
overcome this issue, the business can manually input the data and measure the changes. This
way the businesses can acquire relevant data (Sarkar and Moon 2014). Moreover, the
dashboard designed must be provided with sufficient information about the business systems
so as to ensure that the designed dashboard is compatible with the business system.
Data identification: the fundamental work of dashboard is to identify the relevant data and
display it so that the business can portray data to the business. However, the business is
required to decide the volumes of input and the sources of this data (Chang 2014). The
business might encounter problems of data overload in the business. Identifying the relevant
information is a crucial part to play by the business.
Data integration: There is a possible when the business is not very effective. The purpose
and usability of the business can be increased manifolds by the ability to integrate its data
with the activities and performance of the business (Homann 2013). The collaboration of this
data is difficult for many businesses to achieve in retrospect. The feasibility to integrate its
⊘ This is a preview!⊘
Do you want full access?
Subscribe today to unlock all pages.
Trusted by 1+ million students worldwide
1 out of 15
Related Documents


Your All-in-One AI-Powered Toolkit for Academic Success.
+13062052269
info@desklib.com
Available 24*7 on WhatsApp / Email
![[object Object]](/_next/static/media/star-bottom.7253800d.svg)
Unlock your academic potential
Copyright © 2020–2026 A2Z Services. All Rights Reserved. Developed and managed by ZUCOL.