Detailed Financial Analysis: Samsung's Balance Scorecard and Strategy
VerifiedAdded on 2020/11/23
|17
|3646
|355
Report
AI Summary
This report presents a comprehensive balance scorecard analysis of Samsung Electronics, evaluating its financial performance and strategic initiatives. The report begins with an executive summary, followed by an introduction to the balance scorecard methodology and its practical application. It identifies Samsung's vision, strategies, and key performance indicators (KPIs) across financial, customer, internal business processes, and learning and growth perspectives. A critical analysis of the balance scorecard and strategic map, including their advantages and disadvantages, is provided. The report then develops a balance scorecard specifically for Samsung, outlining objectives, KPIs, targets, and initiatives, along with a strategy map summarizing the key links. Recommendations for improving the balance scorecard and strategic map are also included. The analysis encompasses various financial tools, such as ratio analysis, liquidity analysis, and debt-equity ratio, to assess Samsung's financial stability and market position. The report concludes with recommendations for enhancing Samsung's financial performance and achieving its strategic goals.

BALANCE SCORE CARD ON
FINANCE
FINANCE
Paraphrase This Document
Need a fresh take? Get an instant paraphrase of this document with our AI Paraphraser
Table of Contents
EXECUTIVE SUMMARY.............................................................................................................1
INTRODUCTION...........................................................................................................................2
IDENTIFICATION VISION AND STRATEGIES .......................................................................2
1. Identification Vision and strategies....................................................................................2
2. Identification of a major strategies.....................................................................................2
CRITICAL ANALYSIS OF BSC & SM.........................................................................................3
3. Introduction and practical use of balance scorecards for performance management and
monitoring..............................................................................................................................3
4. Disadvantages of BSC........................................................................................................7
5. Advantages of BSC............................................................................................................7
6. Advantages of Strategic map..............................................................................................9
7. Disadvantages of SM........................................................................................................10
8. Evaluation.........................................................................................................................10
BSC DEVELOPMENT FOR COMPANY ...................................................................................12
9. BSC Development............................................................................................................12
10. BSC Balance...................................................................................................................12
11. BSC objectives...............................................................................................................12
12. BSC KPI/Targets/Initiatives...........................................................................................12
13. Strategy Map: BSC summary and Links........................................................................13
14. Strategy Map strategies..................................................................................................13
BSC/SM RECOMMENDATION..................................................................................................13
15. BSC Quality....................................................................................................................13
16. BSC Justification............................................................................................................13
17. Strategic map Quality.....................................................................................................13
18. SM Justification..............................................................................................................13
CONCLUSION..............................................................................................................................13
REFERENCES..............................................................................................................................14

⊘ This is a preview!⊘
Do you want full access?
Subscribe today to unlock all pages.
Trusted by 1+ million students worldwide
EXECUTIVE SUMMARY
In this project report summaries specific information about use of Balance scorecard
method used by the company's. Under this report a proper analyse regarding Samsung electronic
by the ways of using various financial tool such as ratio analysis that is categories into various
parts. Organisation's strategy and vision also taken into considered while preparing balance
scorecard approach.
There are five section divided in this report to analyse the content and concerns related to
financial leverage and after analysing the proportion of debt in the overall capital structure by
working capital management and operations. There are some aspects as sale revenue without
containing the laxity provided to debtors. This is mainly associated with analysing the key aspect
mainly associated with defining the plans for better understanding.
Market trends and stock premium relative to peers are given in this context. The vision
and strategies, Balanced scorecard for performance management and monitoring, strategic map
and recommendations given subject to case scenario. The values and plans subject to profitability
ratio and impressive in terms of the gross margin, findings and effects in terms of improvements
in the cost of goods sold. Return on equity and return on assets. Market trend and company's
stock market position relative to its peers highlighted.
1
Paraphrase This Document
Need a fresh take? Get an instant paraphrase of this document with our AI Paraphraser
INTRODUCTION
Balance scorecard is one of the analytical approach which is mainly associated with
financial goals and objectives (Keyes, 2016). This provides an effective path and structure to
attain the objectives and operations of business in systematic manner. There is an analysis of
financial position and target for enhancing the financial stability and improve the structure of
business in more effective manner. Analysis, interpret and critical evaluation on Samsung
electronics company is done in this report for preparing a relevant scorecard.
IDENTIFICATION VISION AND STRATEGIES
1. Identification Vision and strategies
Inspiring the world with the innovative technology, products and design that enhance
people life and contributing to social prosperity by developing and creating new future is the
main vision of Samsung Electronics. The vision of organisation for 2020 is the core commitment
to create values for better world and getting richer in digital world. Innovative approach and
technology for developing products and services are the essential aspect considered in the vision
statement (Busco and Quattrone, 2015). The main goal of organisation is to explore the brand
value and emphasise scope of organisation by spreading efforts, creativity and innovative
approaches for great people.
As per the mission statement of Samsung Electronics, organisation deliver world's best
products and services through passion for innovations and optimal operations. It look forward to
enhance new business areas and health & care automotive electronics. Adopting the challenges
and opportunities in a great and joyful manner is the key strength of Samsung Electronics.
2. Identification of a major strategies
Long term financial and strategic investment
Samsung is seeking for growth opportunities to explore the digital world. It is planing to
sell out the existing unproductive assets and generating more liquidity in terms of cash. By
fulfilling the requirement of liquid cash requirement it will be tried to repay the debts and
requirement of cash for completion of long term goals (Valmohammadi and Ahmadi, 2015).
Major portion of Samsung Fine Chemicals in 2015. Signing the aggrievement of selling the
shares in Samsung fine Chemicals. Sell off printing solutions and business segment are also the
part of long terms objective.
2
CRITICAL ANALYSIS OF BSC & SM
3. Introduction and practical use of balance scorecards for performance management and
monitoring
Balanced Score card
Balance scorecard is an approach which mainly centralised around maintaining the
strategic performance tool for analysing the proper management as well as analysing the small
operational activities and plans with the organisation's main vision (Basuony, 2014). It provide
more comprehensive analysis of a company. Small units of non financial and financial parameter
and key points usually identified with current performance. This will help the Samsung
Electronics in terms to attain the financial goals by classifying aim and objectives. This approach
roam around four key elements which are as follows:
Financial perspective: this parameter is mainly associated with monetary and financial
terms. Managing the financial resources and putting the interest of stakeholders and investors are
the main aspects considered in financial perspective. Financial results and growth, key financial,
parameters and performance indicators (ROE, ROCE), high profit margin, improved cash flow,
lower bad loans and debts, net interest margin, reduced overhead expenses, proper revenue mix
are the elements monitored in financial perspective (Perkins, Grey and Remmers, 2014).
Customer: This mainly centralised around analysing the thinking and overview of
customers towards organisation. There are some key parameters as customer satisfaction,
customer loyalty, retention of key customer, sales revenues as per customer, competitive pricing
and product offering, high quality service, customer preference compared to compositors which
are considered in such customer satisfaction.
Internal business processes: this contains the process of execution of function of
organisation. This contains the essential parameters as cross sell products, improve operational
efficiency and minimize problem, proper customer relationship management, higher success rate
in converting, fast business decisions and approvals and higher employee confidence is one of
the essential aspect considered in internal business process (Hladchenko, 2015).
Learning and growth: this mainly indicates towards the improving the scale of learning
and growth for the company. There are many type of parameters defined in this context as
developing skills and knowledge, proper knowledge and management, strategic information,
aligning the personal goals with company goals, employee growth and turnover, employee
3
⊘ This is a preview!⊘
Do you want full access?
Subscribe today to unlock all pages.
Trusted by 1+ million students worldwide
satisfaction and retention are the main elements in learning and growth (Weber and Schäffer,
2013).
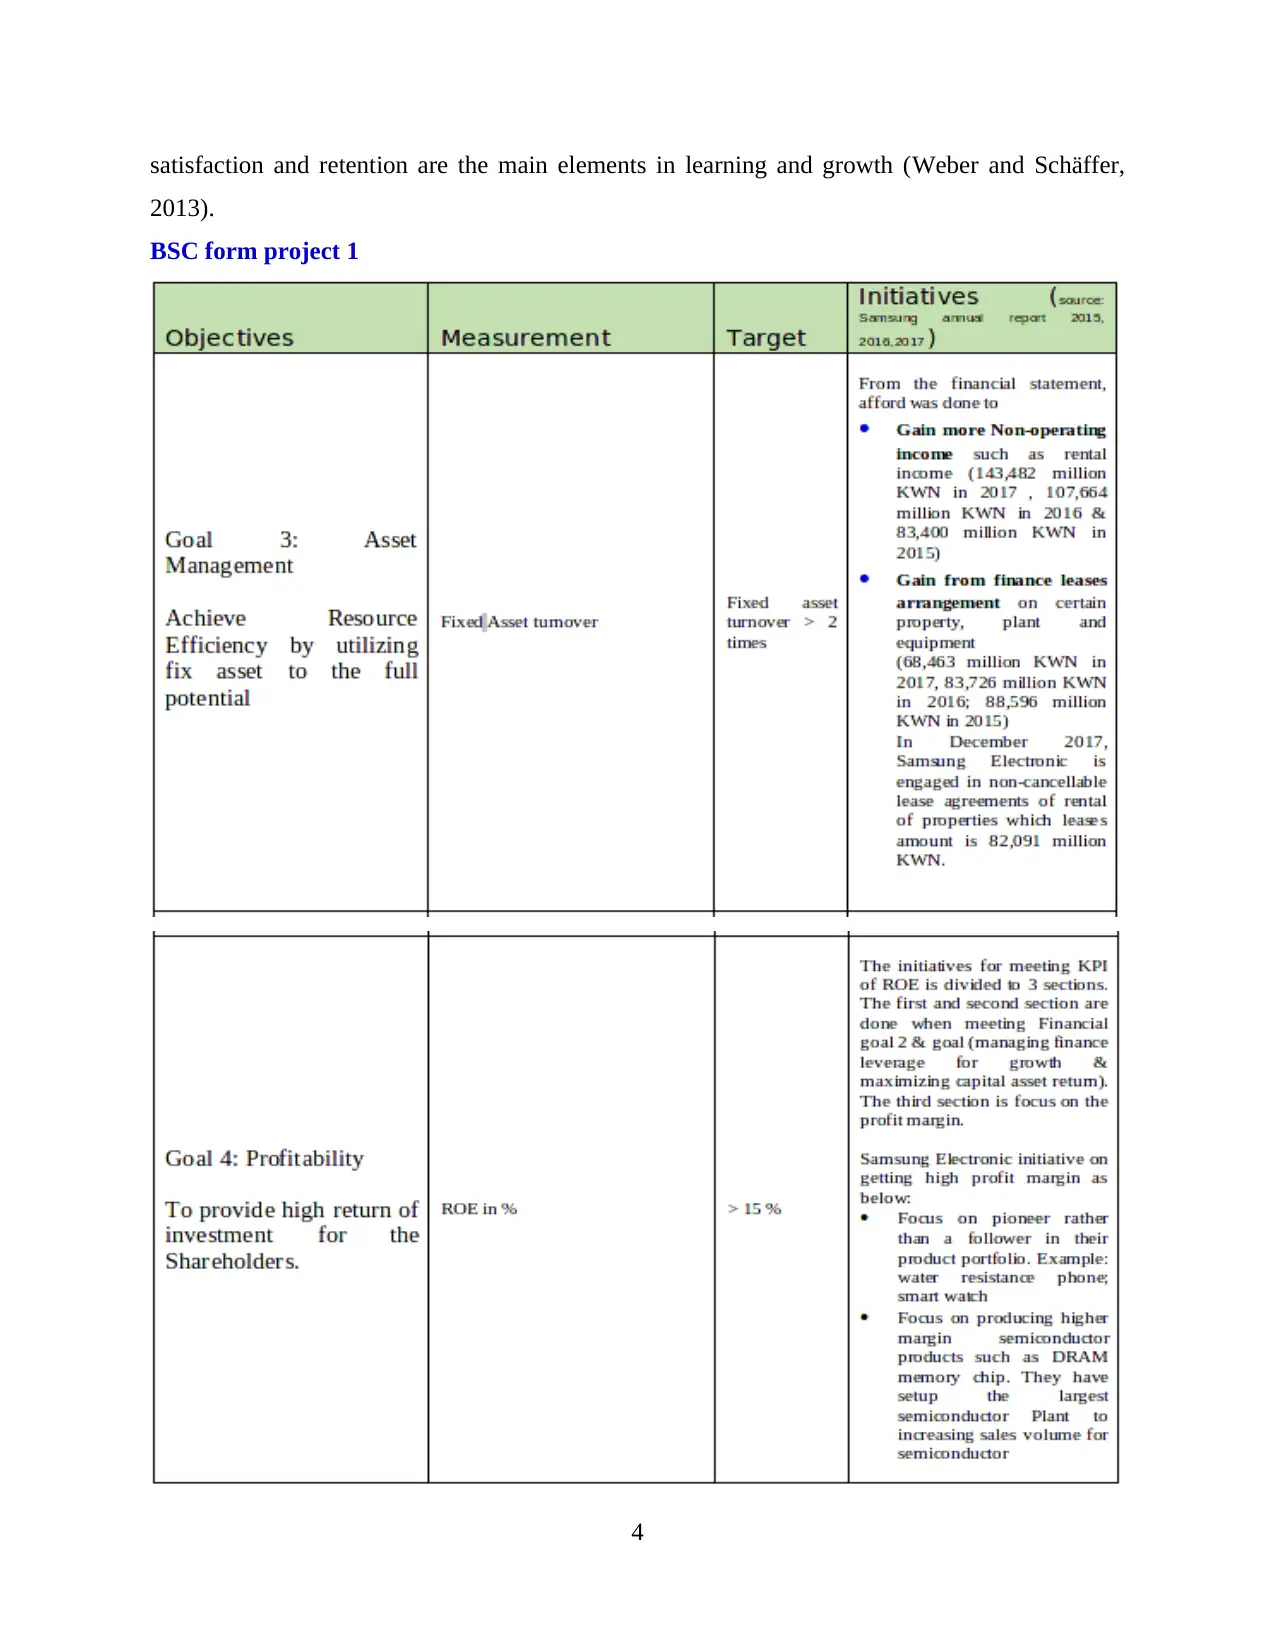
BSC form project 1
4
2013).
BSC form project 1
4
Paraphrase This Document
Need a fresh take? Get an instant paraphrase of this document with our AI Paraphraser
Balance scorecard as per current position
Balanced Scorecard
Objectives Measures Target Initiatives
Financial
Perspective
To maintain
Short term
solvency
Liquid ratio
and quick ratio
Current ratio = >2
Liquid ratio = >1
As per inventory
management report the
collaboration program was
designed to manager risks
through mobile networks
Global Enterprise
resource planning to
control inventory and the
the supply chain which
remain based upon
demand.
Customer
perspective
To decrease
the loans and
debts
Debt equity
ratio
Targeted up to
decrease 3%
Redemption of debentures
and repayment of existing
loans
Internal
business
process
Enhancing
the value by
utilising the
assets and
the resources
at their
optimum use
Fixed Assets
turn over ratio
Target is to
maintain the level
of 2 times
To enhance profitability and
productivity by putting more
efforts.
Learning
and growth
To provide
higher return
of
investment
to
Return on
equity in %
> 18% Focusing towards increasing
the KPI and ROE to be
divided in 3 sections. First
two sections will represent
the financial activities and
5
shareholders last or third section will
represent the profit margin.
4. Disadvantages of BSC
Balanced scorecard form from project 1
Disadvantages of Balanced Scorecard
Base of comparison BSC Project one Current
Financial Perspective Previous BSC helped in
financial planning and
forecasting process.
It makes the imbalanced
situation and bound the
management committee
towards fulfilling the task in
given dead line.
Customer perspective New technology impacted the
existing customer market.
There are standard goals and
benchmarks set by the
organisation at its own strength
rather than specific parameters
fulfilled in BSC.
Internal business process It improved the global
resource planning and
management technique in term
of deploying strategies.
This only centralised around
four aspects which do not clear
information and details
regarding the business
performance.
Learning and growth Sell off Samsung fine
chemicals for introducing new
printing solutions in November
2017
It enhanced the extra cost of
training and developing and
maintenance cost.
5. Advantages of BSC
Advantages of Balanced Scorecard
Base of comparison BSC Project one Current BSC
6
⊘ This is a preview!⊘
Do you want full access?
Subscribe today to unlock all pages.
Trusted by 1+ million students worldwide
Financial Perspective Samsung be able to achieve
the liquidity target which was
more than 2 times.
It provides a comprehensive
and in depth overview of
organisational performance by
setting objectives and
performance measures.
Customer perspective Profitability get increased
which build up the customer
base.
This improves the internal
structure of management and
operations with in
organisation.
Internal business process Asset management, debt
management be able to
achieve.
BSC will enhance the strategy
and vision of Samsung to the
centre of management focus;
so that management may never
deviate from these.
Learning and growth The first and second section
are done when meeting
Financial goal 2 & goal
(managing finance leverage for
growth & maximizing capital
asset return)
It helps to analyse the financial
and non-financial performance
measures in to a single system.
7
Paraphrase This Document
Need a fresh take? Get an instant paraphrase of this document with our AI Paraphraser
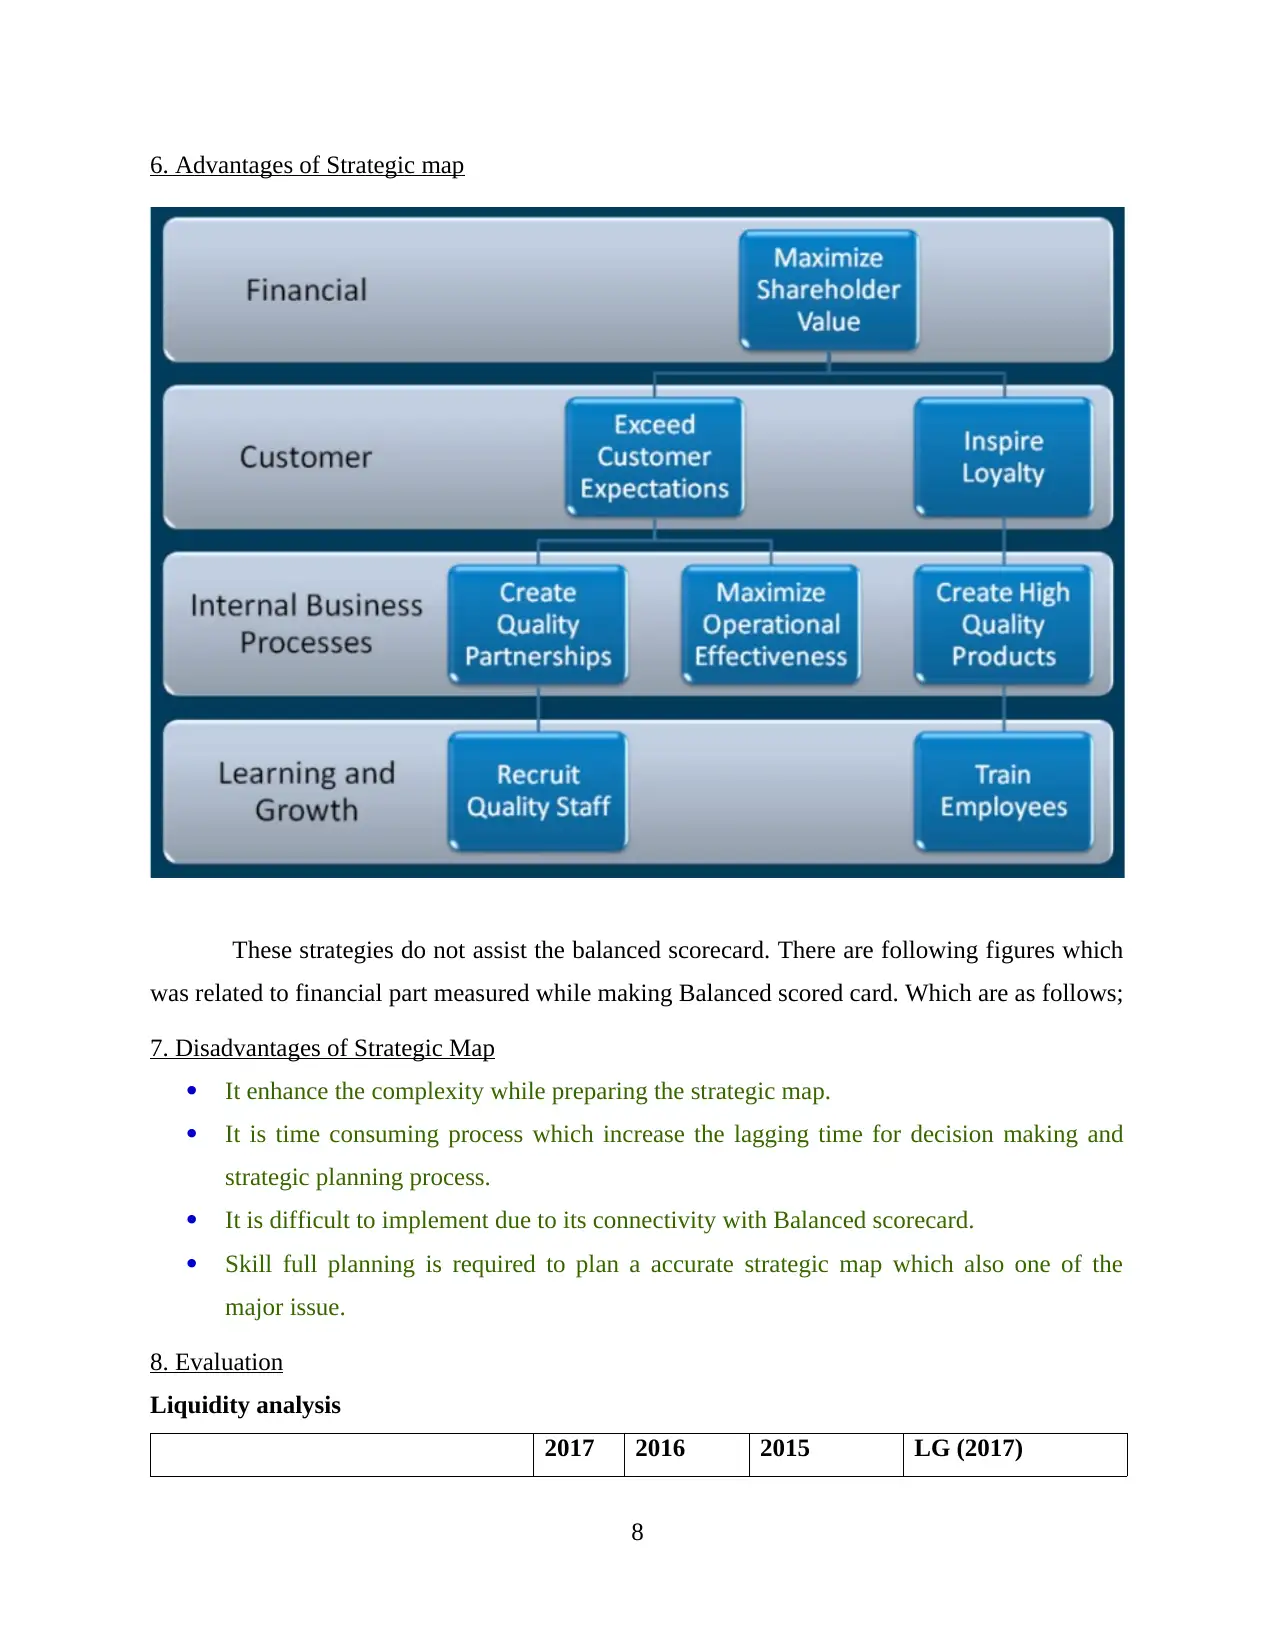
6. Advantages of Strategic map
These strategies do not assist the balanced scorecard. There are following figures which
was related to financial part measured while making Balanced scored card. Which are as follows;
7. Disadvantages of Strategic Map
It enhance the complexity while preparing the strategic map.
It is time consuming process which increase the lagging time for decision making and
strategic planning process.
It is difficult to implement due to its connectivity with Balanced scorecard.
Skill full planning is required to plan a accurate strategic map which also one of the
major issue.
8. Evaluation
Liquidity analysis
2017 2016 2015 LG (2017)
8
Current ratio 2.19 2.59 2.47 1.09
Quick Ratio 1.82 2.25 2.10 0.76
Net working capital to Assets 0.26 0.33 0.31 0.04
Liquidity position shows the optimum position in comparison to last financial years. The
current ratio of organisation was recorded 2.47 times in the year 2015, 2.59 times for the year
2016 and 2.19 for the year 2.19 times in the year 2017. it is seen that the current ratio get
increased in 2016 by .12 times and till 2017 it decreased by 0.40 form last financial year. The
main reason of decreasing the ratio is considered the outstanding amount in terms of inventories.
This variation did not impact the current ratio but also impact the Quick ratio is recorded as 1.82
time in 2017, 2.25 for 2016 and 2.10 for 2015. overall impact fall upon the net working capital
which is counted as 0.26 for 2017, 0.33 and 0.31 receptively.
Financial leverage or solvency analysis
2017 2016 2015 LG (2017)
Total debt ratio 0.29 0.26 0.26 0.64
Debt-equity ratio 0.41 0.36 0.35 1.81
Equity multiplier 1.41 1.36 1.35 2.81
Total debt ratio is calculated as 0.29 times for 2017, 0.26 for 2016 and same for the year
2015. Debt equity ratio is calculated as 0.41 for the year 2017, 0.36 for 2016 and 0.35 for 2015.
there is an increment seen in terms of capital structure. Still organisation is required to enhance
the capital structure for building strong structure of capital and long term debt position.
Working capital management
2017 2016 2015 LG ( 2017)
Inventory turnover 5.18 6.55 6.56 7.91
Days' sales in inventory 70.5 55.7 55.6 46.1
Receivables turnover 8.65 8.31 7.97 7.51
Inventory turnover shows the the diminishing results. Inventory turnover was recorded as
5.18 times for the year 2017, 6.55 for the year 2016 and 6.56 for the year 2015. it is seen that due
to outstanding amount of stock and inventory leads the organisation towards lower liquidity. It
9
⊘ This is a preview!⊘
Do you want full access?
Subscribe today to unlock all pages.
Trusted by 1+ million students worldwide
1 out of 17
Related Documents


Your All-in-One AI-Powered Toolkit for Academic Success.
+13062052269
info@desklib.com
Available 24*7 on WhatsApp / Email
![[object Object]](/_next/static/media/star-bottom.7253800d.svg)
Unlock your academic potential
Copyright © 2020–2026 A2Z Services. All Rights Reserved. Developed and managed by ZUCOL.