Finance for Strategic Managers: Samsung PLC Financial Analysis Report
VerifiedAdded on 2023/01/20
|10
|2068
|51
Report
AI Summary
This report provides a comprehensive financial analysis of Samsung PLC, examining its financial statements, including the Statement of Cash Flows, Statement of Profits or Loss, and Statement of Financial Position. It assesses Samsung's current viability by interpreting financial data from 2017 and 2018, and conducting a comparative ratio analysis to evaluate liquidity, profitability, and leverage. The report also provides recommendations based on the financial data, such as reducing the current ratio and increasing revenue while managing costs. Furthermore, it includes a capital expenditure appraisal for evaluating new versus current machinery using the Net Present Value method, recommending the purchase of new machinery based on a higher NPV. The report concludes that finance plays a vital role in strategic planning, enabling managers to align business strategies with the internal and external environment.

FINANCE FOR
STRATEGIC MANAGERS
STRATEGIC MANAGERS
Paraphrase This Document
Need a fresh take? Get an instant paraphrase of this document with our AI Paraphraser
Table of Contents
INTRODUCTION...........................................................................................................................1
TASK 1............................................................................................................................................1
[Covered in PPT].........................................................................................................................1
TASK 2............................................................................................................................................1
Interpretation of Samsung PLC Financial Statements to assess its current viability..................1
Comparative analysis of Financial Data related to Samsung PLC.............................................2
Recommendations.......................................................................................................................3
TASK 3............................................................................................................................................4
[Covered in Information Leaflet]................................................................................................4
TASK 4............................................................................................................................................4
Capital Expenditure Appraisal....................................................................................................4
CONCLUSION................................................................................................................................5
REFERENCES................................................................................................................................6
APPENDICES.................................................................................................................................7
INTRODUCTION
Finance for Strategic Managers plays an important role as most of the businesses require
formulation of various strategies and decisions on the type of financial data and information
available with the company. Such managers, then, analyse and interpret various data so as to
conduct resource planning and forecasting so as to achieve their overall short-term and long-term
objectives (Alkaraan, 2015). This report aims to provide a detailed account on Samsung PLC in
regards to the types of methodologies undertaken by it for the purpose of strategic planning,
appraisal of capital investment projects as well as financial data required for the same. The entire
report is bifurcated into various tasks which provides supporting evidence for the members of
Chamber of Commerce who want to research and study the success of Samsung PLC. For this
purpose, this report aims to provide a presentation, information leaflet, discussion paper and
practical application of capital expenditure appraisal methods in a comprehensive manner.
TASK 1
[Covered in PPT]
TASK 2
Interpretation of Samsung PLC Financial Statements to assess its current viability
Financial Statements help in providing relevant information to not only the management
of the business but also to other internal as well as external stakeholders. This is due to the fact
that they include all the financial data in a predefined format that facilitates easy identification of
the company's health in terms of corporate performance and profitability.
In the context of Samsung PLC, the company creates quarter-wise reports along with a
full year report so as to brief their stakeholders in a continuous manner (Annual Report, 2018).
For this purpose, however, the following financial statements, related to full year, have been
analysed so as to determine its current viability:
Statement of Cash Flows:
As per this statement, Samsung PLC reports its net cash-flow generated from Operating,
Investing and Financing activities in both South Korean Won (KRW) as well as U.S. Dollar
(USD). The balance of cash and cash equivalents at the beginning of 2018 is reported as
$27,763,038 whereas at the end of the period, this amount reduced to $27,577,050. Even though
1
⊘ This is a preview!⊘
Do you want full access?
Subscribe today to unlock all pages.
Trusted by 1+ million students worldwide
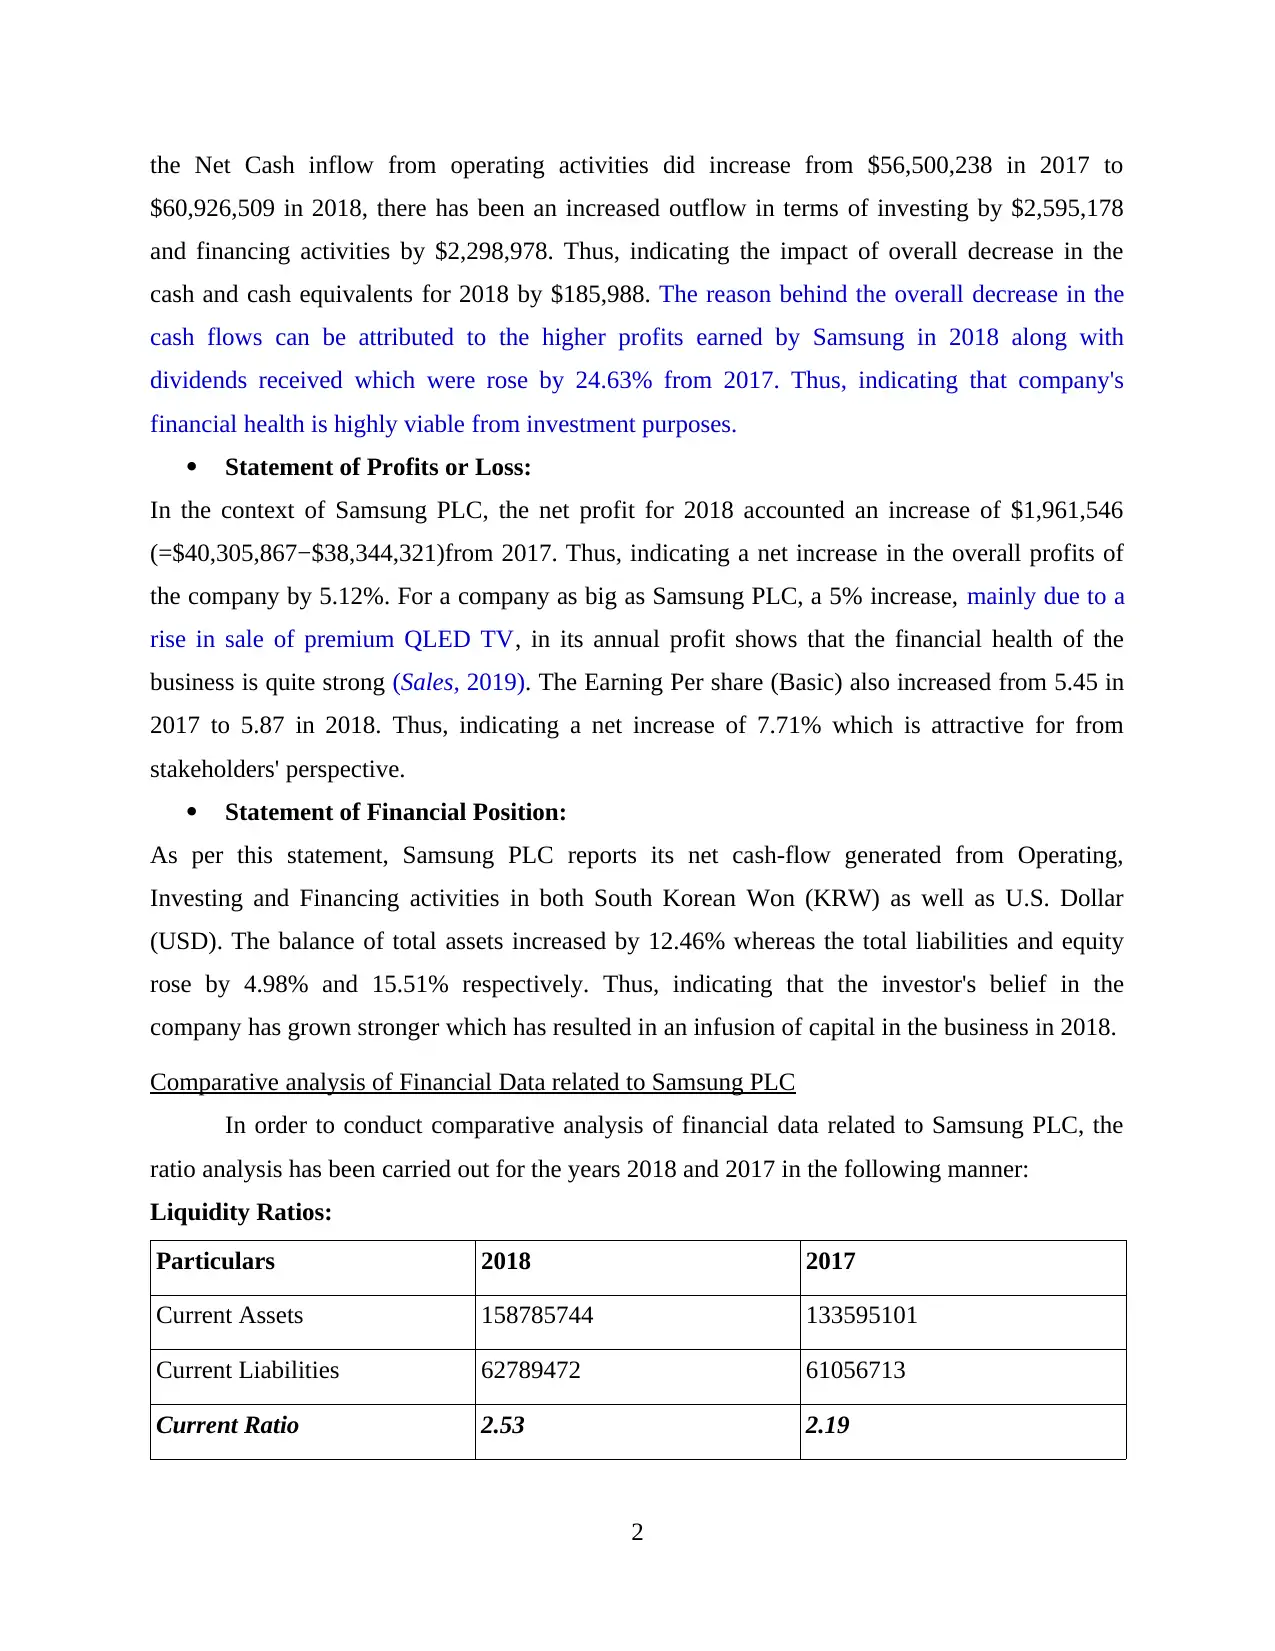
the Net Cash inflow from operating activities did increase from $56,500,238 in 2017 to
$60,926,509 in 2018, there has been an increased outflow in terms of investing by $2,595,178
and financing activities by $2,298,978. Thus, indicating the impact of overall decrease in the
cash and cash equivalents for 2018 by $185,988. The reason behind the overall decrease in the
cash flows can be attributed to the higher profits earned by Samsung in 2018 along with
dividends received which were rose by 24.63% from 2017. Thus, indicating that company's
financial health is highly viable from investment purposes.
Statement of Profits or Loss:
In the context of Samsung PLC, the net profit for 2018 accounted an increase of $1,961,546
(=$40,305,867−$38,344,321)from 2017. Thus, indicating a net increase in the overall profits of
the company by 5.12%. For a company as big as Samsung PLC, a 5% increase, mainly due to a
rise in sale of premium QLED TV, in its annual profit shows that the financial health of the
business is quite strong (Sales, 2019). The Earning Per share (Basic) also increased from 5.45 in
2017 to 5.87 in 2018. Thus, indicating a net increase of 7.71% which is attractive for from
stakeholders' perspective.
Statement of Financial Position:
As per this statement, Samsung PLC reports its net cash-flow generated from Operating,
Investing and Financing activities in both South Korean Won (KRW) as well as U.S. Dollar
(USD). The balance of total assets increased by 12.46% whereas the total liabilities and equity
rose by 4.98% and 15.51% respectively. Thus, indicating that the investor's belief in the
company has grown stronger which has resulted in an infusion of capital in the business in 2018.
Comparative analysis of Financial Data related to Samsung PLC
In order to conduct comparative analysis of financial data related to Samsung PLC, the
ratio analysis has been carried out for the years 2018 and 2017 in the following manner:
Liquidity Ratios:
Particulars 2018 2017
Current Assets 158785744 133595101
Current Liabilities 62789472 61056713
Current Ratio 2.53 2.19
2
Paraphrase This Document
Need a fresh take? Get an instant paraphrase of this document with our AI Paraphraser
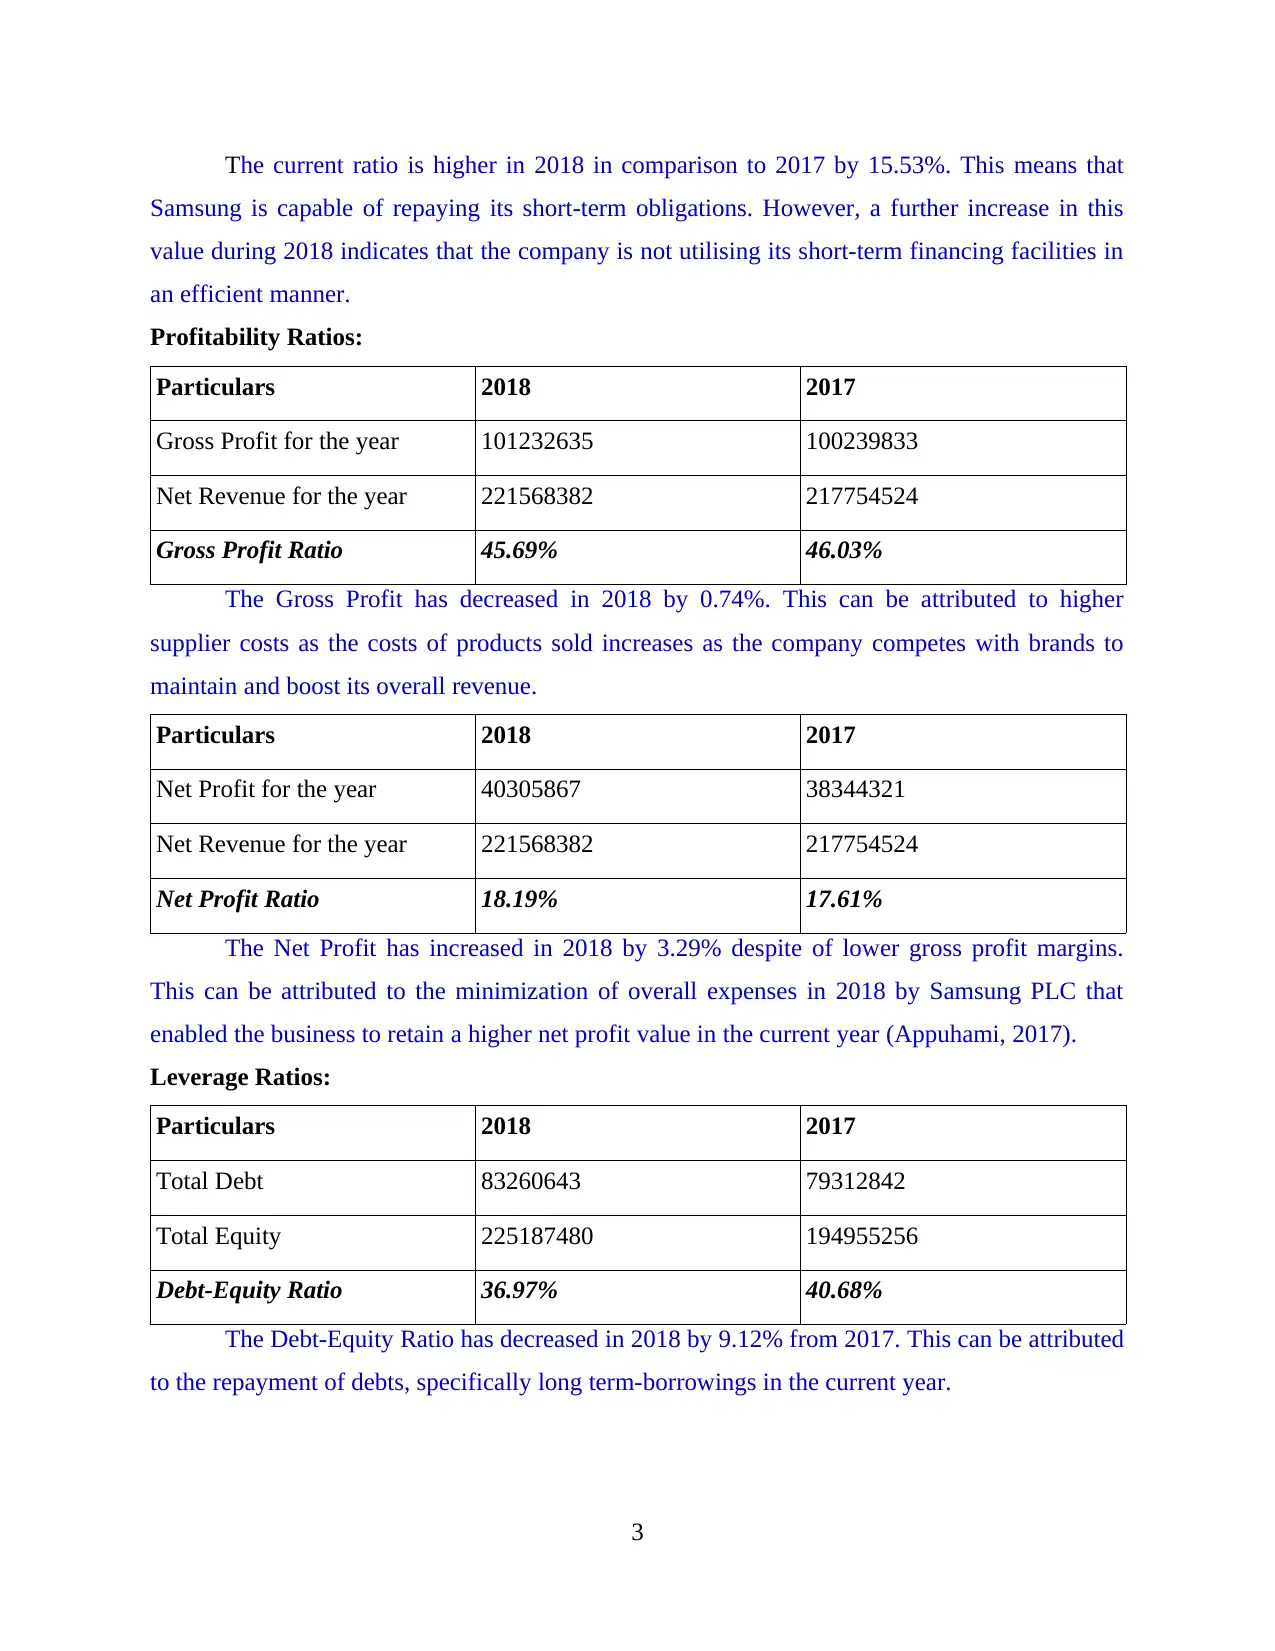
The current ratio is higher in 2018 in comparison to 2017 by 15.53%. This means that
Samsung is capable of repaying its short-term obligations. However, a further increase in this
value during 2018 indicates that the company is not utilising its short-term financing facilities in
an efficient manner.
Profitability Ratios:
Particulars 2018 2017
Gross Profit for the year 101232635 100239833
Net Revenue for the year 221568382 217754524
Gross Profit Ratio 45.69% 46.03%
The Gross Profit has decreased in 2018 by 0.74%. This can be attributed to higher
supplier costs as the costs of products sold increases as the company competes with brands to
maintain and boost its overall revenue.
Particulars 2018 2017
Net Profit for the year 40305867 38344321
Net Revenue for the year 221568382 217754524
Net Profit Ratio 18.19% 17.61%
The Net Profit has increased in 2018 by 3.29% despite of lower gross profit margins.
This can be attributed to the minimization of overall expenses in 2018 by Samsung PLC that
enabled the business to retain a higher net profit value in the current year (Appuhami, 2017).
Leverage Ratios:
Particulars 2018 2017
Total Debt 83260643 79312842
Total Equity 225187480 194955256
Debt-Equity Ratio 36.97% 40.68%
The Debt-Equity Ratio has decreased in 2018 by 9.12% from 2017. This can be attributed
to the repayment of debts, specifically long term-borrowings in the current year.
3
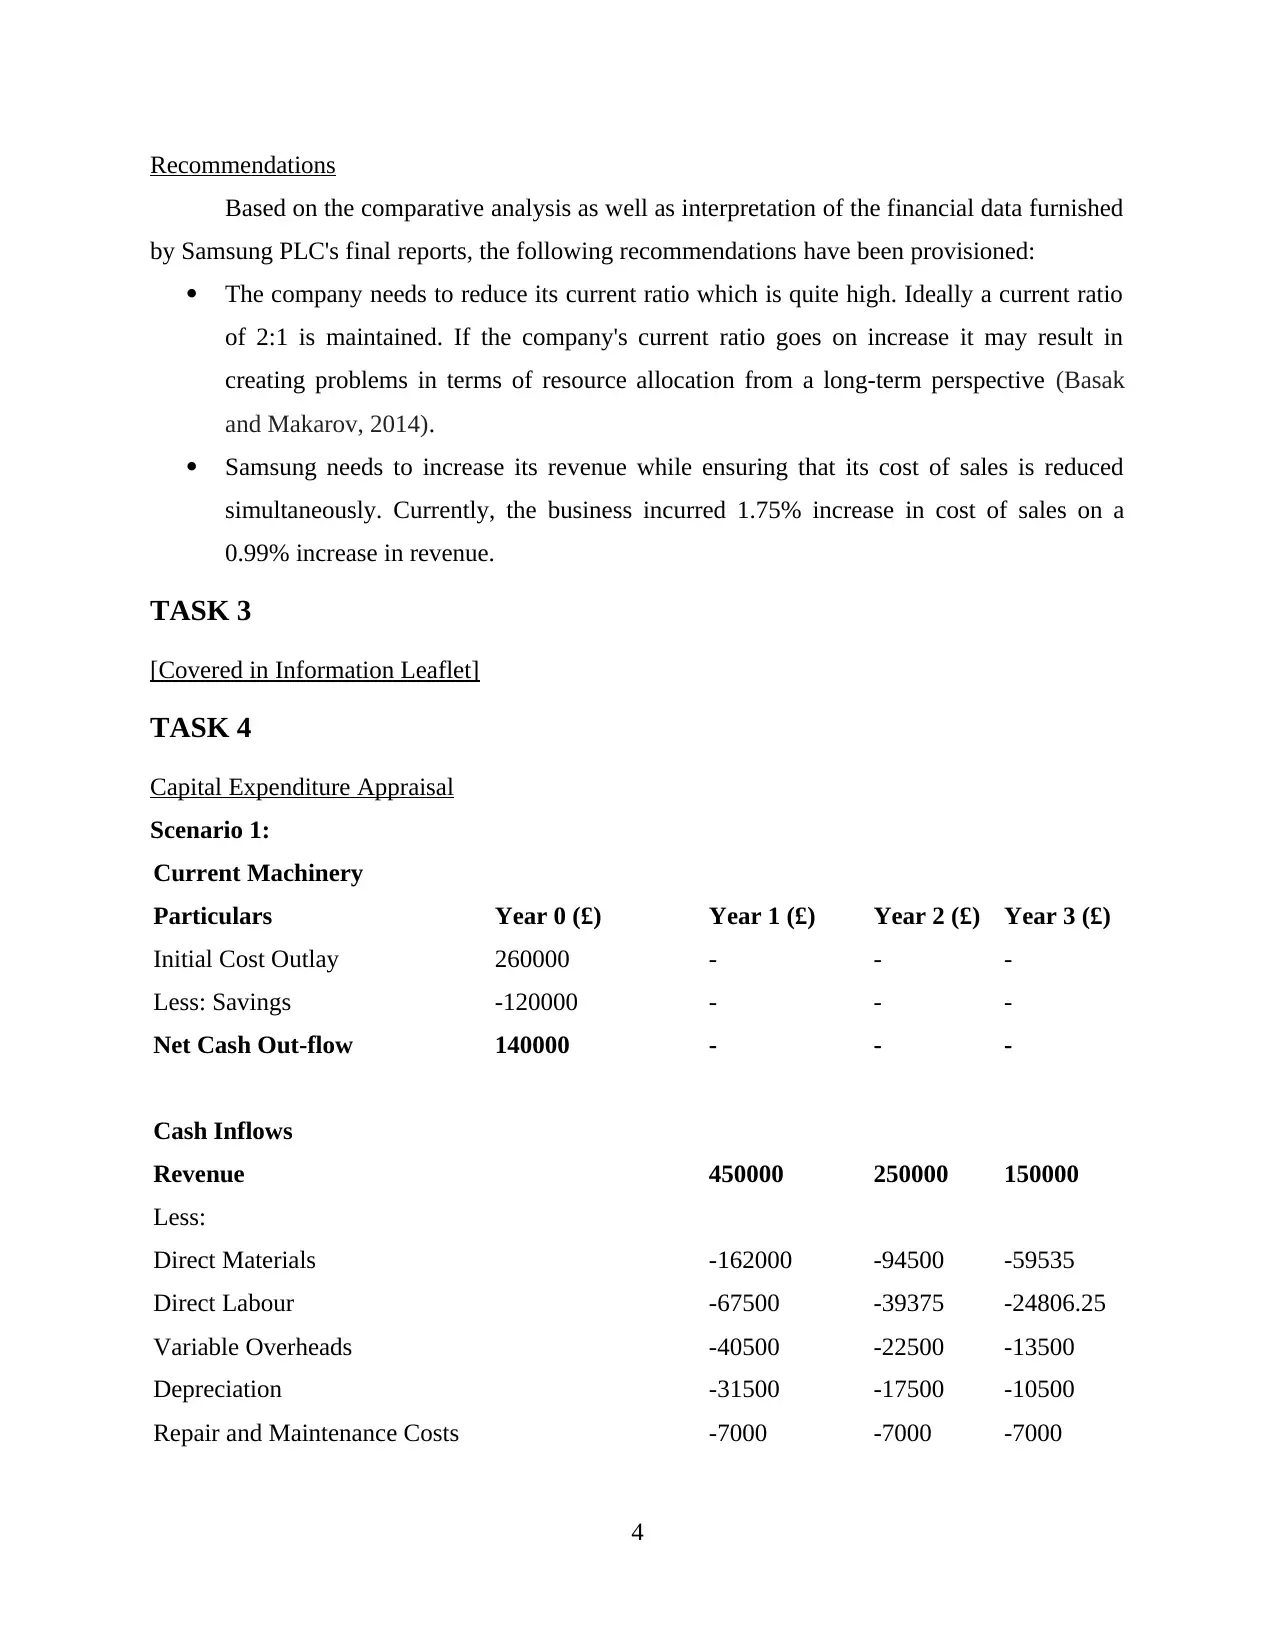
Recommendations
Based on the comparative analysis as well as interpretation of the financial data furnished
by Samsung PLC's final reports, the following recommendations have been provisioned:
The company needs to reduce its current ratio which is quite high. Ideally a current ratio
of 2:1 is maintained. If the company's current ratio goes on increase it may result in
creating problems in terms of resource allocation from a long-term perspective (Basak
and Makarov, 2014).
Samsung needs to increase its revenue while ensuring that its cost of sales is reduced
simultaneously. Currently, the business incurred 1.75% increase in cost of sales on a
0.99% increase in revenue.
TASK 3
[Covered in Information Leaflet]
TASK 4
Capital Expenditure Appraisal
Scenario 1:
Current Machinery
Particulars Year 0 (£) Year 1 (£) Year 2 (£) Year 3 (£)
Initial Cost Outlay 260000 - - -
Less: Savings -120000 - - -
Net Cash Out-flow 140000 - - -
Cash Inflows
Revenue 450000 250000 150000
Less:
Direct Materials -162000 -94500 -59535
Direct Labour -67500 -39375 -24806.25
Variable Overheads -40500 -22500 -13500
Depreciation -31500 -17500 -10500
Repair and Maintenance Costs -7000 -7000 -7000
4
⊘ This is a preview!⊘
Do you want full access?
Subscribe today to unlock all pages.
Trusted by 1+ million students worldwide
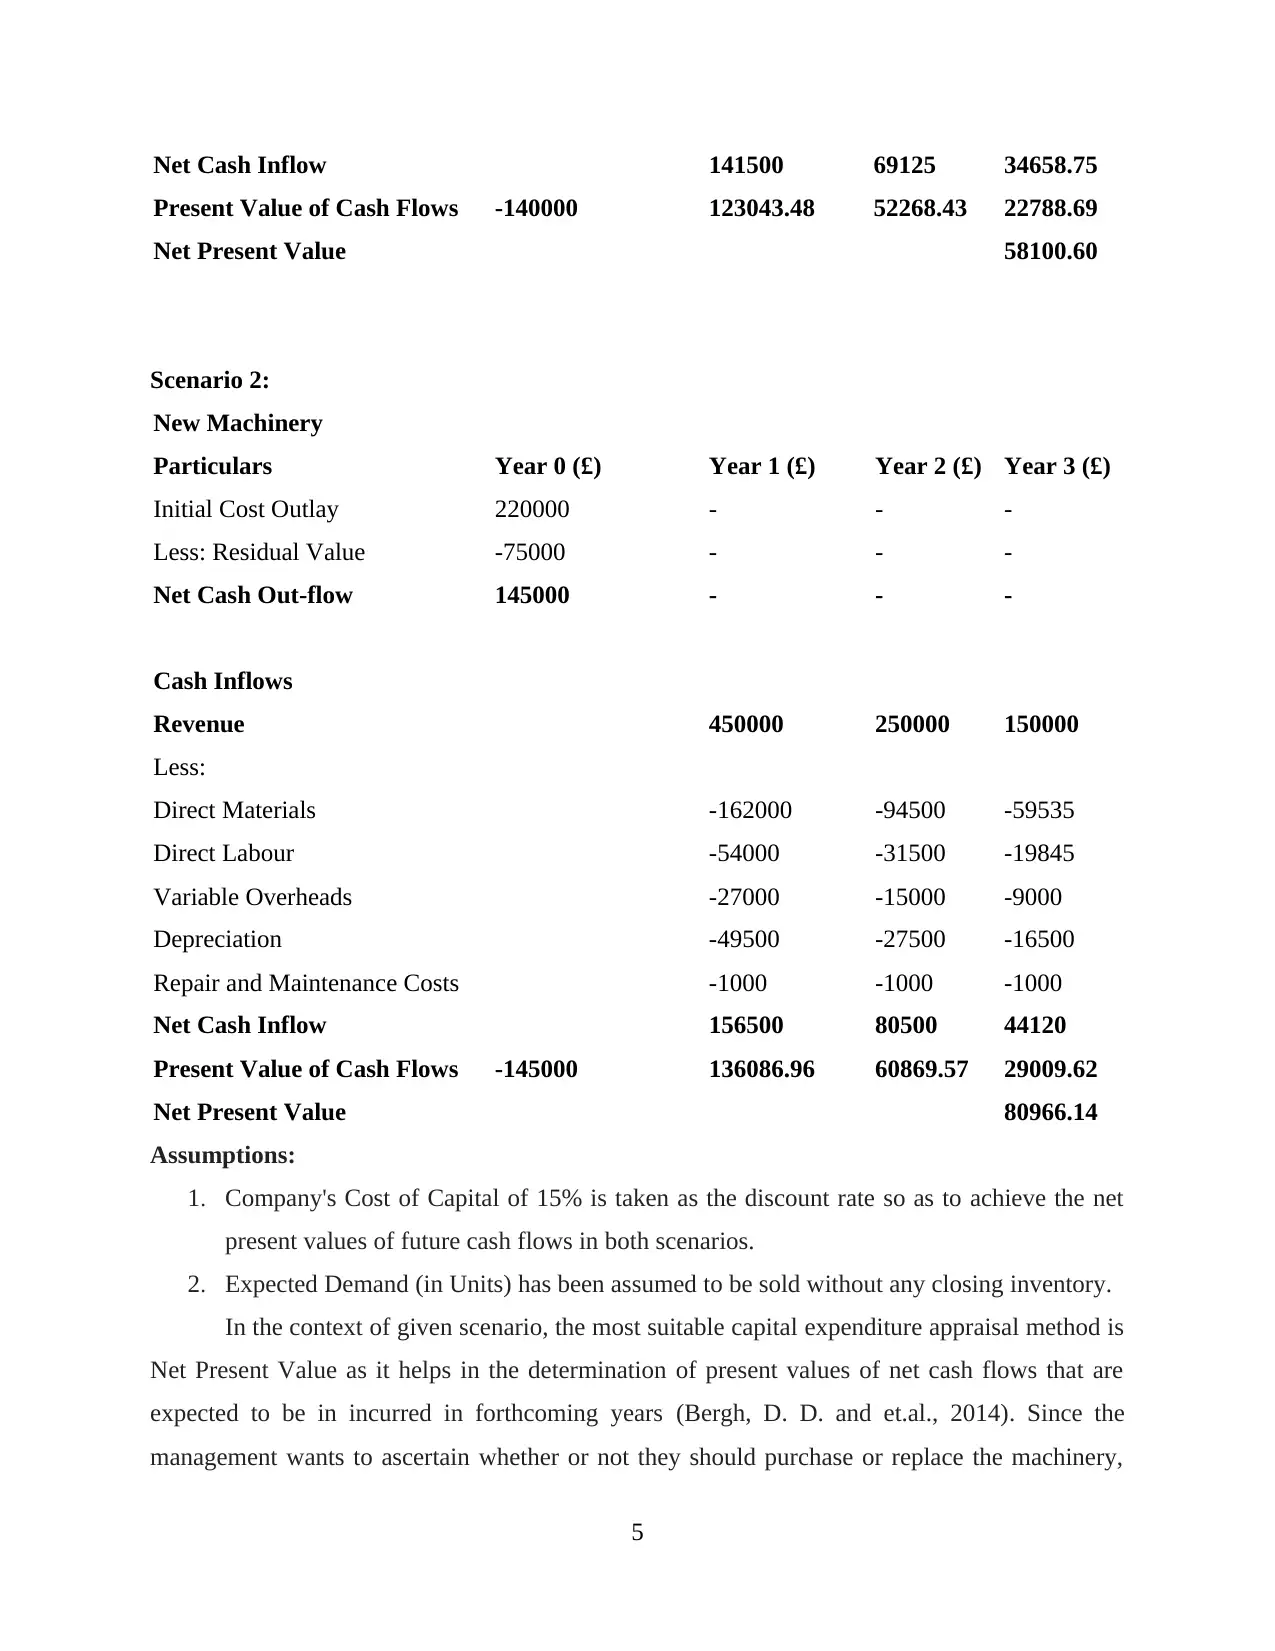
Net Cash Inflow 141500 69125 34658.75
Present Value of Cash Flows -140000 123043.48 52268.43 22788.69
Net Present Value 58100.60
Scenario 2:
New Machinery
Particulars Year 0 (£) Year 1 (£) Year 2 (£) Year 3 (£)
Initial Cost Outlay 220000 - - -
Less: Residual Value -75000 - - -
Net Cash Out-flow 145000 - - -
Cash Inflows
Revenue 450000 250000 150000
Less:
Direct Materials -162000 -94500 -59535
Direct Labour -54000 -31500 -19845
Variable Overheads -27000 -15000 -9000
Depreciation -49500 -27500 -16500
Repair and Maintenance Costs -1000 -1000 -1000
Net Cash Inflow 156500 80500 44120
Present Value of Cash Flows -145000 136086.96 60869.57 29009.62
Net Present Value 80966.14
Assumptions:
1. Company's Cost of Capital of 15% is taken as the discount rate so as to achieve the net
present values of future cash flows in both scenarios.
2. Expected Demand (in Units) has been assumed to be sold without any closing inventory.
In the context of given scenario, the most suitable capital expenditure appraisal method is
Net Present Value as it helps in the determination of present values of net cash flows that are
expected to be in incurred in forthcoming years (Bergh, D. D. and et.al., 2014). Since the
management wants to ascertain whether or not they should purchase or replace the machinery,
5
Paraphrase This Document
Need a fresh take? Get an instant paraphrase of this document with our AI Paraphraser
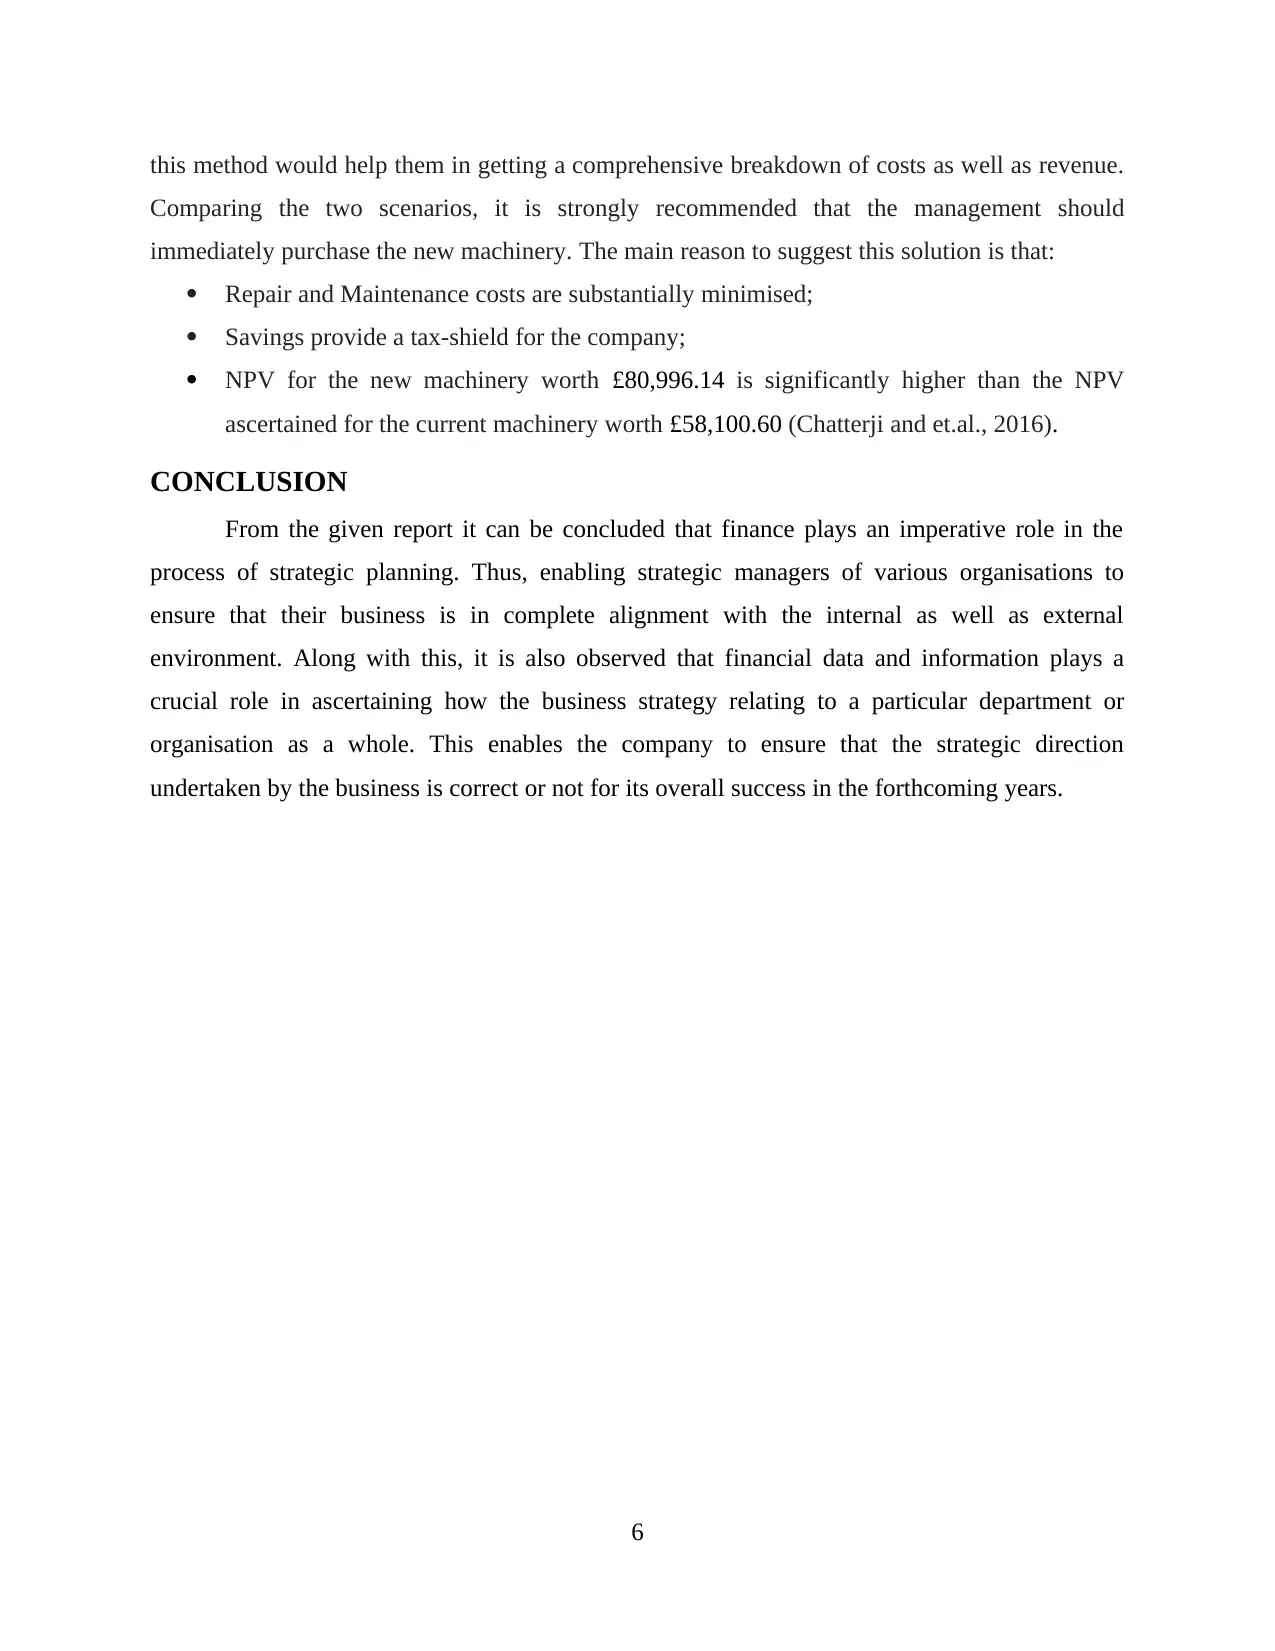
this method would help them in getting a comprehensive breakdown of costs as well as revenue.
Comparing the two scenarios, it is strongly recommended that the management should
immediately purchase the new machinery. The main reason to suggest this solution is that:
Repair and Maintenance costs are substantially minimised;
Savings provide a tax-shield for the company;
NPV for the new machinery worth £80,996.14 is significantly higher than the NPV
ascertained for the current machinery worth £58,100.60 (Chatterji and et.al., 2016).
CONCLUSION
From the given report it can be concluded that finance plays an imperative role in the
process of strategic planning. Thus, enabling strategic managers of various organisations to
ensure that their business is in complete alignment with the internal as well as external
environment. Along with this, it is also observed that financial data and information plays a
crucial role in ascertaining how the business strategy relating to a particular department or
organisation as a whole. This enables the company to ensure that the strategic direction
undertaken by the business is correct or not for its overall success in the forthcoming years.
6
REFERENCES
Books and Journal
Alkaraan, F., 2015. Strategic Investment Decision-Making Perspectives', Advances in Mergers
and Acquisitions (Advances in Mergers & Acquisitions, Volume 14).
Appuhami, R., 2017. Exploring the relationship between strategic performance measurement
systems and managers' creativity: the mediating role of psychological empowerment
and organisational learning. Accounting & Finance.
Basak, S. and Makarov, D., 2014. Strategic asset allocation in money management. The Journal
of Finance. 69(1). pp.179-217.
Bergh, D. D. and et.al., 2014. Signalling theory and equilibrium in strategic management
research: An assessment and a research agenda. Journal of Management Studies. 51(8).
pp.1334-1360.
Chatterji, A. K. and et.al., 2016. Do ratings of firms converge? Implications for managers,
investors and strategy researchers. Strategic Management Journal. 37(8). pp.1597-1614.
Online
Annual Report. 2018. [Online]. Available Through:
<https://images.samsung.com/is/content/samsung/p5/global/ir/docs/2018_con_quarter0
4_all.pdf>
Sales. 2019. [Online]. Available Through:
<https://news.samsung.com/global/samsung-electronics-announces-fourth-quarter-and-
fy-2018-results>
7
⊘ This is a preview!⊘
Do you want full access?
Subscribe today to unlock all pages.
Trusted by 1+ million students worldwide
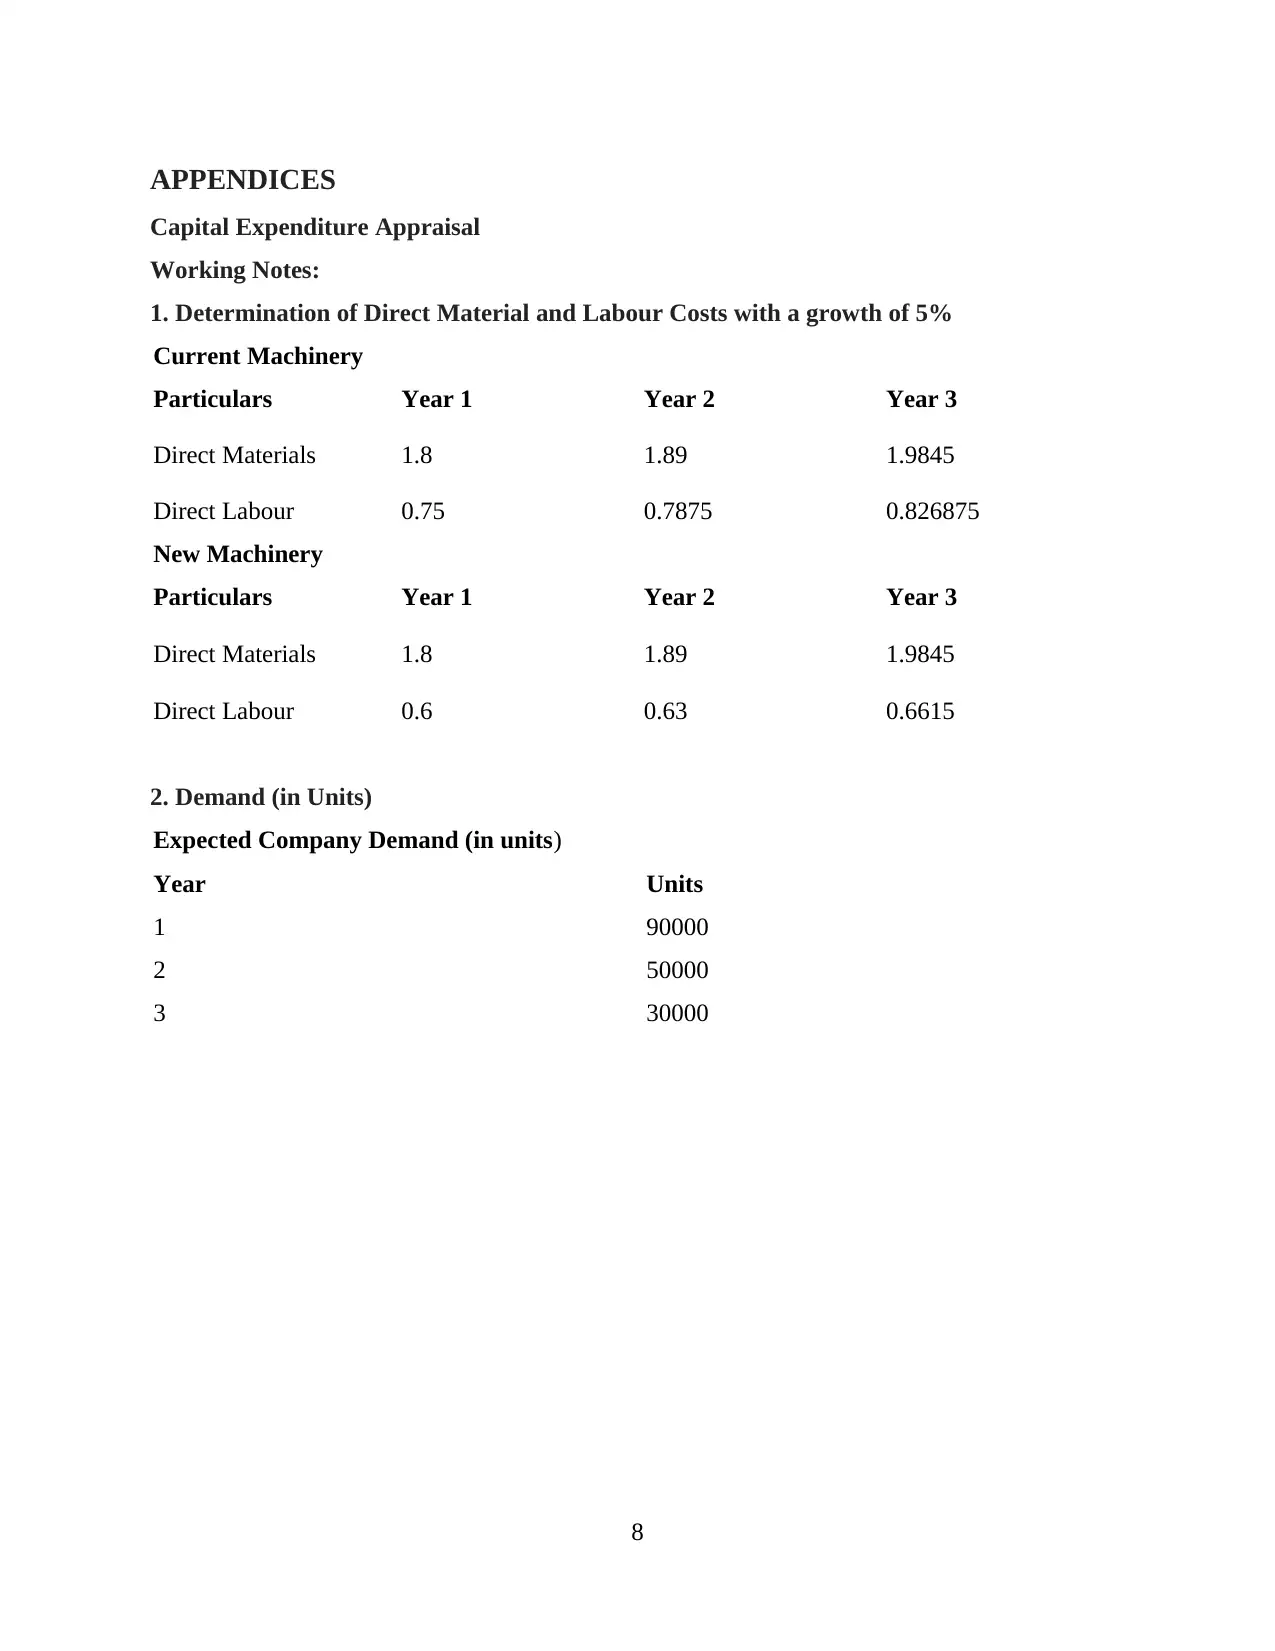
APPENDICES
Capital Expenditure Appraisal
Working Notes:
1. Determination of Direct Material and Labour Costs with a growth of 5%
Current Machinery
Particulars Year 1 Year 2 Year 3
Direct Materials 1.8 1.89 1.9845
Direct Labour 0.75 0.7875 0.826875
New Machinery
Particulars Year 1 Year 2 Year 3
Direct Materials 1.8 1.89 1.9845
Direct Labour 0.6 0.63 0.6615
2. Demand (in Units)
Expected Company Demand (in units)
Year Units
1 90000
2 50000
3 30000
8
1 out of 10
Related Documents


Your All-in-One AI-Powered Toolkit for Academic Success.
+13062052269
info@desklib.com
Available 24*7 on WhatsApp / Email
![[object Object]](/_next/static/media/star-bottom.7253800d.svg)
Unlock your academic potential
Copyright © 2020–2026 A2Z Services. All Rights Reserved. Developed and managed by ZUCOL.