HC2091 Business Finance: Comparative Analysis of Santos and Fortescue
VerifiedAdded on 2023/06/12
|17
|5344
|277
Case Study
AI Summary
This case study provides a comprehensive financial analysis of Santos Limited and Fortescue Metals Group Limited from 2016 to 2017, utilizing financial ratios to assess their performance and competitiveness. The analysis covers short-term solvency, long-term solvency, asset utilization, profitability, and market valuation ratios to determine the financial stability and progress of each company. Short-term solvency ratios, including current ratio, quick ratio, and cash flow from operations, are used to evaluate the companies' ability to meet short-term obligations. Long-term solvency ratios like debt to equity, debt to total assets, and leverage ratio are analyzed to understand their debt accumulation and operational capabilities. Asset utilization ratios, such as accounts receivable turnover, accounts payable turnover, and inventory turnover, are examined to assess management efficiency. Profitability ratios, including profit margin, return on assets, and return on equity, are used to determine the companies' earnings performance. Finally, market value ratios are considered to evaluate investor perception. The analysis concludes with a recommendation for potential investors based on the comparative financial health and stability of the two companies. Desklib provides access to similar solved assignments and past papers for students.
Running head: BUSINESS FINANCE
Business Finance
Name of the Student:
Name of the University:
Authors Note:
Business Finance
Name of the Student:
Name of the University:
Authors Note:
Paraphrase This Document
Need a fresh take? Get an instant paraphrase of this document with our AI Paraphraser
BUSINESS FINANCE
1
Introduction:
The overall assessment focuses on identifying the financial performance of Santos Limited
and Fortescue Metals Group Limited from 2016 to 2017. The financial performance of both
the companies are evaluated to identify the competitiveness in the market and how they could
maximize the profits over the period. The use of ratios such as short-term solvency ratio, long
term solvency ratio, asset utilisation ratio, profitability ratio, and market valuation ratio is
used to identify the financial progress of both the companies. These ratios also used to
determine the difference between the performance of both the companies, while identifying
the company which has the highest financial stability. Lastly, adequate recommendation is
provided to the investors who are willing to invest in the companies to generate higher rate of
return from investment.
BUSINESS FINANCE
2
Table of Contents
Analysis of the Financial Statement:..........................................................................................3
Short term solvency ratios:.........................................................................................................3
Long-term solvency ratios:........................................................................................................5
Asset-Utilisation ratios:..............................................................................................................7
Profitability ratios:.....................................................................................................................9
Market Value ratios:.................................................................................................................11
Conclusion:..............................................................................................................................12
Recommendation:....................................................................................................................13
Reference and Bibliography:....................................................................................................14
⊘ This is a preview!⊘
Do you want full access?
Subscribe today to unlock all pages.
Trusted by 1+ million students worldwide
BUSINESS FINANCE
3
Analysis of the Financial Statement:
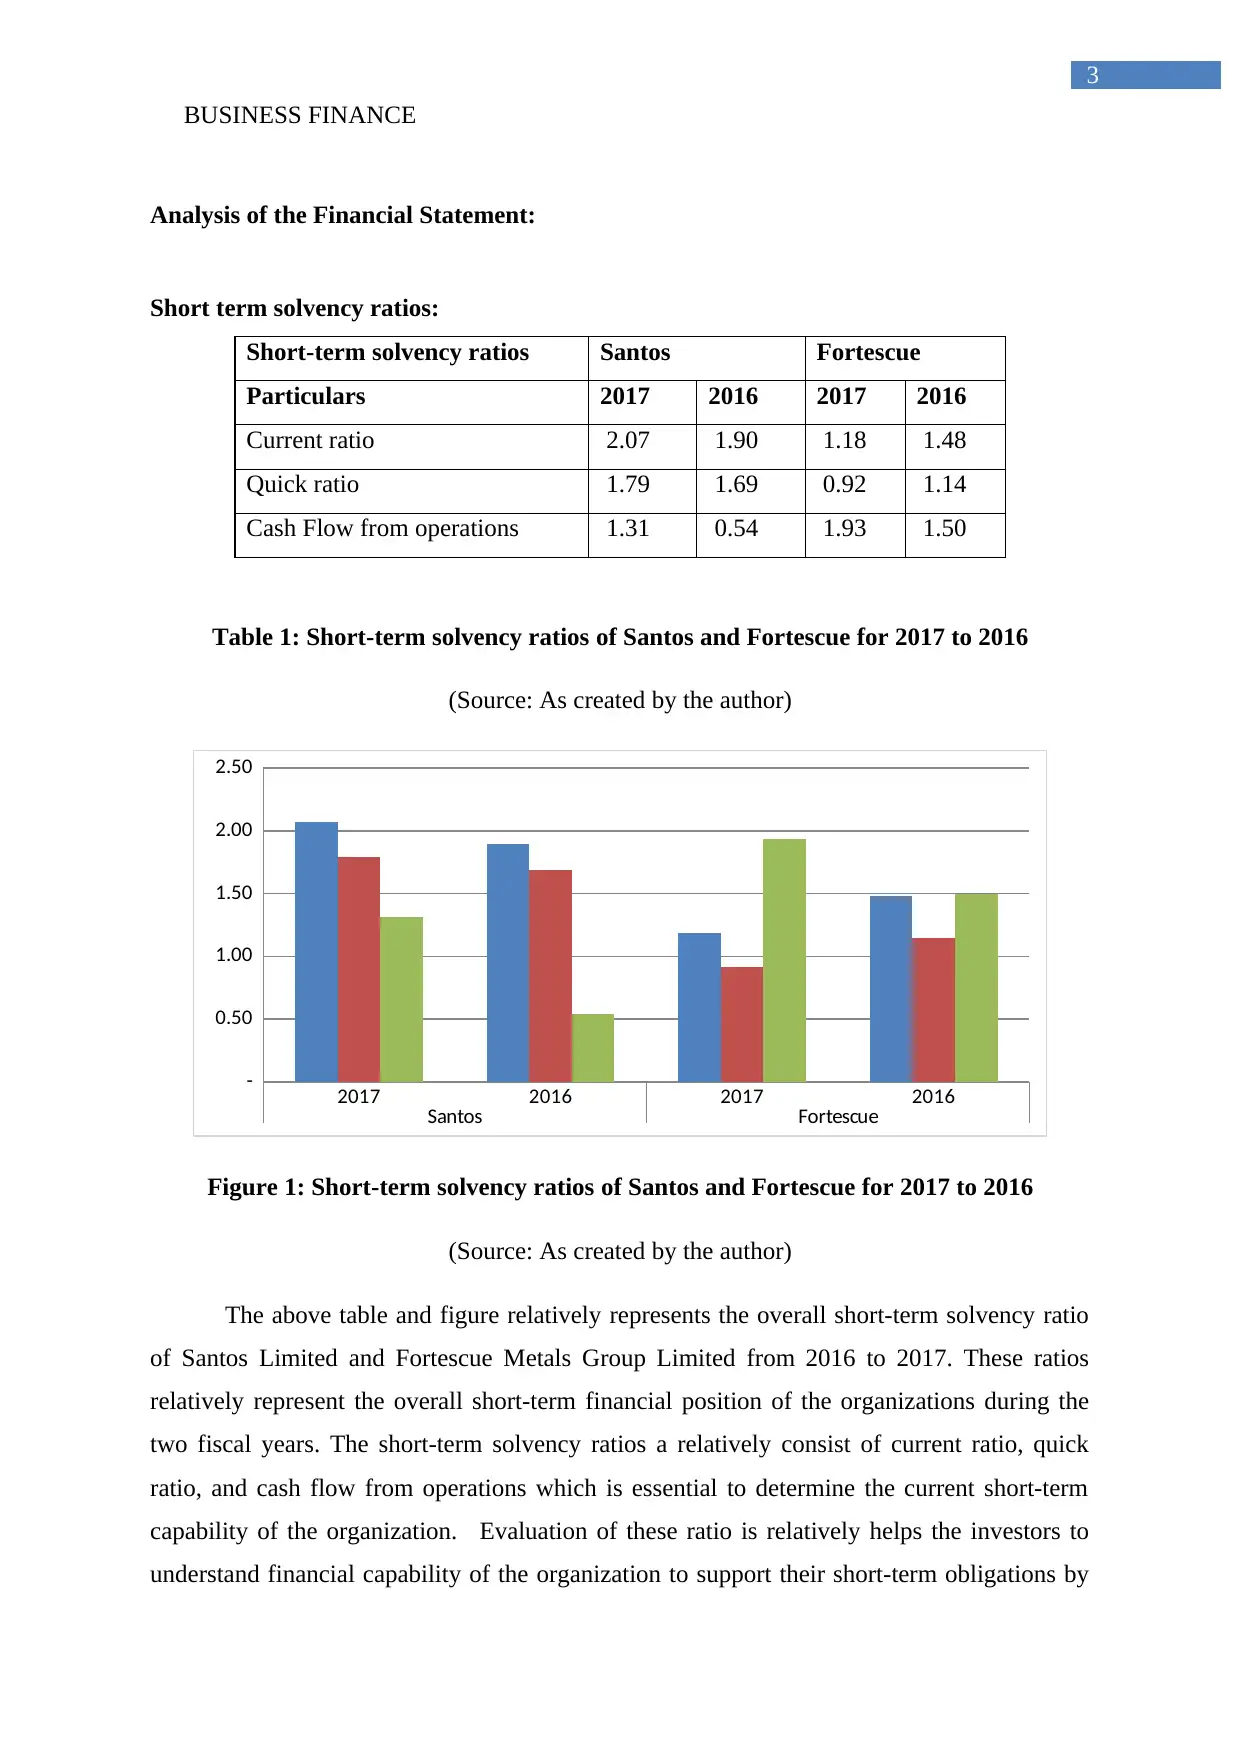
Short term solvency ratios:
Short-term solvency ratios Santos Fortescue
Particulars 2017 2016 2017 2016
Current ratio 2.07 1.90 1.18 1.48
Quick ratio 1.79 1.69 0.92 1.14
Cash Flow from operations 1.31 0.54 1.93 1.50
Table 1: Short-term solvency ratios of Santos and Fortescue for 2017 to 2016
(Source: As created by the author)
2017 2016 2017 2016
Santos Fortescue
-
0.50
1.00
1.50
2.00
2.50
Figure 1: Short-term solvency ratios of Santos and Fortescue for 2017 to 2016
(Source: As created by the author)
The above table and figure relatively represents the overall short-term solvency ratio
of Santos Limited and Fortescue Metals Group Limited from 2016 to 2017. These ratios
relatively represent the overall short-term financial position of the organizations during the
two fiscal years. The short-term solvency ratios a relatively consist of current ratio, quick
ratio, and cash flow from operations which is essential to determine the current short-term
capability of the organization. Evaluation of these ratio is relatively helps the investors to
understand financial capability of the organization to support their short-term obligations by
3
Analysis of the Financial Statement:
Short term solvency ratios:
Short-term solvency ratios Santos Fortescue
Particulars 2017 2016 2017 2016
Current ratio 2.07 1.90 1.18 1.48
Quick ratio 1.79 1.69 0.92 1.14
Cash Flow from operations 1.31 0.54 1.93 1.50
Table 1: Short-term solvency ratios of Santos and Fortescue for 2017 to 2016
(Source: As created by the author)
2017 2016 2017 2016
Santos Fortescue
-
0.50
1.00
1.50
2.00
2.50
Figure 1: Short-term solvency ratios of Santos and Fortescue for 2017 to 2016
(Source: As created by the author)
The above table and figure relatively represents the overall short-term solvency ratio
of Santos Limited and Fortescue Metals Group Limited from 2016 to 2017. These ratios
relatively represent the overall short-term financial position of the organizations during the
two fiscal years. The short-term solvency ratios a relatively consist of current ratio, quick
ratio, and cash flow from operations which is essential to determine the current short-term
capability of the organization. Evaluation of these ratio is relatively helps the investors to
understand financial capability of the organization to support their short-term obligations by
Paraphrase This Document
Need a fresh take? Get an instant paraphrase of this document with our AI Paraphraser
BUSINESS FINANCE
4
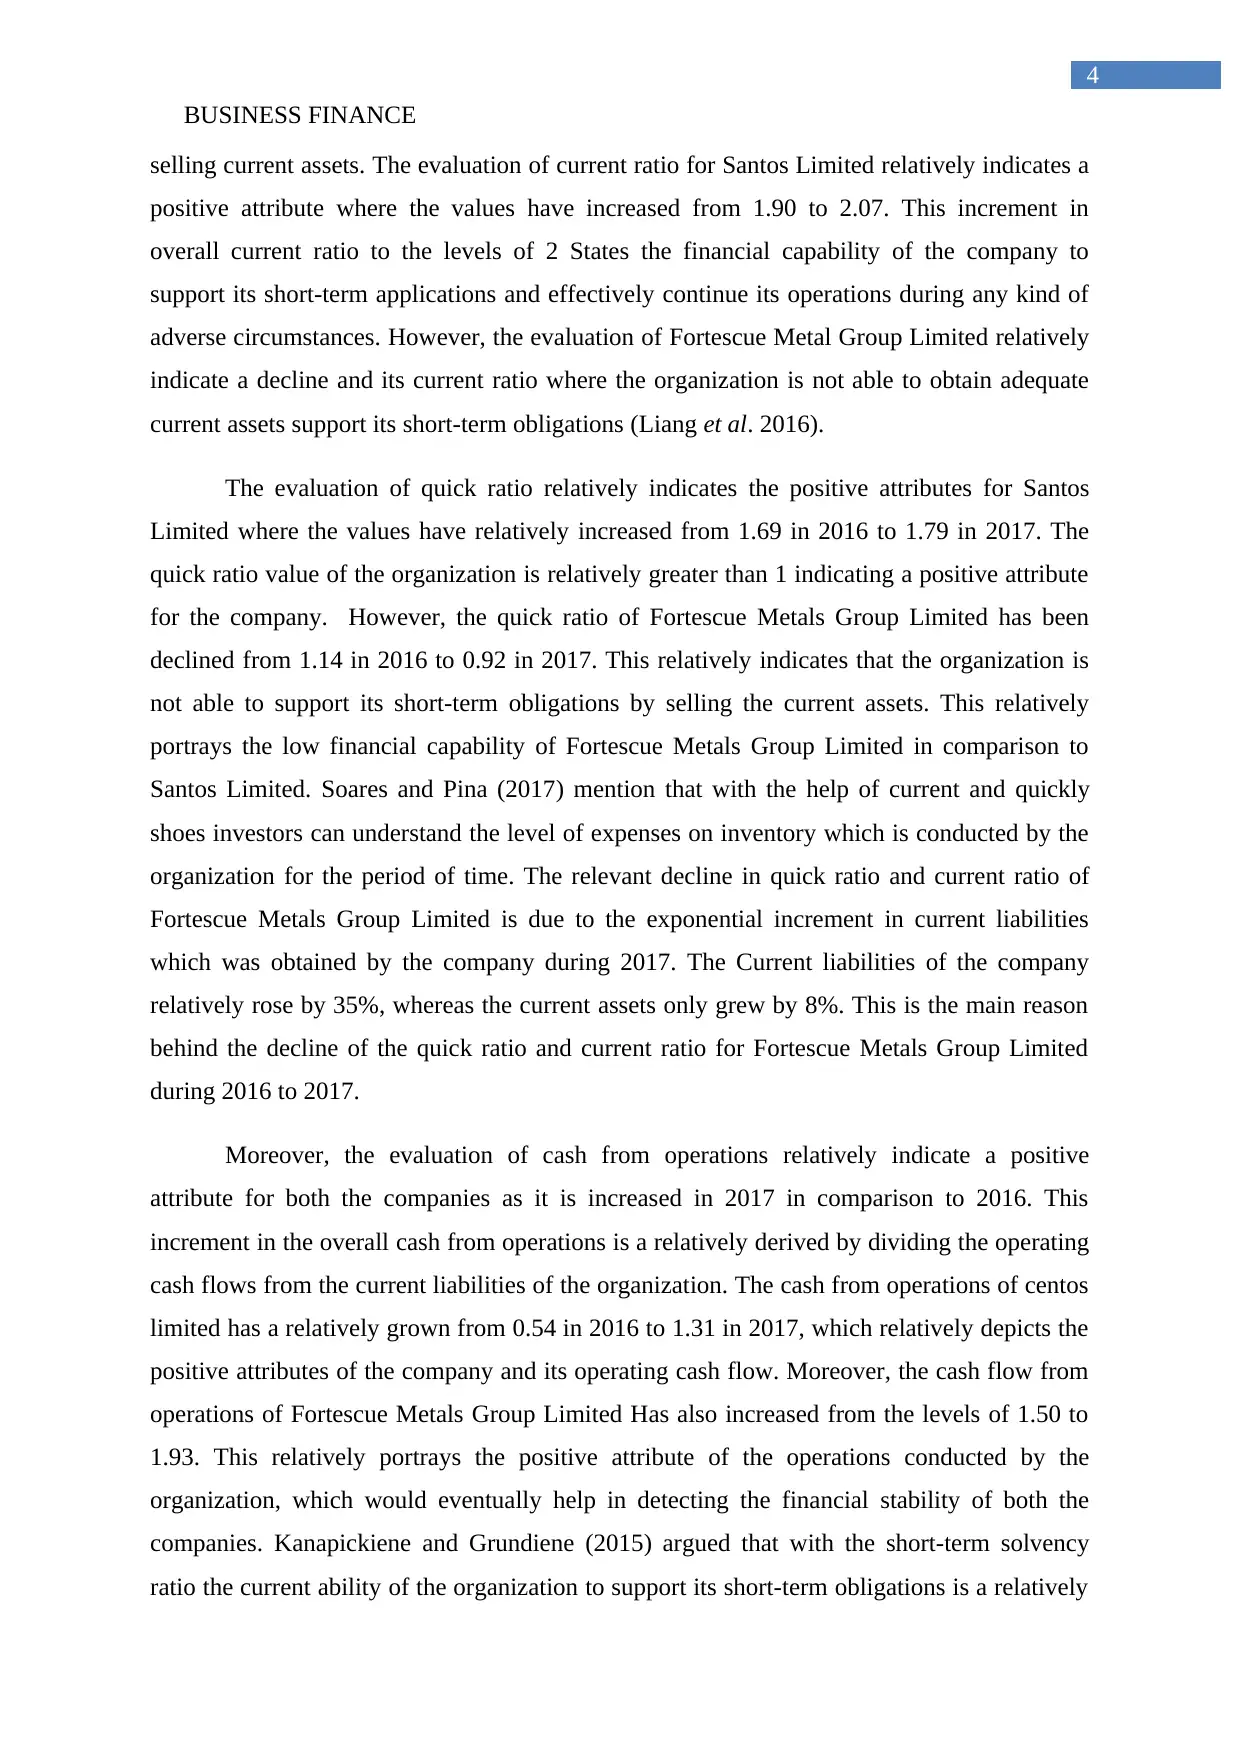
selling current assets. The evaluation of current ratio for Santos Limited relatively indicates a
positive attribute where the values have increased from 1.90 to 2.07. This increment in
overall current ratio to the levels of 2 States the financial capability of the company to
support its short-term applications and effectively continue its operations during any kind of
adverse circumstances. However, the evaluation of Fortescue Metal Group Limited relatively
indicate a decline and its current ratio where the organization is not able to obtain adequate
current assets support its short-term obligations (Liang et al. 2016).
The evaluation of quick ratio relatively indicates the positive attributes for Santos
Limited where the values have relatively increased from 1.69 in 2016 to 1.79 in 2017. The
quick ratio value of the organization is relatively greater than 1 indicating a positive attribute
for the company. However, the quick ratio of Fortescue Metals Group Limited has been
declined from 1.14 in 2016 to 0.92 in 2017. This relatively indicates that the organization is
not able to support its short-term obligations by selling the current assets. This relatively
portrays the low financial capability of Fortescue Metals Group Limited in comparison to
Santos Limited. Soares and Pina (2017) mention that with the help of current and quickly
shoes investors can understand the level of expenses on inventory which is conducted by the
organization for the period of time. The relevant decline in quick ratio and current ratio of
Fortescue Metals Group Limited is due to the exponential increment in current liabilities
which was obtained by the company during 2017. The Current liabilities of the company
relatively rose by 35%, whereas the current assets only grew by 8%. This is the main reason
behind the decline of the quick ratio and current ratio for Fortescue Metals Group Limited
during 2016 to 2017.
Moreover, the evaluation of cash from operations relatively indicate a positive
attribute for both the companies as it is increased in 2017 in comparison to 2016. This
increment in the overall cash from operations is a relatively derived by dividing the operating
cash flows from the current liabilities of the organization. The cash from operations of centos
limited has a relatively grown from 0.54 in 2016 to 1.31 in 2017, which relatively depicts the
positive attributes of the company and its operating cash flow. Moreover, the cash flow from
operations of Fortescue Metals Group Limited Has also increased from the levels of 1.50 to
1.93. This relatively portrays the positive attribute of the operations conducted by the
organization, which would eventually help in detecting the financial stability of both the
companies. Kanapickiene and Grundiene (2015) argued that with the short-term solvency
ratio the current ability of the organization to support its short-term obligations is a relatively
4
selling current assets. The evaluation of current ratio for Santos Limited relatively indicates a
positive attribute where the values have increased from 1.90 to 2.07. This increment in
overall current ratio to the levels of 2 States the financial capability of the company to
support its short-term applications and effectively continue its operations during any kind of
adverse circumstances. However, the evaluation of Fortescue Metal Group Limited relatively
indicate a decline and its current ratio where the organization is not able to obtain adequate
current assets support its short-term obligations (Liang et al. 2016).
The evaluation of quick ratio relatively indicates the positive attributes for Santos
Limited where the values have relatively increased from 1.69 in 2016 to 1.79 in 2017. The
quick ratio value of the organization is relatively greater than 1 indicating a positive attribute
for the company. However, the quick ratio of Fortescue Metals Group Limited has been
declined from 1.14 in 2016 to 0.92 in 2017. This relatively indicates that the organization is
not able to support its short-term obligations by selling the current assets. This relatively
portrays the low financial capability of Fortescue Metals Group Limited in comparison to
Santos Limited. Soares and Pina (2017) mention that with the help of current and quickly
shoes investors can understand the level of expenses on inventory which is conducted by the
organization for the period of time. The relevant decline in quick ratio and current ratio of
Fortescue Metals Group Limited is due to the exponential increment in current liabilities
which was obtained by the company during 2017. The Current liabilities of the company
relatively rose by 35%, whereas the current assets only grew by 8%. This is the main reason
behind the decline of the quick ratio and current ratio for Fortescue Metals Group Limited
during 2016 to 2017.
Moreover, the evaluation of cash from operations relatively indicate a positive
attribute for both the companies as it is increased in 2017 in comparison to 2016. This
increment in the overall cash from operations is a relatively derived by dividing the operating
cash flows from the current liabilities of the organization. The cash from operations of centos
limited has a relatively grown from 0.54 in 2016 to 1.31 in 2017, which relatively depicts the
positive attributes of the company and its operating cash flow. Moreover, the cash flow from
operations of Fortescue Metals Group Limited Has also increased from the levels of 1.50 to
1.93. This relatively portrays the positive attribute of the operations conducted by the
organization, which would eventually help in detecting the financial stability of both the
companies. Kanapickiene and Grundiene (2015) argued that with the short-term solvency
ratio the current ability of the organization to support its short-term obligations is a relatively
BUSINESS FINANCE
5
detected, while the ratio does not evaluate actual solvency position of the organization. From
the overall evaluation of the short-term solvency calculations it could be identified that
Santos Limited has achieved higher valuation in comparison to Fortescue Metals Group
Limited.
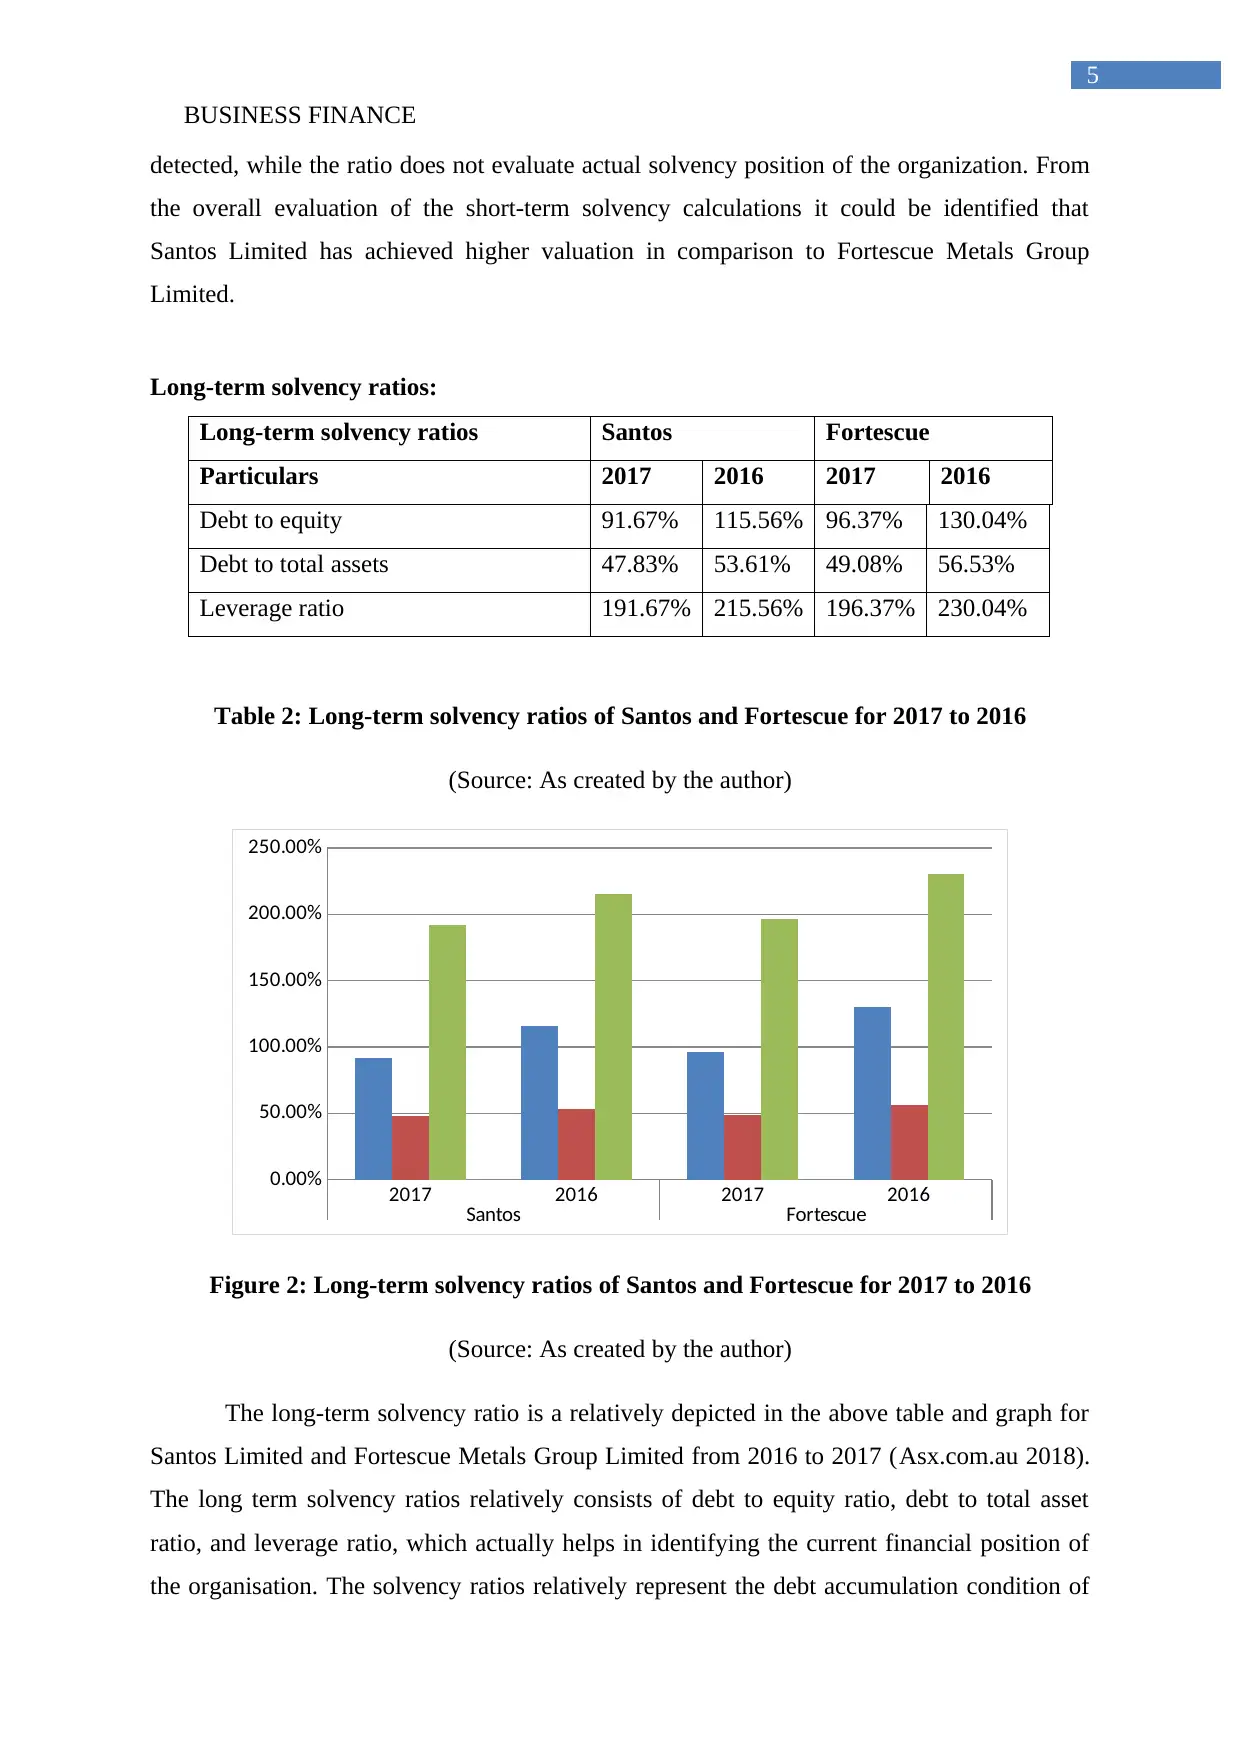
Long-term solvency ratios:
Long-term solvency ratios Santos Fortescue
Particulars 2017 2016 2017 2016
Debt to equity 91.67% 115.56% 96.37% 130.04%
Debt to total assets 47.83% 53.61% 49.08% 56.53%
Leverage ratio 191.67% 215.56% 196.37% 230.04%
Table 2: Long-term solvency ratios of Santos and Fortescue for 2017 to 2016
(Source: As created by the author)
2017 2016 2017 2016
Santos Fortescue
0.00%
50.00%
100.00%
150.00%
200.00%
250.00%
Figure 2: Long-term solvency ratios of Santos and Fortescue for 2017 to 2016
(Source: As created by the author)
The long-term solvency ratio is a relatively depicted in the above table and graph for
Santos Limited and Fortescue Metals Group Limited from 2016 to 2017 (Asx.com.au 2018).
The long term solvency ratios relatively consists of debt to equity ratio, debt to total asset
ratio, and leverage ratio, which actually helps in identifying the current financial position of
the organisation. The solvency ratios relatively represent the debt accumulation condition of
5
detected, while the ratio does not evaluate actual solvency position of the organization. From
the overall evaluation of the short-term solvency calculations it could be identified that
Santos Limited has achieved higher valuation in comparison to Fortescue Metals Group
Limited.
Long-term solvency ratios:
Long-term solvency ratios Santos Fortescue
Particulars 2017 2016 2017 2016
Debt to equity 91.67% 115.56% 96.37% 130.04%
Debt to total assets 47.83% 53.61% 49.08% 56.53%
Leverage ratio 191.67% 215.56% 196.37% 230.04%
Table 2: Long-term solvency ratios of Santos and Fortescue for 2017 to 2016
(Source: As created by the author)
2017 2016 2017 2016
Santos Fortescue
0.00%
50.00%
100.00%
150.00%
200.00%
250.00%
Figure 2: Long-term solvency ratios of Santos and Fortescue for 2017 to 2016
(Source: As created by the author)
The long-term solvency ratio is a relatively depicted in the above table and graph for
Santos Limited and Fortescue Metals Group Limited from 2016 to 2017 (Asx.com.au 2018).
The long term solvency ratios relatively consists of debt to equity ratio, debt to total asset
ratio, and leverage ratio, which actually helps in identifying the current financial position of
the organisation. The solvency ratios relatively represent the debt accumulation condition of
⊘ This is a preview!⊘
Do you want full access?
Subscribe today to unlock all pages.
Trusted by 1+ million students worldwide
BUSINESS FINANCE
6
the organisation and its ability to support its operations without increasing the finance cost. In
this context, Buchman, Harris and Liu (2016) stated that with the help of solvency ratio
investors can ensure the investment scope in an organisation, as the company will not go
bankrupt due to insolvency conditions. From the valuation it could be identified that the debt
equity ratio of the company has a relatively declined from the levels of 115.5 six percent in
2016 to 91.67% in 2017. This relatively indicates that the reduction in debt is conducted by
Santos Limited during the fiscal year of 2017, which has effectively improved the operational
capability of the company. However, from the valuation it could also been identified that the
debt to equity ratio of Fortescue Metals Group Limited Also improved from the levels of 130
point 0% in 2016 to 96.7% in 2017. This is relatively indicating the low debt accumulation
conducted by the company over the period.
Moreover, the calculation also helps in identifying the debt to total assets ratio of both
Santos Limited and Fortescue Metals Group Limited From 2016 to 2017. The values of
Santos Limited has a relatively declined from the levels of 53.61% in 2016 to 47.3% in 2017.
The value was relatively obtained as the total liabilities of the company relatively reduced by
20% in 2017 in comparison to 2016. On the same instant, the total Assets of the company
only decline 10% which relatively indicated the use of equity for purchasing the Assets of the
organisation. This mainly indicates that debt was not utilised by the company to increase its
asset accumulation during 2017. Furthermore, Fortescue Metals Group Limited has witnessed
the same decline in its debt to total assets ratio, where the values have declined from the level
of 56.53% in 2016 to 49.08% in 2017. The declining magnitude of the ratio was relatively
higher than its competitor due to the production in total assets by only 1% and total liabilities
by only 14%. This relatively indicates that the company has decline the utilisation of debt for
acquiring the relevant assets which is used in its operations. This is a positive sign, as the
company’s production in debt eventually help in reducing the finance cost and maximize
their profit level (Paul and Mitra 2017).
Further evaluation of leverage ratio relatively indicates the use of debt in operations
of the organisation. The Leverage ratio of both Santos Limited and Fortescue Metals Group
Limited has declined during the two-fiscal year, as the companies have reduced the debt
accumulation in their operations. Therefore, the leverage ratio of centos Limited as a
relatively declined from 215.56% to 191.67% in 2017. The declining values of leverage ratio
relatively indicates the less use of debt in the operations of the organisation, which depicts the
positive attribute of the company. On the other hand, the values of, Fortescue Metals Group
Paraphrase This Document
Need a fresh take? Get an instant paraphrase of this document with our AI Paraphraser
BUSINESS FINANCE
7
Limited only declined from the levels of 230.04% in 2016 to 196.37% in 2017.
Consequently, the evaluation of long term solvency ratios relatively indicate that Santos
Limited’s financial position is relatively high in comparison to Fortescue Metals Group
Limited (Asx.com.au 2018).
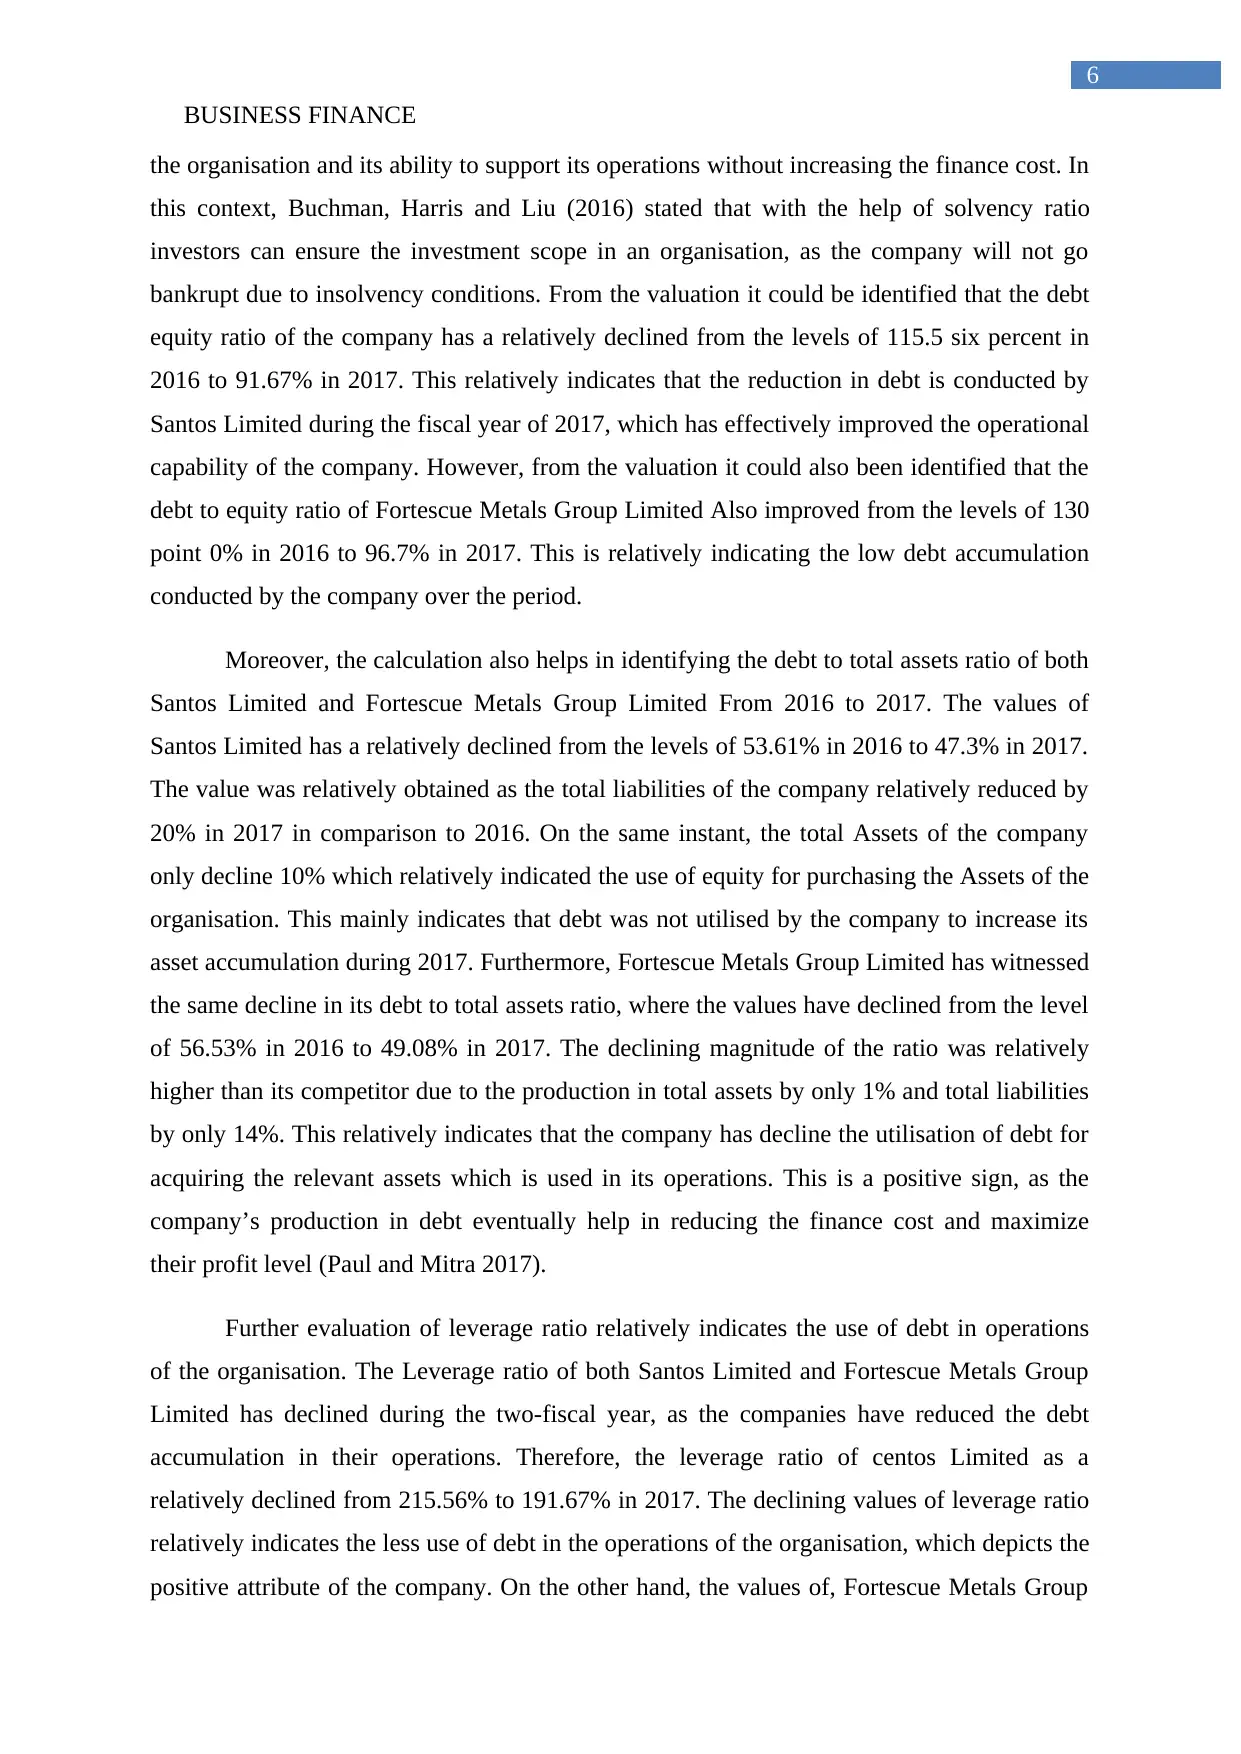
Asset-Utilisation ratios:
Asset-Utilisation ratios Santos Fortescue
Particulars 2017 2016 2017 2016
Accounts receivable turnover 7.70 6.84 44.23 26.63
Accounts payable turnover 4.48 3.78 7.35 7.44
Inventory turnover 7.74 6.32 8.56 7.63
Table 3: Asset-Utilisation ratios of Santos and Fortescue for 2017 to 2016
(Source: As created by the author)
2017 2016 2017 2016
Santos Fortescue
-
5.00
10.00
15.00
20.00
25.00
30.00
35.00
40.00
45.00
50.00
Figure 3: Asset-Utilisation ratios of Santos and Fortescue for 2017 to 2016
(Source: As created by the author)
The table and figure 3 relevantly indicates the Asset-Utilisation ratios of Santos
Limited’s and Fortescue Metals Group from 2016 to 2017. This would relevantly help in
identifying the management efficiency in utilising the available assets to maximize profits
from operations. The calculations are relatively focused on accounts receivable turnover,
accounts payable turnover and inventory turnover, which could help in understanding the
7
Limited only declined from the levels of 230.04% in 2016 to 196.37% in 2017.
Consequently, the evaluation of long term solvency ratios relatively indicate that Santos
Limited’s financial position is relatively high in comparison to Fortescue Metals Group
Limited (Asx.com.au 2018).
Asset-Utilisation ratios:
Asset-Utilisation ratios Santos Fortescue
Particulars 2017 2016 2017 2016
Accounts receivable turnover 7.70 6.84 44.23 26.63
Accounts payable turnover 4.48 3.78 7.35 7.44
Inventory turnover 7.74 6.32 8.56 7.63
Table 3: Asset-Utilisation ratios of Santos and Fortescue for 2017 to 2016
(Source: As created by the author)
2017 2016 2017 2016
Santos Fortescue
-
5.00
10.00
15.00
20.00
25.00
30.00
35.00
40.00
45.00
50.00
Figure 3: Asset-Utilisation ratios of Santos and Fortescue for 2017 to 2016
(Source: As created by the author)
The table and figure 3 relevantly indicates the Asset-Utilisation ratios of Santos
Limited’s and Fortescue Metals Group from 2016 to 2017. This would relevantly help in
identifying the management efficiency in utilising the available assets to maximize profits
from operations. The calculations are relatively focused on accounts receivable turnover,
accounts payable turnover and inventory turnover, which could help in understanding the
BUSINESS FINANCE
8
level of Efficiency of the organisations. The use of accounts receivable turnover ratio would
eventually help in identifying how quickly the debtors are giving back the overall credits
provided by the organisation. This would eventually help in understanding the level of cash
that is being accumulated by the company over the period of time. Moreover, with the help of
accounts payable turnover ratio the creditors or suppliers position on the current purchases of
the company is evaluated (Gunawardena et al. 2015). This relatively indicates the credit limit
that is provided by the supplies to the company, which relatively helps in detecting the trust
of suppliers on the organisation’s capability to pay back their credit. Lastly, with the help of
inventory turnover ratio the efficiency of the company in blocking the essential working
capital as the end when she is evaluated.
The overall asset utilisation ratio such as accounts receivable turnover has a relatively
improved for Santos Limited, where the values have increased from the level of 6.84 to 7.70
in 2017. This relevantly indicates the positive attributes of Santhosh Limited, as its overall
accounts receivable has improved over the period. this mainly indicates that the payments
from customer increasing and allowing the organisation to accumulate adequate cash from its
sale. However, Fortescue Metals Group overall accounts receivable turnover has increased
from 26.63 to 44.23 in 2017, which indicates high efficiency made by the organisation to
increase its payment collection. The high accounts receivable turnover is due to the reduction
in accounts receivable over the fiscal year while sales has relatively improved. This indicates
that customers are paying their dues quickly to acquire the products of the organisation (Chen
et al. 2016).
The account payable turnover ratios of Santos Limited has mainly increased from
3.78 in 2016 to 4.17 in 2017, which relatively indicates the high credit level that is provided
by the suppliers to the company. The increment in value is due to the reduction in accounts
payable and increment in cost of goods sold by the company. On the other hand, the values of
accounts payable turnover ratio of Fortescue Metals Group Mini declined from the levels of
7.44 in 2016 to 7.35 in 2017. The declining value of accounts payables was achieved due to
the reduction in cost of goods sold, while increment in accounts payable value. Lastly, the
inventory turnover ratio of both the companies has a relatively improve over the period of 2
fiscal years, which indicates the effectiveness and efficiency of the management in selling its
products (Choi, Kim and Oh 2017).
⊘ This is a preview!⊘
Do you want full access?
Subscribe today to unlock all pages.
Trusted by 1+ million students worldwide
BUSINESS FINANCE
9
The increment in inventory turnover ratio for Santos Limited was due to the declining
values of inventory and increasing values of cost of goods sold. this is a relatively indicated
that the company has effectively sold maximum number of products which has been
accumulated in the inventory. Moreover, from the evaluation of Fortescue Metals Group
annual report it could be detected that the company has effectively increased its inventory
collection but the cost of goods sold has relatively declined indicating a positive attribute for
the company, as its overall inventory turnover ratio increased. Hence, from the evaluation it
could be identified that Fortescue Metals Group asset utilisation ratio is a relatively higher
than Santos Limited (Schmidgall and DeFranco 2016).
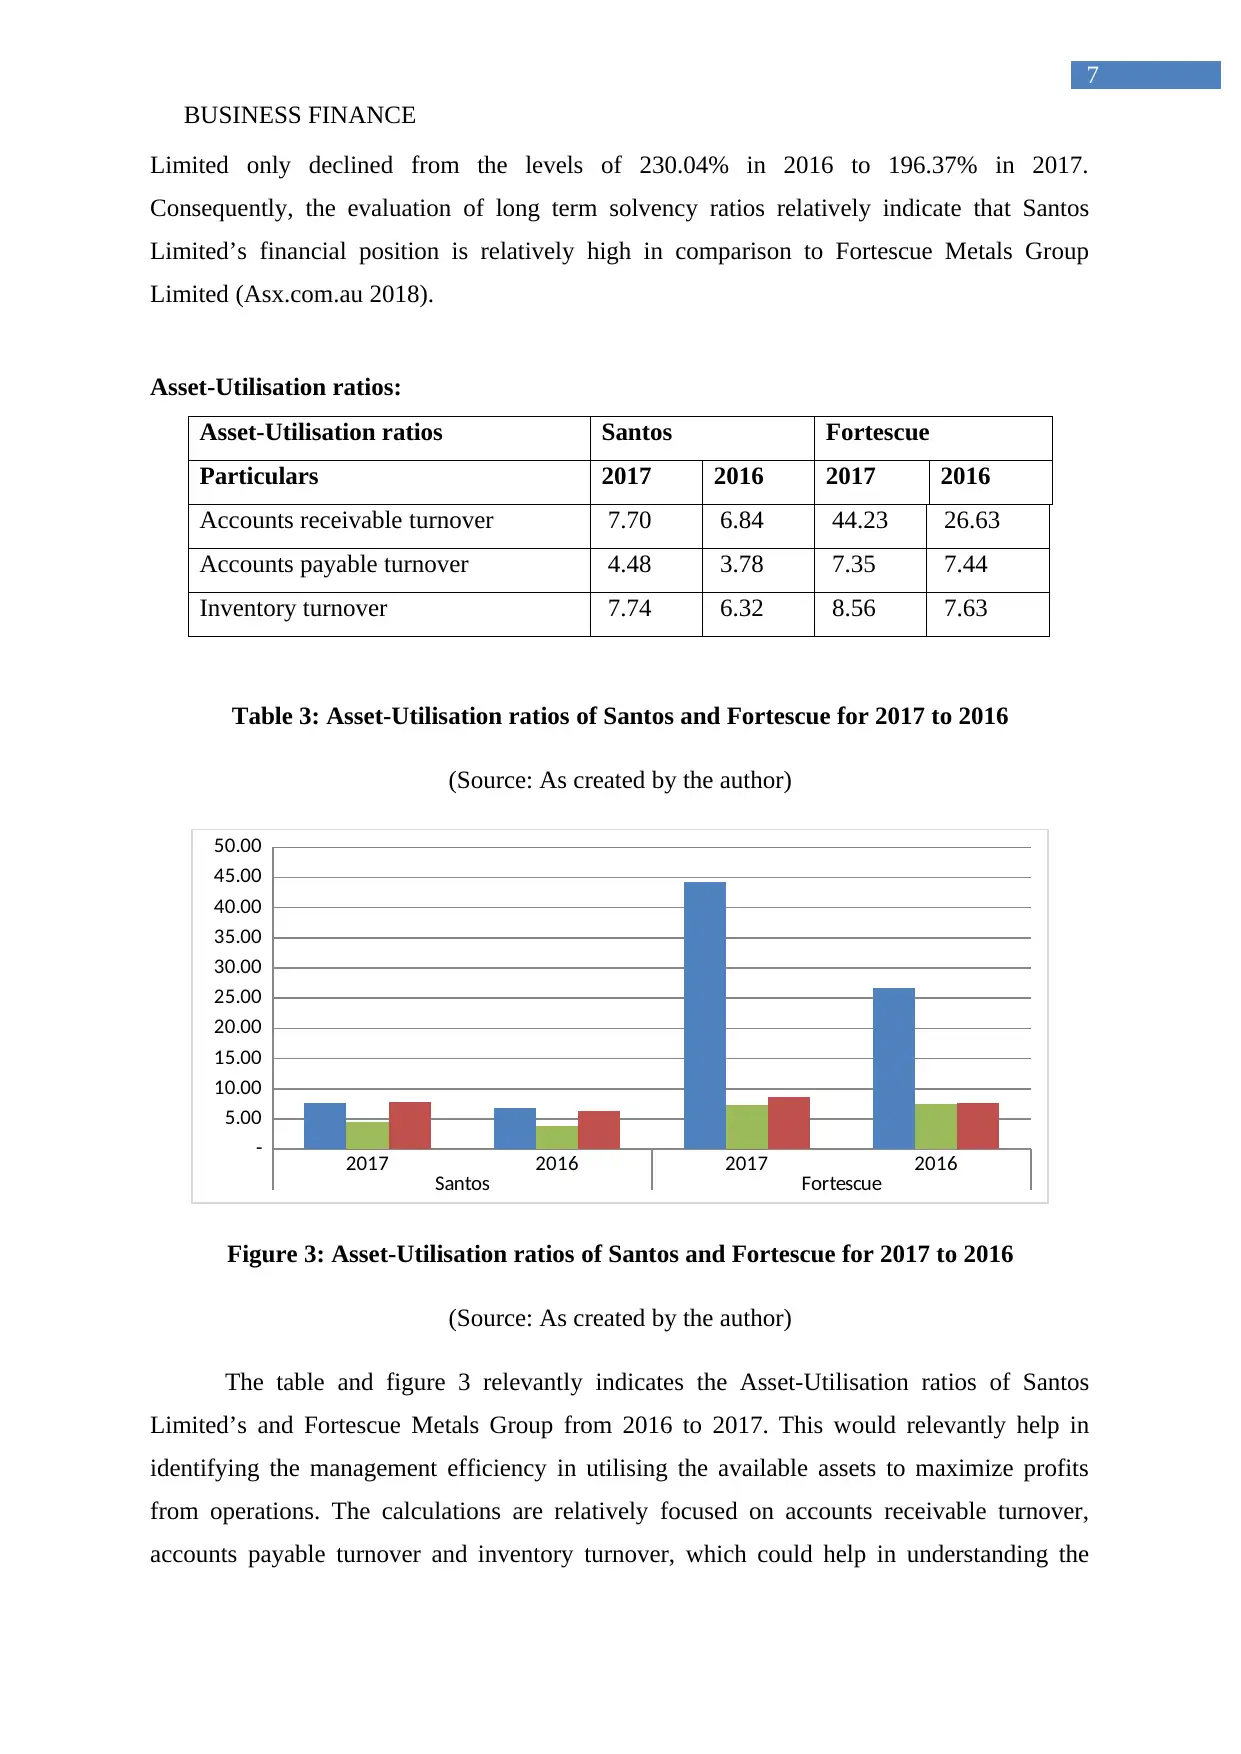
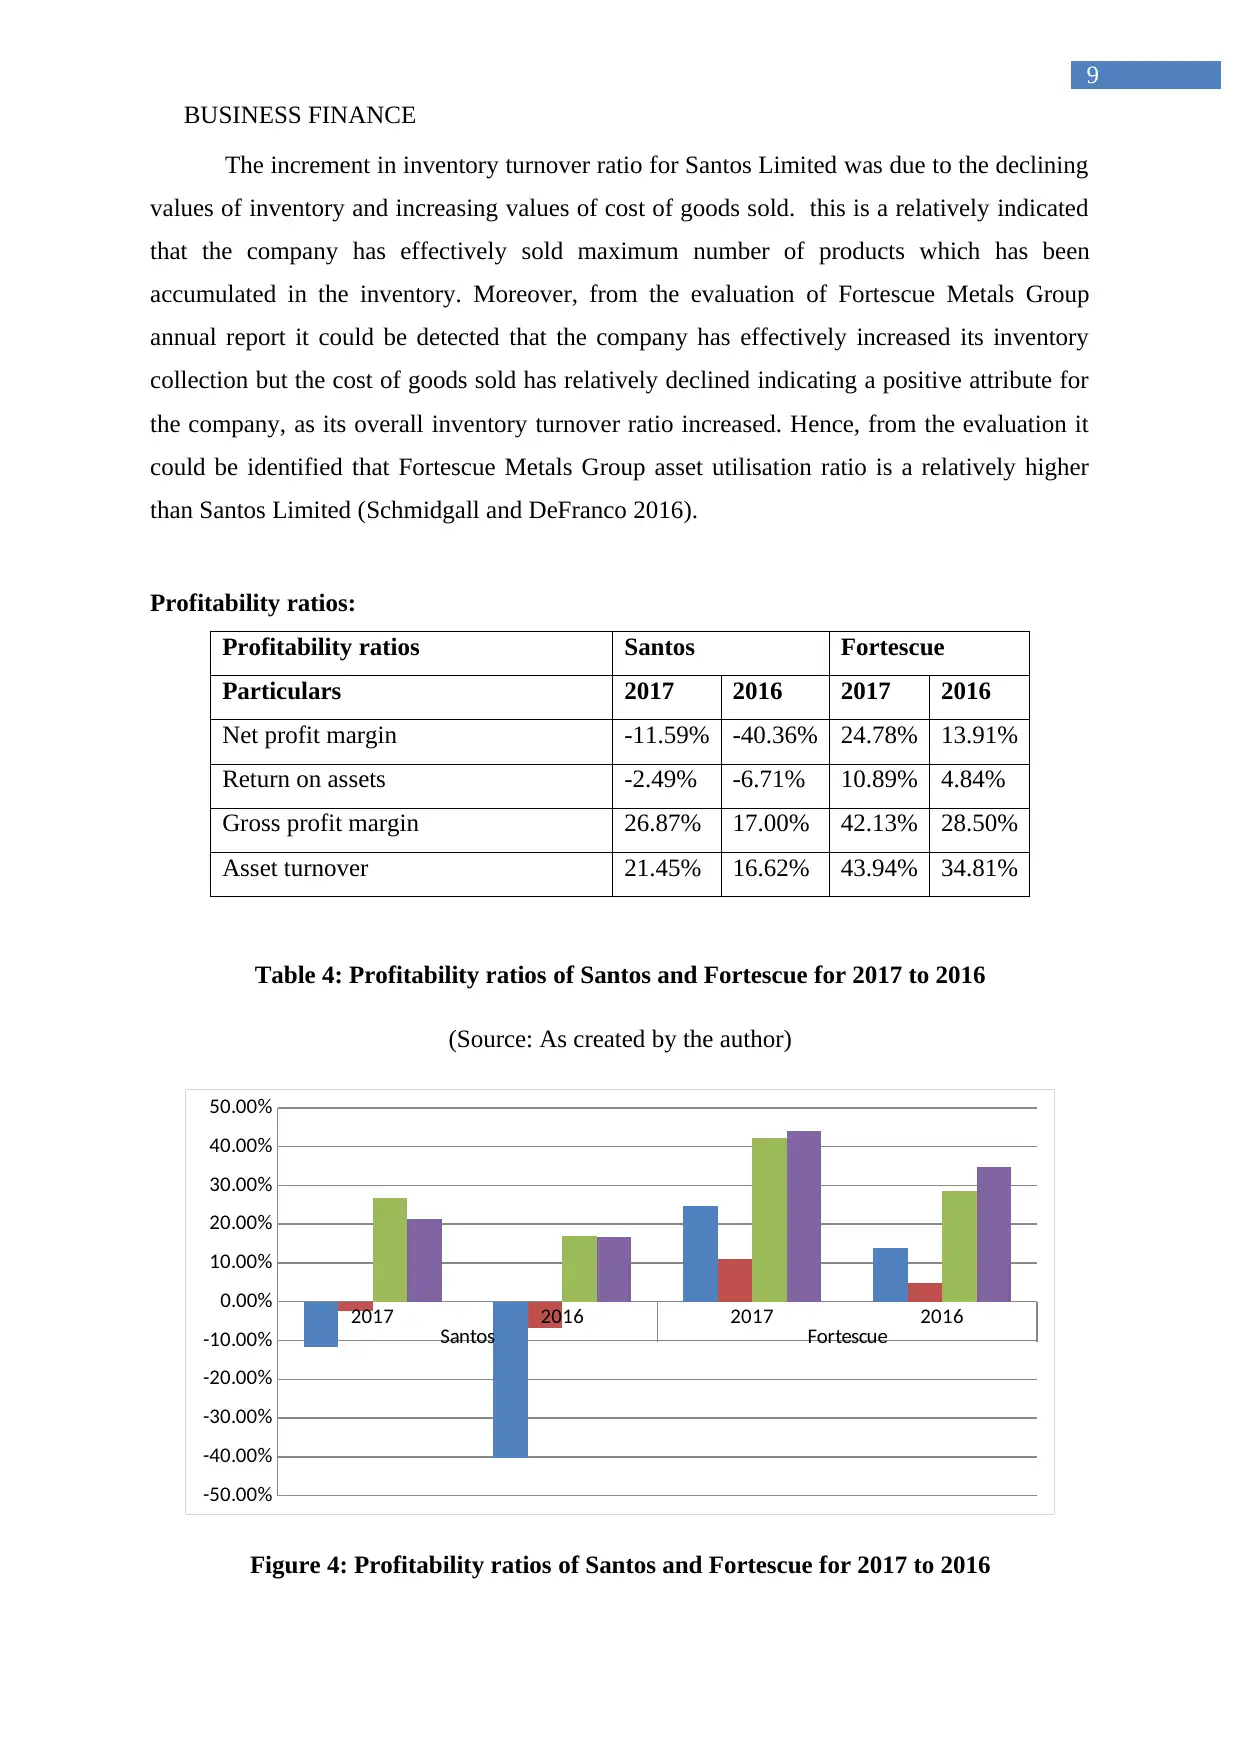
Profitability ratios:
Profitability ratios Santos Fortescue
Particulars 2017 2016 2017 2016
Net profit margin -11.59% -40.36% 24.78% 13.91%
Return on assets -2.49% -6.71% 10.89% 4.84%
Gross profit margin 26.87% 17.00% 42.13% 28.50%
Asset turnover 21.45% 16.62% 43.94% 34.81%
Table 4: Profitability ratios of Santos and Fortescue for 2017 to 2016
(Source: As created by the author)
2017 2016 2017 2016
Santos Fortescue
-50.00%
-40.00%
-30.00%
-20.00%
-10.00%
0.00%
10.00%
20.00%
30.00%
40.00%
50.00%
Figure 4: Profitability ratios of Santos and Fortescue for 2017 to 2016
9
The increment in inventory turnover ratio for Santos Limited was due to the declining
values of inventory and increasing values of cost of goods sold. this is a relatively indicated
that the company has effectively sold maximum number of products which has been
accumulated in the inventory. Moreover, from the evaluation of Fortescue Metals Group
annual report it could be detected that the company has effectively increased its inventory
collection but the cost of goods sold has relatively declined indicating a positive attribute for
the company, as its overall inventory turnover ratio increased. Hence, from the evaluation it
could be identified that Fortescue Metals Group asset utilisation ratio is a relatively higher
than Santos Limited (Schmidgall and DeFranco 2016).
Profitability ratios:
Profitability ratios Santos Fortescue
Particulars 2017 2016 2017 2016
Net profit margin -11.59% -40.36% 24.78% 13.91%
Return on assets -2.49% -6.71% 10.89% 4.84%
Gross profit margin 26.87% 17.00% 42.13% 28.50%
Asset turnover 21.45% 16.62% 43.94% 34.81%
Table 4: Profitability ratios of Santos and Fortescue for 2017 to 2016
(Source: As created by the author)
2017 2016 2017 2016
Santos Fortescue
-50.00%
-40.00%
-30.00%
-20.00%
-10.00%
0.00%
10.00%
20.00%
30.00%
40.00%
50.00%
Figure 4: Profitability ratios of Santos and Fortescue for 2017 to 2016
Paraphrase This Document
Need a fresh take? Get an instant paraphrase of this document with our AI Paraphraser
BUSINESS FINANCE
10
(Source: As created by the author)
The profitability ratio of Santos Limited’s and Fortescue Metals Group from 2016 to
2017 is mainly detected in the above table and graph, which would eventually help in
understanding their financial position who the period. from the overall evaluation it could be
identified that net profit margin of centos Limited as a relatively improved from the levels of
-40.36% in 2015 to -11.59% in 2017, which was conducted due to the low loss incurred by
the company during the fiscal year. On the same instance, incremental net profit margin of
Fortescue Metals Group can be seen from the levels of 13.91% in 2016 to 24.78% in 2017.
This was only possible due to the high revenues and low cost incurred by the company. The
evaluation of profitability ratios would eventually help in understanding the level of profits
that could be obtained by an organisation over the period. In addition, it also helps in
detecting the overall financial condition and position of the company to obtain sustainable
growth (Christian 2015).
The evaluation of gross profit margin relatively indicates the positive attributes for
both the companies as gross profit has a relatively increased from 2016 to 2017. However,
the increment in gross profit for Santos Limited is not adequate in comparison to Fortescue
Metals Group, which indicate that the company's overall financial progress has improved
overtime. Furthermore, the difference between the gross profit margin and net profit margin
relatively helps in identifying the administrative expenses incurred by the company over the
fiscal year. The evaluation directly indicates that the administrative cost of Santos Limited is
relatively higher in comparison to its competitive Fortescue Metals Group. This relatively
indicates that the financial position of Fortescue Metals Group is relatively high in
comparison to Santos Limited as per the net profit margin ratio (Stockinger and Leitner-
Hanetseder 2014).
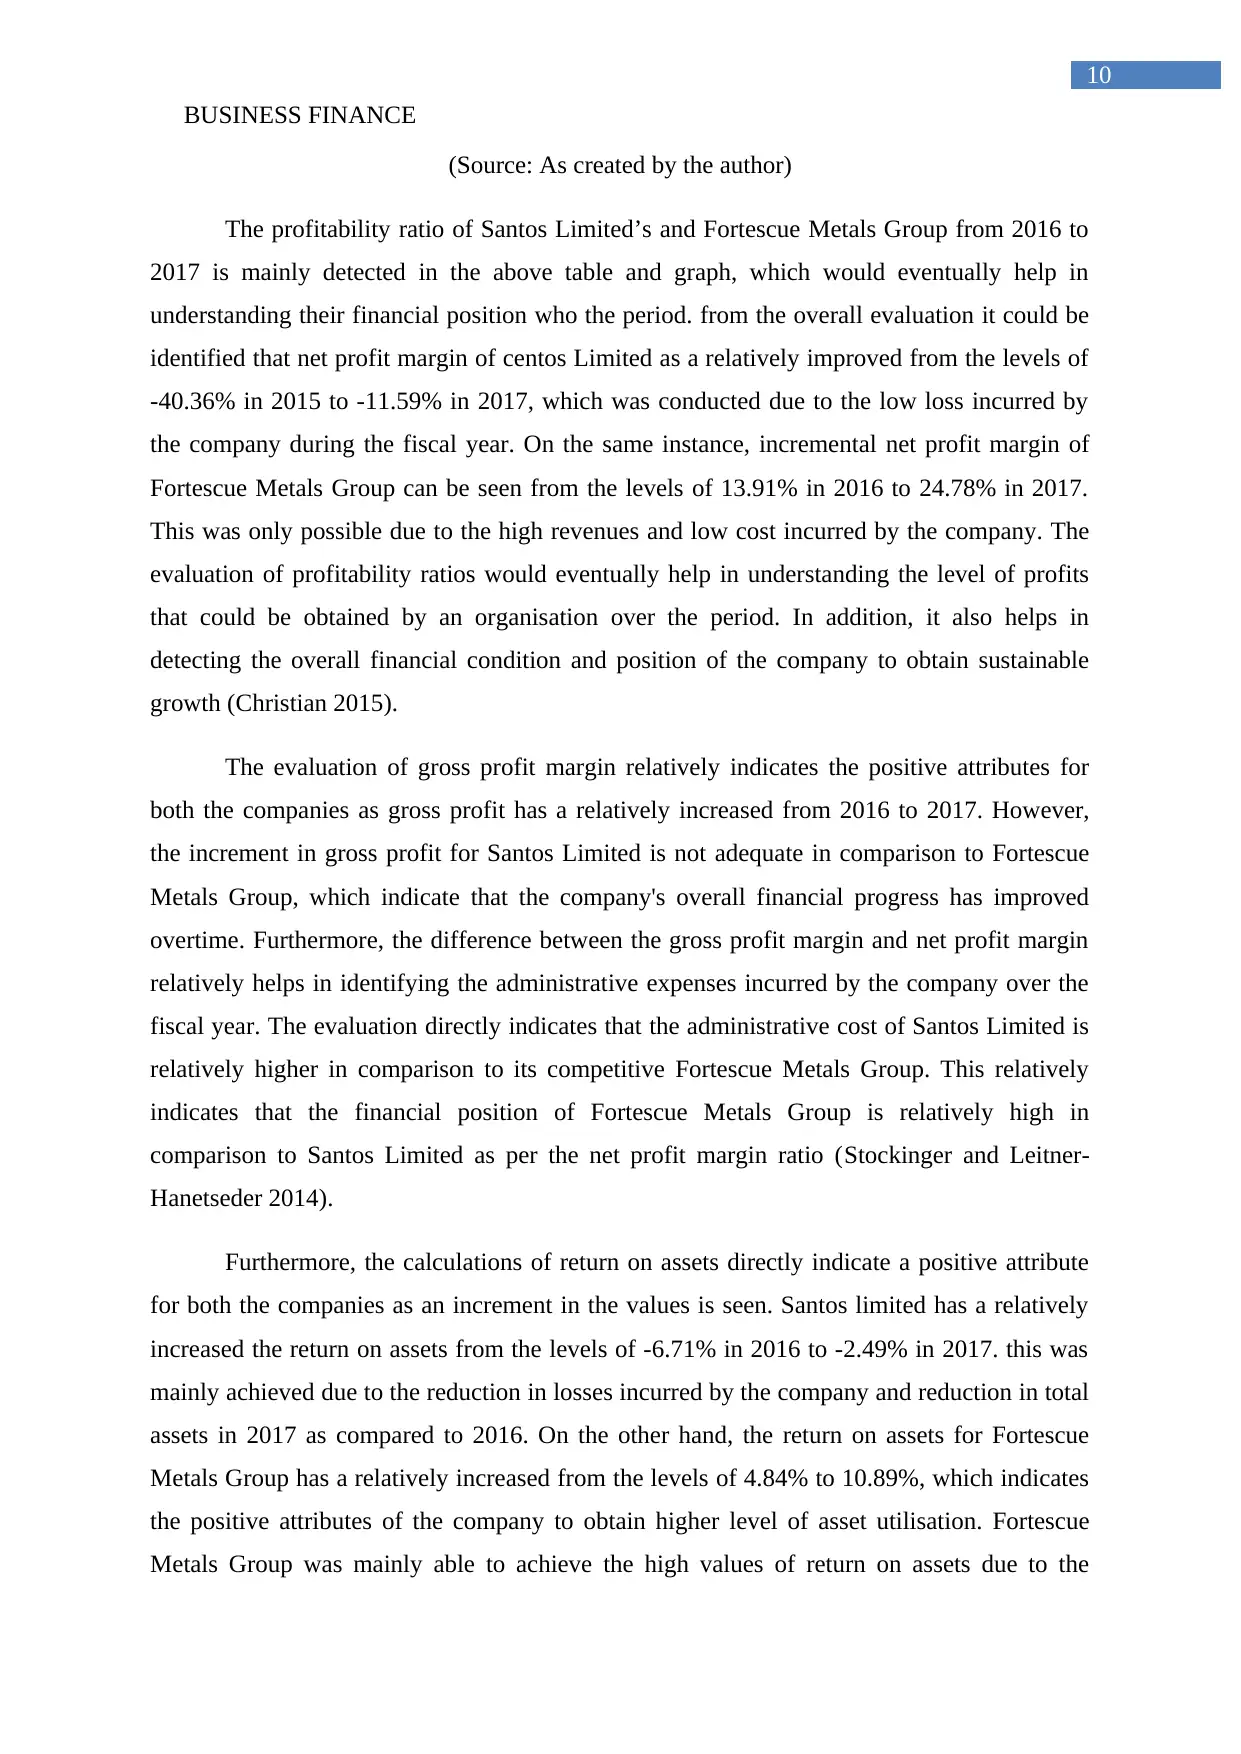
Furthermore, the calculations of return on assets directly indicate a positive attribute
for both the companies as an increment in the values is seen. Santos limited has a relatively
increased the return on assets from the levels of -6.71% in 2016 to -2.49% in 2017. this was
mainly achieved due to the reduction in losses incurred by the company and reduction in total
assets in 2017 as compared to 2016. On the other hand, the return on assets for Fortescue
Metals Group has a relatively increased from the levels of 4.84% to 10.89%, which indicates
the positive attributes of the company to obtain higher level of asset utilisation. Fortescue
Metals Group was mainly able to achieve the high values of return on assets due to the
10
(Source: As created by the author)
The profitability ratio of Santos Limited’s and Fortescue Metals Group from 2016 to
2017 is mainly detected in the above table and graph, which would eventually help in
understanding their financial position who the period. from the overall evaluation it could be
identified that net profit margin of centos Limited as a relatively improved from the levels of
-40.36% in 2015 to -11.59% in 2017, which was conducted due to the low loss incurred by
the company during the fiscal year. On the same instance, incremental net profit margin of
Fortescue Metals Group can be seen from the levels of 13.91% in 2016 to 24.78% in 2017.
This was only possible due to the high revenues and low cost incurred by the company. The
evaluation of profitability ratios would eventually help in understanding the level of profits
that could be obtained by an organisation over the period. In addition, it also helps in
detecting the overall financial condition and position of the company to obtain sustainable
growth (Christian 2015).
The evaluation of gross profit margin relatively indicates the positive attributes for
both the companies as gross profit has a relatively increased from 2016 to 2017. However,
the increment in gross profit for Santos Limited is not adequate in comparison to Fortescue
Metals Group, which indicate that the company's overall financial progress has improved
overtime. Furthermore, the difference between the gross profit margin and net profit margin
relatively helps in identifying the administrative expenses incurred by the company over the
fiscal year. The evaluation directly indicates that the administrative cost of Santos Limited is
relatively higher in comparison to its competitive Fortescue Metals Group. This relatively
indicates that the financial position of Fortescue Metals Group is relatively high in
comparison to Santos Limited as per the net profit margin ratio (Stockinger and Leitner-
Hanetseder 2014).
Furthermore, the calculations of return on assets directly indicate a positive attribute
for both the companies as an increment in the values is seen. Santos limited has a relatively
increased the return on assets from the levels of -6.71% in 2016 to -2.49% in 2017. this was
mainly achieved due to the reduction in losses incurred by the company and reduction in total
assets in 2017 as compared to 2016. On the other hand, the return on assets for Fortescue
Metals Group has a relatively increased from the levels of 4.84% to 10.89%, which indicates
the positive attributes of the company to obtain higher level of asset utilisation. Fortescue
Metals Group was mainly able to achieve the high values of return on assets due to the
BUSINESS FINANCE
11
incremental net profitability and reduction in accumulation of total assets (Arrozio, Gonzales
and Silva 2016).
Lastly, the overall asset turnover ratio of both the companies has a relatively
improved over the period, which was due to the find sales obtained by both the organisation.
Santos Limited overall asset turnover ratio increased from the levels of 16.62% to 21.45% in
2017, which directly indicates the overall efficiency of the company in utilising its available
resources. The asset turnover ratio Fortescue Metals Group May be increased from the levels
of 34.81% to 43.94% in 2017 indicating a positive attribute for the organisation. This
relatively indicates the financial attributes of both the companies, which has help them to
achieve sustainable growth over time. However, from the evaluation it could be identified
that Fortescue Metals Group is considered financially stable Organisation in comparison to
Santos Limited (Erdogan, Erdogan and Omurbek 2015).
Market Value ratios:
Market Value ratios Santos Fortescue
Particulars 2017 2016 2017 2016
Price/Earnings ratio -2323.70% -632.30% 775.63% 1107.59%
Earnings yield -4.30% -15.82% 12.89% 9.03%
Dividend yield 0.00% 0.00% 8.62% 4.29%
Table 5: Market Value ratios of Santos and Fortescue for 2017 to 2016
(Source: As created by the author)
2017 2016 2017 2016
Santos Fortescue
-2500.00%
-2000.00%
-1500.00%
-1000.00%
-500.00%
0.00%
500.00%
1000.00%
1500.00%
⊘ This is a preview!⊘
Do you want full access?
Subscribe today to unlock all pages.
Trusted by 1+ million students worldwide
1 out of 17
Related Documents


Your All-in-One AI-Powered Toolkit for Academic Success.
+13062052269
info@desklib.com
Available 24*7 on WhatsApp / Email
![[object Object]](/_next/static/media/star-bottom.7253800d.svg)
Unlock your academic potential
Copyright © 2020–2026 A2Z Services. All Rights Reserved. Developed and managed by ZUCOL.