Financial Statement Analysis Report: Saracen Mineral Holdings Limited
VerifiedAdded on 2022/10/11
|12
|5037
|26
Report
AI Summary
This report provides a comprehensive financial analysis of Saracen Mineral Holdings Limited (SAR), a gold mining company. It begins with an industry overview and a company profile, detailing Saracen's operations, including the Carosue Dam Operations and Thunderbox operations. The report then presents and analyzes the company's financial statements, including the income statement, balance sheet, and cash flow statement, spanning five years. Business analysis covers revenue, costs, and capital expenditures, while the financial risk section explores market, commodity, and credit risks. Ratio analysis and financial performance are examined, including liquidity and profitability ratios. The report discusses Saracen's financial position, growth, and return on equity, and offers recommendations based on its analysis of the financial data, ultimately aiming to provide an investment recommendation (Buy or Not). The report utilizes financial data from the company's annual reports and other public sources, evaluating the company's performance, and assessing its strengths and weaknesses.
ASSIGNMENT
Paraphrase This Document
Need a fresh take? Get an instant paraphrase of this document with our AI Paraphraser
Table of Contents
Industry Overview........................................................................................................................................................................................3
Company Overview......................................................................................................................................................................................3
Financial Statements and Analysis...........................................................................................................................................................4
BUSINESS ANALYSIS AND RECOMMENDATIONS.........................................................................................................................................6
FINANCIAL RISK........................................................................................................................................................................................7
Ratio analysis...............................................................................................................................................................................................8
Financial Analysis.........................................................................................................................................................................................9
Analysis of Income Statement...................................................................................................................................................................11
Valuation....................................................................................................................................................................................................12
Assumptions.......................................................................................................................................................................................12
Conclusion..................................................................................................................................................................................................13
References.................................................................................................................................................................................................13
2
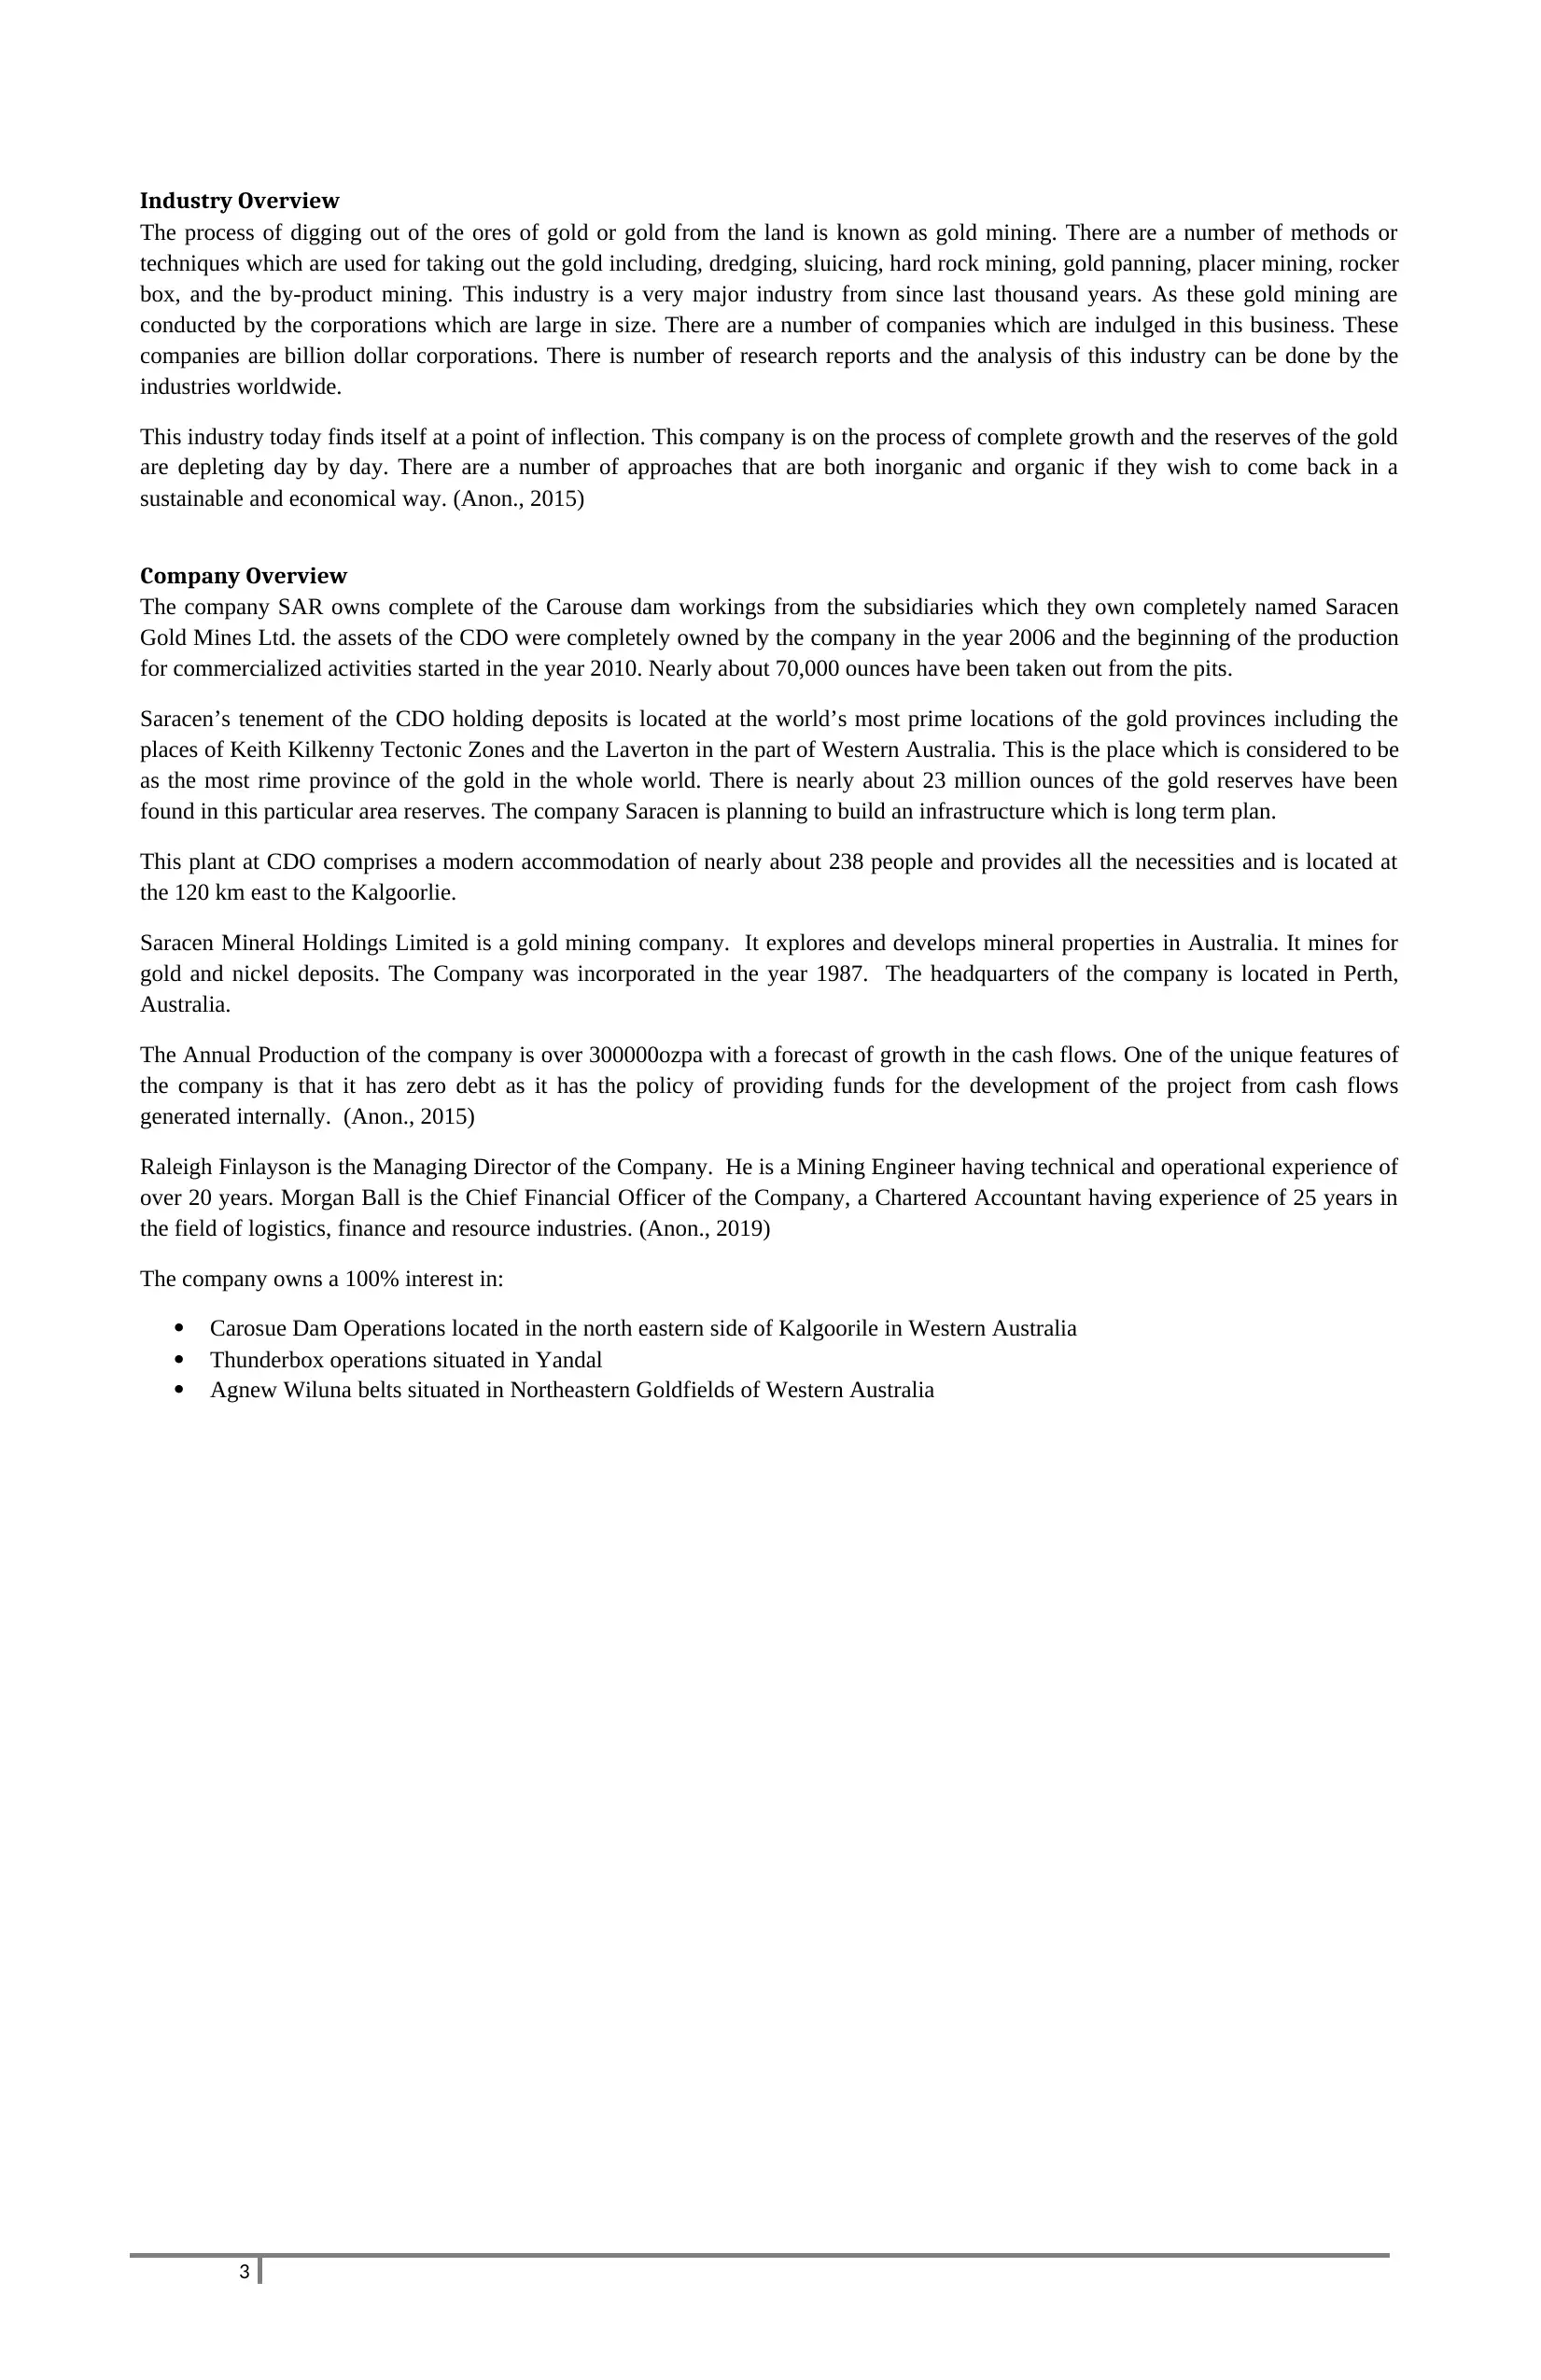
Industry Overview
The process of digging out of the ores of gold or gold from the land is known as gold mining. There are a number of methods or
techniques which are used for taking out the gold including, dredging, sluicing, hard rock mining, gold panning, placer mining, rocker
box, and the by-product mining. This industry is a very major industry from since last thousand years. As these gold mining are
conducted by the corporations which are large in size. There are a number of companies which are indulged in this business. These
companies are billion dollar corporations. There is number of research reports and the analysis of this industry can be done by the
industries worldwide.
This industry today finds itself at a point of inflection. This company is on the process of complete growth and the reserves of the gold
are depleting day by day. There are a number of approaches that are both inorganic and organic if they wish to come back in a
sustainable and economical way. (Anon., 2015)
Company Overview
The company SAR owns complete of the Carouse dam workings from the subsidiaries which they own completely named Saracen
Gold Mines Ltd. the assets of the CDO were completely owned by the company in the year 2006 and the beginning of the production
for commercialized activities started in the year 2010. Nearly about 70,000 ounces have been taken out from the pits.
Saracen’s tenement of the CDO holding deposits is located at the world’s most prime locations of the gold provinces including the
places of Keith Kilkenny Tectonic Zones and the Laverton in the part of Western Australia. This is the place which is considered to be
as the most rime province of the gold in the whole world. There is nearly about 23 million ounces of the gold reserves have been
found in this particular area reserves. The company Saracen is planning to build an infrastructure which is long term plan.
This plant at CDO comprises a modern accommodation of nearly about 238 people and provides all the necessities and is located at
the 120 km east to the Kalgoorlie.
Saracen Mineral Holdings Limited is a gold mining company. It explores and develops mineral properties in Australia. It mines for
gold and nickel deposits. The Company was incorporated in the year 1987. The headquarters of the company is located in Perth,
Australia.
The Annual Production of the company is over 300000ozpa with a forecast of growth in the cash flows. One of the unique features of
the company is that it has zero debt as it has the policy of providing funds for the development of the project from cash flows
generated internally. (Anon., 2015)
Raleigh Finlayson is the Managing Director of the Company. He is a Mining Engineer having technical and operational experience of
over 20 years. Morgan Ball is the Chief Financial Officer of the Company, a Chartered Accountant having experience of 25 years in
the field of logistics, finance and resource industries. (Anon., 2019)
The company owns a 100% interest in:
Carosue Dam Operations located in the north eastern side of Kalgoorile in Western Australia
Thunderbox operations situated in Yandal
Agnew Wiluna belts situated in Northeastern Goldfields of Western Australia
3
⊘ This is a preview!⊘
Do you want full access?
Subscribe today to unlock all pages.
Trusted by 1+ million students worldwide
Financial
Statements and
Analysis
4
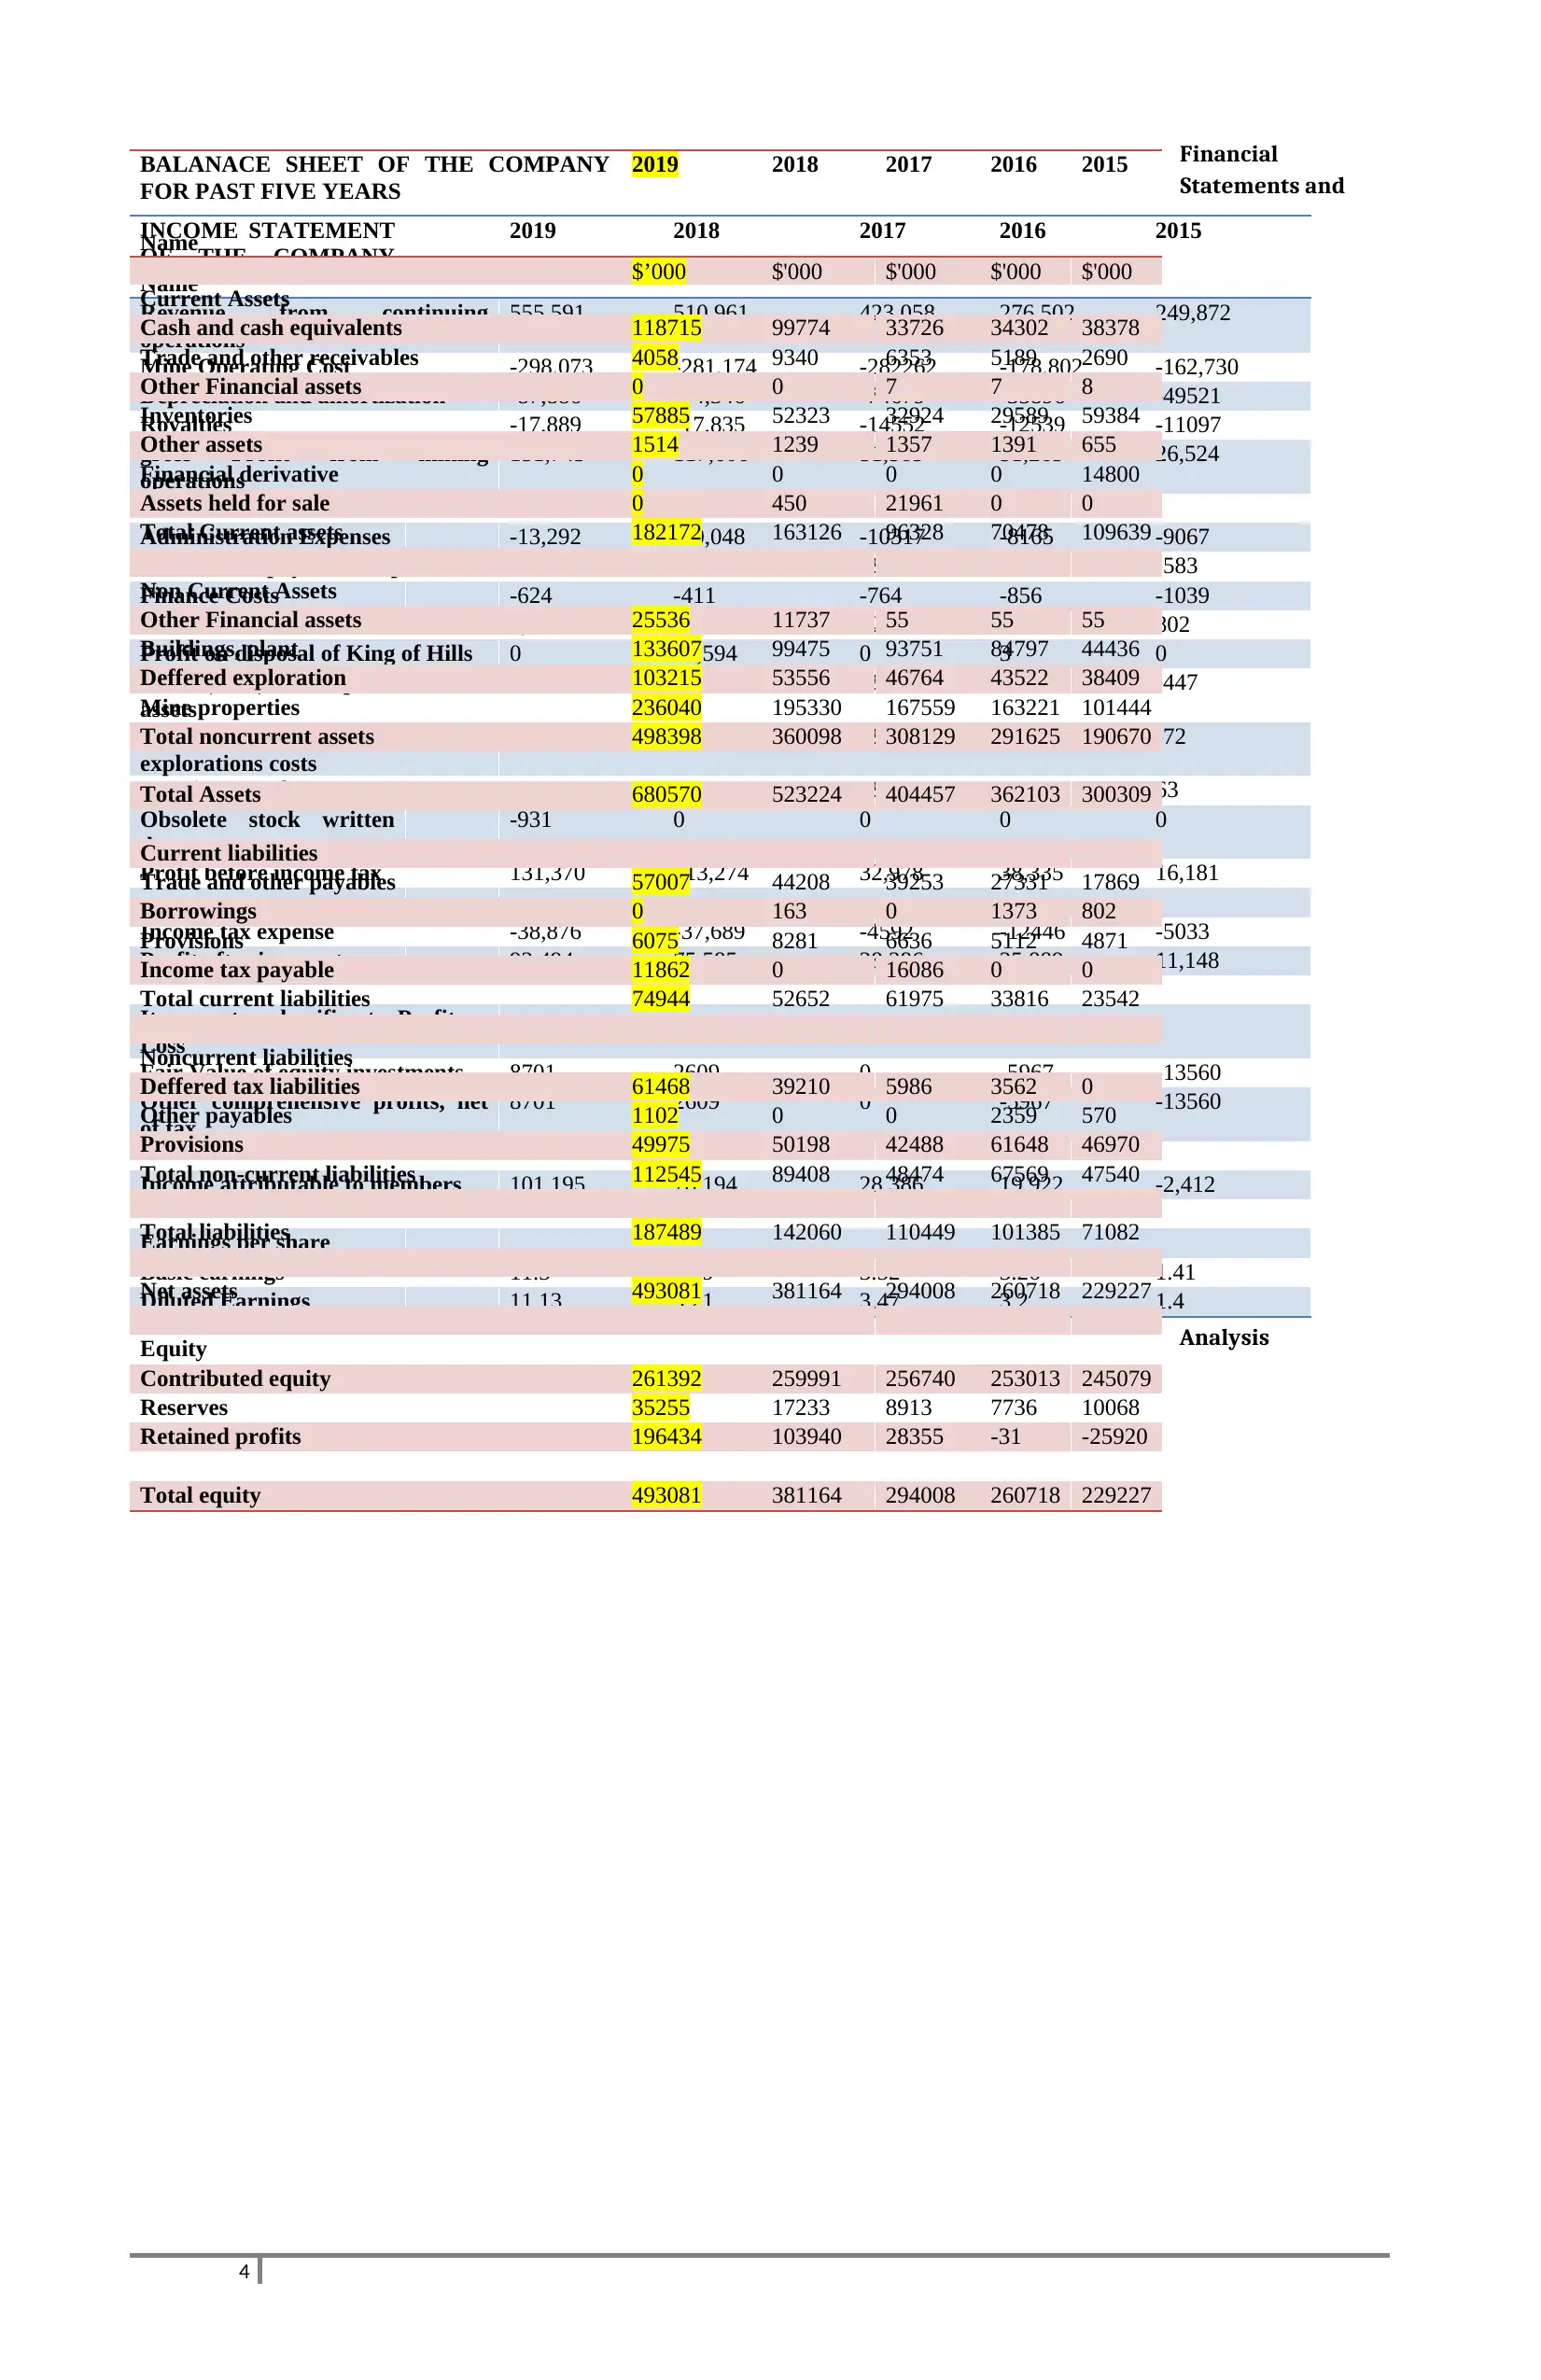
INCOME STATEMENT
OF THE COMPANY
Name
2019 2018 2017 2016 2015
Revenue from continuing
operations
555,591 510,961 423,058 276,502 249,872
Mine Operating Cost -298,073 -281,174 -282262 -178,802 -162,730
Depreciation and amortization -87,886 -94,346 -74679 -33896 -49521
Royalties -17,889 -17,835 -14552 -12539 -11097
gross Profit from mining
operations
151,743 117,606 51,565 51,265 26,524
Administration Expenses -13,292 -10,048 -10317 -8165 -9067
Share based payments expense -6,969 -3,379 -2736 -3635 -583
Finance Costs -624 -411 -764 -856 -1039
Other Revenue 2,188 1,213 522 729 802
Profit on disposal of King of Hills 0 10,594 0 3 0
Profit/(Loss) on disposal of fixed
assets
-354 0 -39 -1005 -447
Expensing of deferred
explorations costs
-391 1,405 -2477 0 -72
Impairment of assets 0 -896 -2776 -1 63
Obsolete stock written
down
-931 0 0 0 0
Profit before income tax 131,370 113,274 32,978 38,335 16,181
Income tax expense -38,876 -37,689 -4592 -12446 -5033
Profit after income tax 92,494 75,585 28,386 25,889 11,148
Items not reclassifies to Profit or
Loss
Fair Value of equity investments 8701 2609 0 -5967 -13560
Other comprehensive profits, net
of tax
8701 2609 0 -5967 -13560
Income attributable to members 101,195 78,194 28,386 19,922 -2,412
Earnings per share
Basic earnings 11.3 9.29 3.52 3.26 1.41
Diluted Earnings 11.13 9.21 3.47 3.2 1.4
BALANACE SHEET OF THE COMPANY
FOR PAST FIVE YEARS
Name
2019 2018 2017 2016 2015
$’000 $'000 $'000 $'000 $'000
Current Assets
Cash and cash equivalents 118715 99774 33726 34302 38378
Trade and other receivables 4058 9340 6353 5189 2690
Other Financial assets 0 0 7 7 8
Inventories 57885 52323 32924 29589 59384
Other assets 1514 1239 1357 1391 655
Financial derivative 0 0 0 0 14800
Assets held for sale 0 450 21961 0 0
Total Current assets 182172 163126 96328 70478 109639
Non Current Assets
Other Financial assets 25536 11737 55 55 55
Buildings, plant 133607 99475 93751 84797 44436
Deffered exploration 103215 53556 46764 43522 38409
Mine properties 236040 195330 167559 163221 101444
Total noncurrent assets 498398 360098 308129 291625 190670
Total Assets 680570 523224 404457 362103 300309
Current liabilities
Trade and other payables 57007 44208 39253 27331 17869
Borrowings 0 163 0 1373 802
Provisions 6075 8281 6636 5112 4871
Income tax payable 11862 0 16086 0 0
Total current liabilities 74944 52652 61975 33816 23542
Noncurrent liabilities
Deffered tax liabilities 61468 39210 5986 3562 0
Other payables 1102 0 0 2359 570
Provisions 49975 50198 42488 61648 46970
Total non-current liabilities 112545 89408 48474 67569 47540
Total liabilities 187489 142060 110449 101385 71082
Net assets 493081 381164 294008 260718 229227
Equity
Contributed equity 261392 259991 256740 253013 245079
Reserves 35255 17233 8913 7736 10068
Retained profits 196434 103940 28355 -31 -25920
Total equity 493081 381164 294008 260718 229227
Statements and
Analysis
4
INCOME STATEMENT
OF THE COMPANY
Name
2019 2018 2017 2016 2015
Revenue from continuing
operations
555,591 510,961 423,058 276,502 249,872
Mine Operating Cost -298,073 -281,174 -282262 -178,802 -162,730
Depreciation and amortization -87,886 -94,346 -74679 -33896 -49521
Royalties -17,889 -17,835 -14552 -12539 -11097
gross Profit from mining
operations
151,743 117,606 51,565 51,265 26,524
Administration Expenses -13,292 -10,048 -10317 -8165 -9067
Share based payments expense -6,969 -3,379 -2736 -3635 -583
Finance Costs -624 -411 -764 -856 -1039
Other Revenue 2,188 1,213 522 729 802
Profit on disposal of King of Hills 0 10,594 0 3 0
Profit/(Loss) on disposal of fixed
assets
-354 0 -39 -1005 -447
Expensing of deferred
explorations costs
-391 1,405 -2477 0 -72
Impairment of assets 0 -896 -2776 -1 63
Obsolete stock written
down
-931 0 0 0 0
Profit before income tax 131,370 113,274 32,978 38,335 16,181
Income tax expense -38,876 -37,689 -4592 -12446 -5033
Profit after income tax 92,494 75,585 28,386 25,889 11,148
Items not reclassifies to Profit or
Loss
Fair Value of equity investments 8701 2609 0 -5967 -13560
Other comprehensive profits, net
of tax
8701 2609 0 -5967 -13560
Income attributable to members 101,195 78,194 28,386 19,922 -2,412
Earnings per share
Basic earnings 11.3 9.29 3.52 3.26 1.41
Diluted Earnings 11.13 9.21 3.47 3.2 1.4
BALANACE SHEET OF THE COMPANY
FOR PAST FIVE YEARS
Name
2019 2018 2017 2016 2015
$’000 $'000 $'000 $'000 $'000
Current Assets
Cash and cash equivalents 118715 99774 33726 34302 38378
Trade and other receivables 4058 9340 6353 5189 2690
Other Financial assets 0 0 7 7 8
Inventories 57885 52323 32924 29589 59384
Other assets 1514 1239 1357 1391 655
Financial derivative 0 0 0 0 14800
Assets held for sale 0 450 21961 0 0
Total Current assets 182172 163126 96328 70478 109639
Non Current Assets
Other Financial assets 25536 11737 55 55 55
Buildings, plant 133607 99475 93751 84797 44436
Deffered exploration 103215 53556 46764 43522 38409
Mine properties 236040 195330 167559 163221 101444
Total noncurrent assets 498398 360098 308129 291625 190670
Total Assets 680570 523224 404457 362103 300309
Current liabilities
Trade and other payables 57007 44208 39253 27331 17869
Borrowings 0 163 0 1373 802
Provisions 6075 8281 6636 5112 4871
Income tax payable 11862 0 16086 0 0
Total current liabilities 74944 52652 61975 33816 23542
Noncurrent liabilities
Deffered tax liabilities 61468 39210 5986 3562 0
Other payables 1102 0 0 2359 570
Provisions 49975 50198 42488 61648 46970
Total non-current liabilities 112545 89408 48474 67569 47540
Total liabilities 187489 142060 110449 101385 71082
Net assets 493081 381164 294008 260718 229227
Equity
Contributed equity 261392 259991 256740 253013 245079
Reserves 35255 17233 8913 7736 10068
Retained profits 196434 103940 28355 -31 -25920
Total equity 493081 381164 294008 260718 229227
Paraphrase This Document
Need a fresh take? Get an instant paraphrase of this document with our AI Paraphraser
CASH FLOW STATEMENT OF FIVE
YEARS
TTM 2018 2017 2016 2015 2014
Name
Cash Flows from/Used in Operating
Activities, Direct
208,786,000 191,425,000 125,632,000 109,804,000 65,403,000 49,357,000
Net Cash Flow from Continuing Operating
Activities, Direct
208,786,000 191,425,000 125,632,000 109,804,000 65,403,000 49,357,000
Cash Receipts from Operating Activities,
Direct
548,908,000 511,950,000 423,389,000 277,106,000 250,615,000 212,111,000
Receipts from Customers, Direct 547,242,000 510,961,000 423,058,000 276,502,000 249,872,000 211,424,000
Interest Received, Direct 1,666,000 989,000 331,000 604,000 743,000 687,000
Cash Payments from Operating
Activities, Direct
-
340,122,000
-
320,525,000
-
297,757,000
-
167,302,000
-
185,212,000
-
162,754,000
Payments to Suppliers for Goods and
Services, Direct
-
339,749,000
-
320,129,000
-
297,154,000
-
166,709,000
-
184,316,000
-
160,447,000
Interest Paid, Direct -373,000 -396,000 -603,000 -593,000 -896,000 -2,307,000
Other Cash Payments from Operating
Activities, Direct
Cash Flow from Investing Activities -
159,733,000
-
125,540,000
-
117,851,000
-
111,917,000
-49,244,000 -69,576,000
Cash Flow from Continuing Investing
Activities
-
159,733,000
-
125,540,000
-
117,851,000
-
111,917,000
-49,244,000 -69,576,000
Exploration and Mine Development
Costs
-19,162,000 -8,580,000 -12,842,000 -7,326,000 -11,116,000 -6,042,000
Purchase/Sale and Disposal of Property,
Plant and Equipment, Net
-
141,036,000
-
116,647,000
-
105,009,000
-
104,591,000
-35,933,000 -70,847,000
Purchase of Property, Plant and
Equipment
-
200,436,000
-
121,617,000
-
105,009,000
-
104,591,000
-35,933,000 -70,887,000
Sale of Mineral
Properties/Rights/Interests
3,438,000 4,970,000
Sale and Disposal of Property, Plant
and Equipment
40,000
Purchase of Mineral
Properties/Rights/Interests
Purchas 465,000 -313,000 10,000
e/Sale of Investments, Net
Purchase of Investments 459,000 -319,000
Sale of Investments 6,000 10,000
Purchase/Sale of Intangibles, Net 55,000 7,313,000
Sale of Intangibles 55,000 7,313,000
Purchase of Intangibles
Other Investing Cash Flow -2,260,000
Purchase/Sale of Other Non-Current
Assets, Net
Purchase of Other Non-Current
Assets
Cash Flow from Financing Activities -1,124,000 163,000 -8,357,000 -1,963,000 -13,640,000 47,054,000
Cash Flow from Continuing Financing
Activities
-1,124,000 163,000 -8,357,000 -1,963,000 -13,640,000 47,054,000
Issuance of/Repayments for Lease
Financing
-1,124,000 163,000 -7,648,000 -1,396,000 -1,659,000 -1,243,000
Other Financing Cash Flow -709,000 -567,000 -31,000
5
Issuance of/Repayments for Debt, Net -11,950,000 -10,000,000
Issuance of/Repayments for Long
Term Debt, Net
-11,950,000 -10,000,000
Repayments for Long Term Debt -11,950,000 -10,000,000
Proceeds from Issuance of Long
Term Debt
Issuance of/Payments for Common
Stock, Net
61,232,000
Proceeds from Issuance of Common
Stock
61,232,000
Issue and Financing Costs -2,935,000
Share Issuance Costs -2,935,000
Cash and Cash Equivalents, End of Period 113,221,000 99,774,000 33,726,000 34,302,000 38,378,000 35,859,000
Change in Cash 47,929,000 66,048,000 -576,000 -4,076,000 2,519,000 26,835,000
Cash and Cash Equivalents, Beginning of
Period
65,292,000 33,726,000 34,302,000 38,378,000 35,859,000 9,024,000
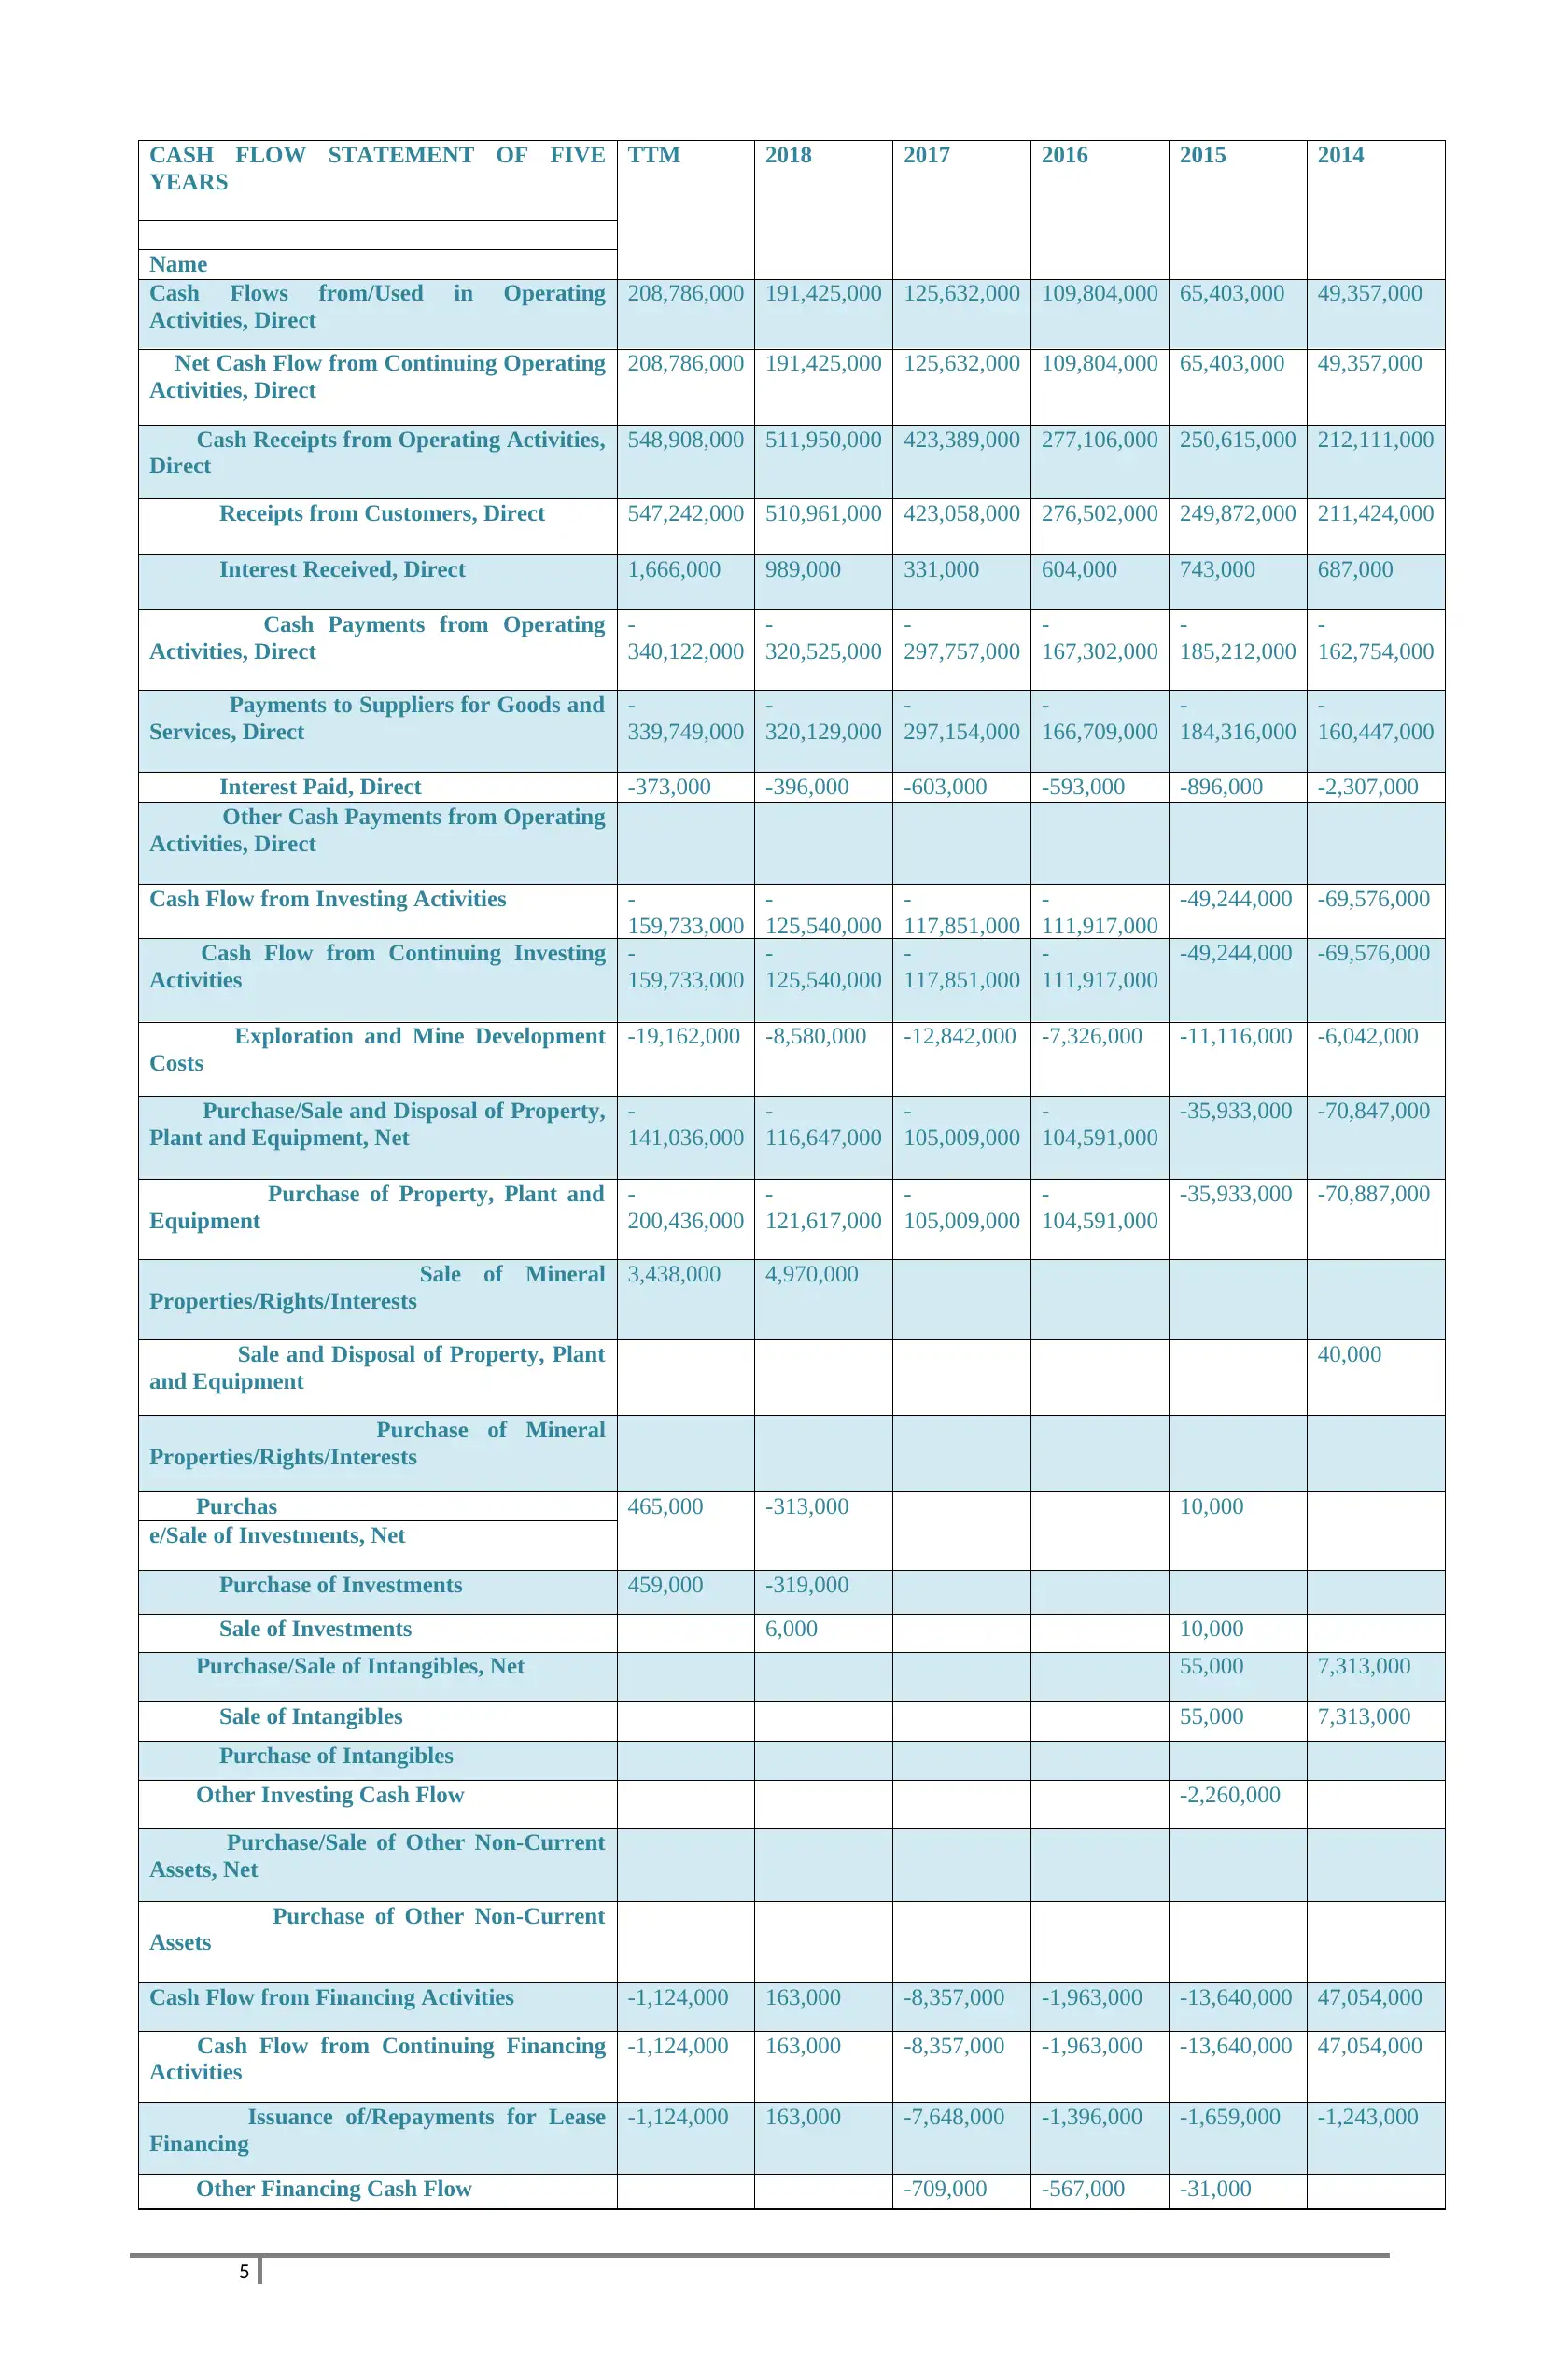
The above given are the Financial Statements of the company Saracen Mineral Holdings Ltd. These are the financials of last five years
of this company. In the next section of the report, a comparative study of the company on the basis of its financials is done.
BUSINESS ANALYSIS AND RECOMMENDATIONS
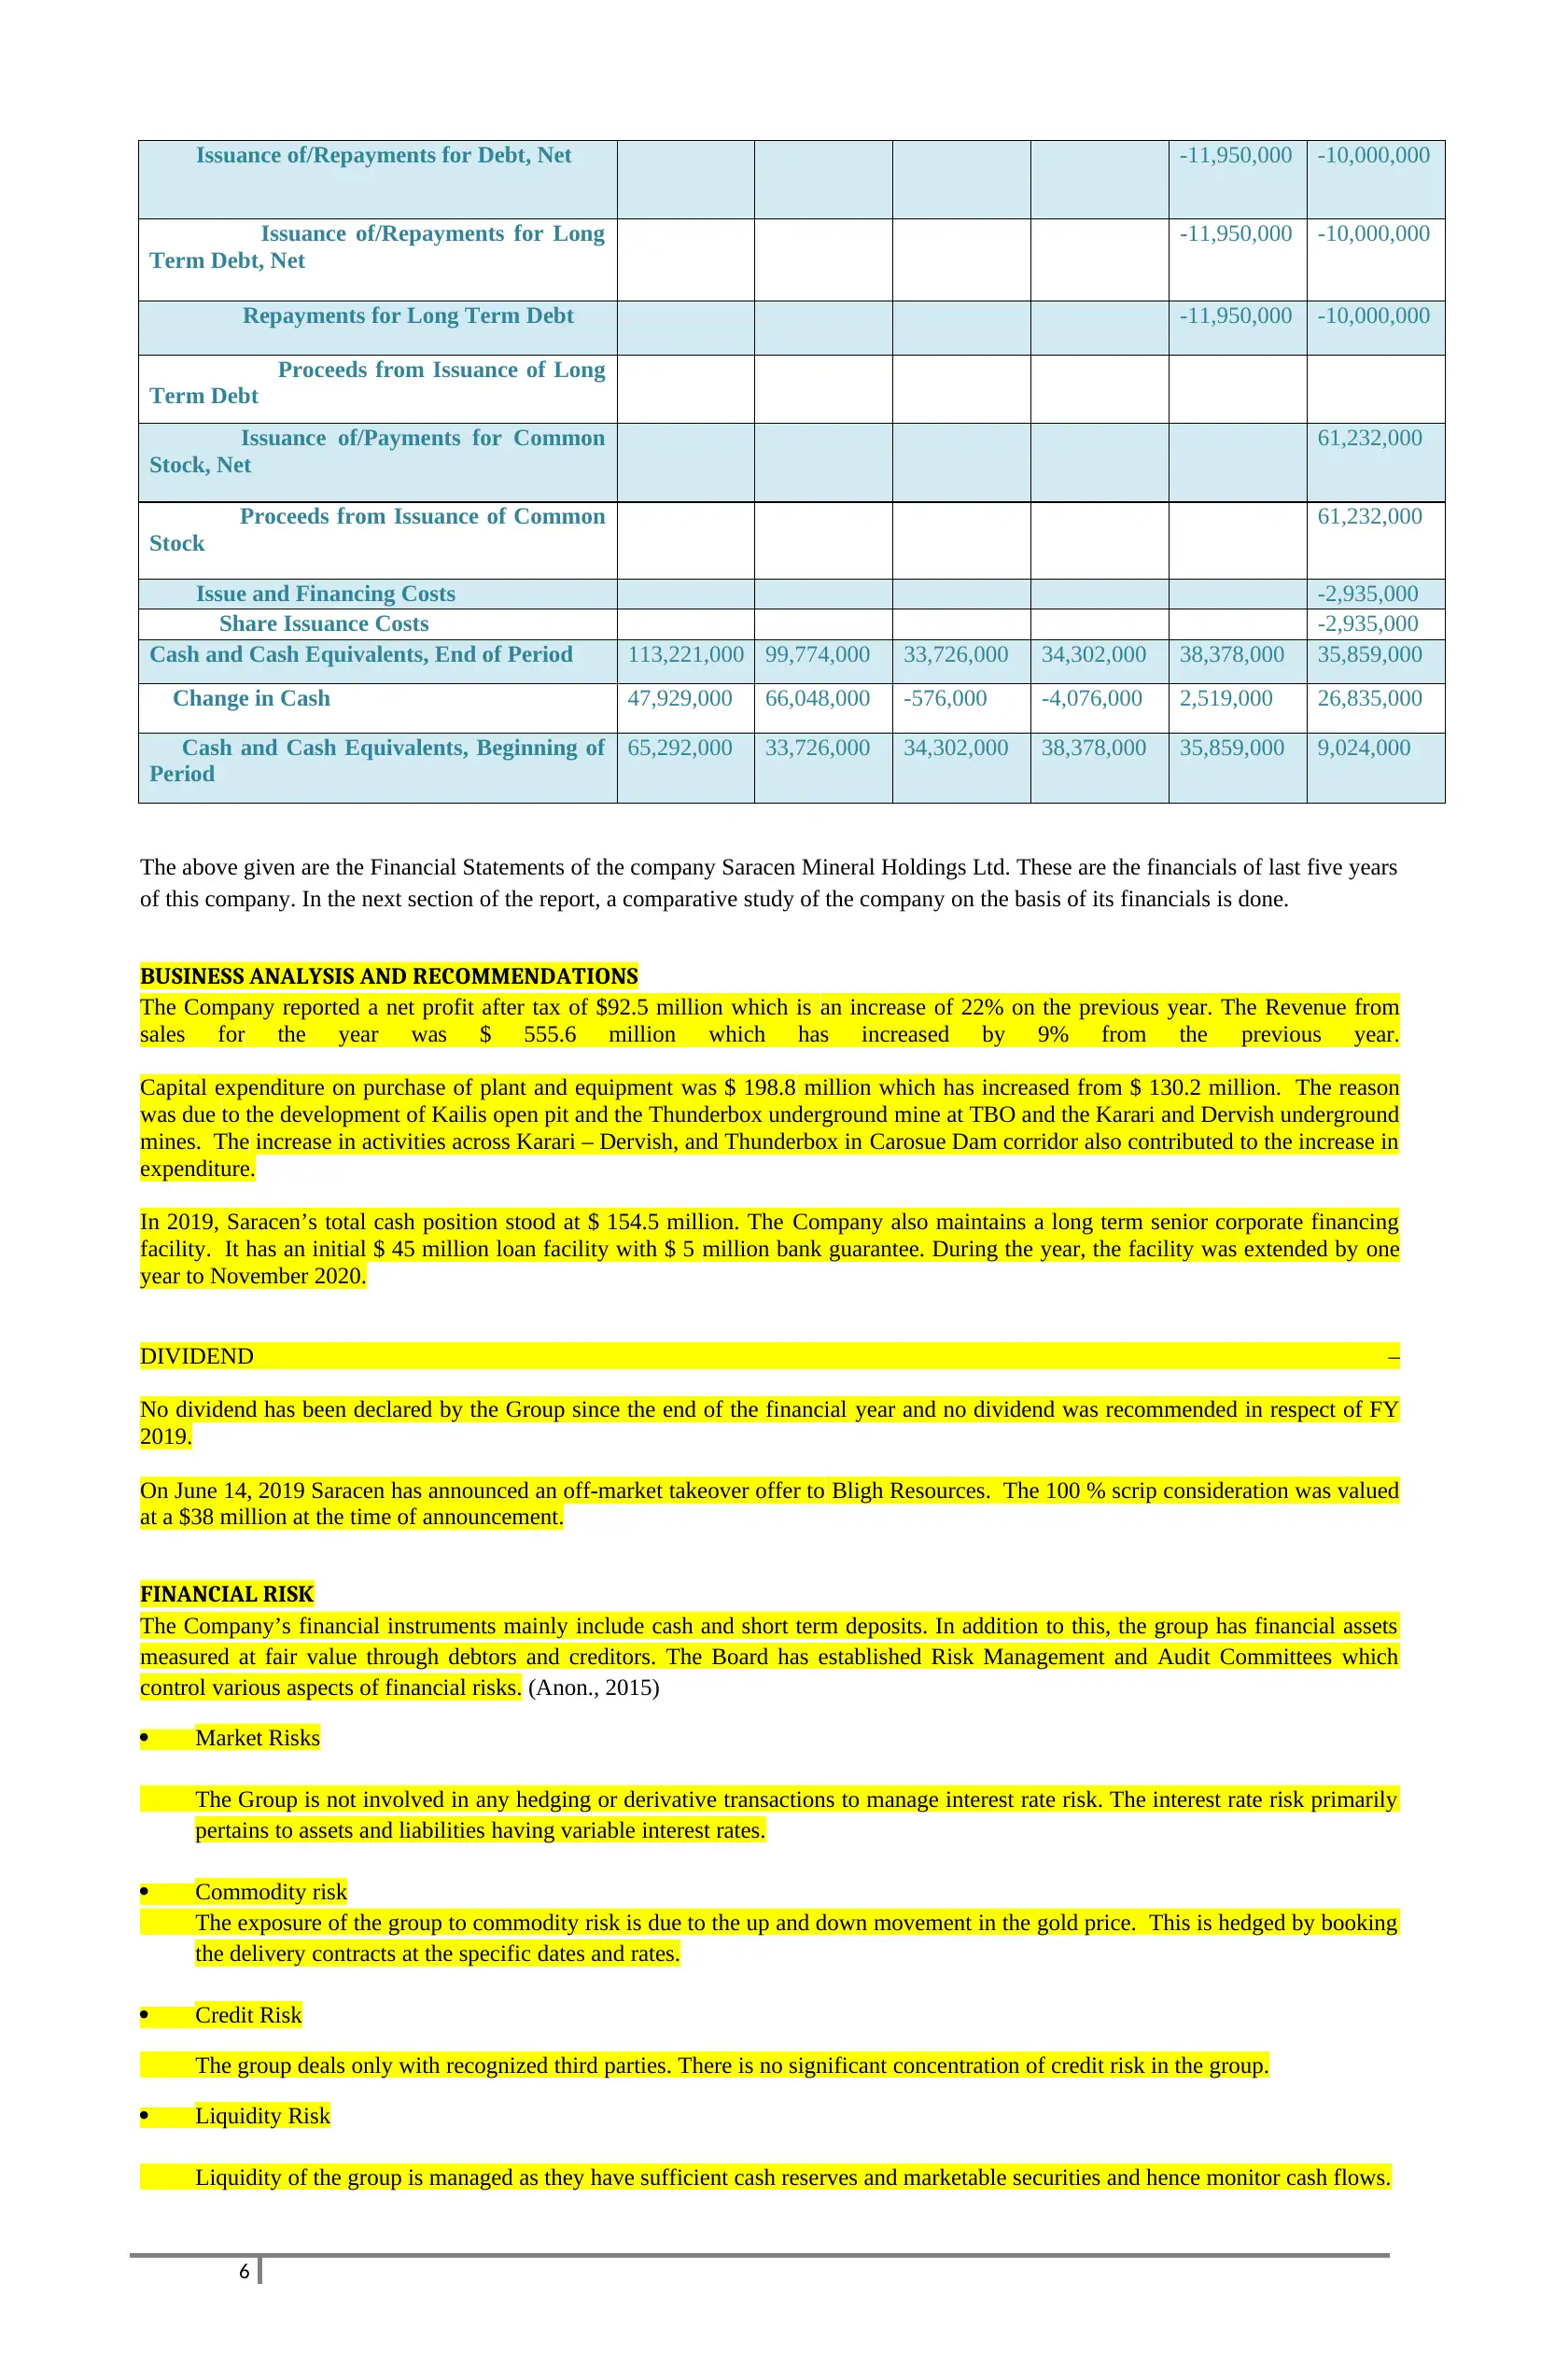
The Company reported a net profit after tax of $92.5 million which is an increase of 22% on the previous year. The Revenue from
sales for the year was $ 555.6 million which has increased by 9% from the previous year.
Capital expenditure on purchase of plant and equipment was $ 198.8 million which has increased from $ 130.2 million. The reason
was due to the development of Kailis open pit and the Thunderbox underground mine at TBO and the Karari and Dervish underground
mines. The increase in activities across Karari – Dervish, and Thunderbox in Carosue Dam corridor also contributed to the increase in
expenditure.
In 2019, Saracen’s total cash position stood at $ 154.5 million. The Company also maintains a long term senior corporate financing
facility. It has an initial $ 45 million loan facility with $ 5 million bank guarantee. During the year, the facility was extended by one
year to November 2020.
DIVIDEND –
No dividend has been declared by the Group since the end of the financial year and no dividend was recommended in respect of FY
2019.
On June 14, 2019 Saracen has announced an off-market takeover offer to Bligh Resources. The 100 % scrip consideration was valued
at a $38 million at the time of announcement.
FINANCIAL RISK
The Company’s financial instruments mainly include cash and short term deposits. In addition to this, the group has financial assets
measured at fair value through debtors and creditors. The Board has established Risk Management and Audit Committees which
control various aspects of financial risks. (Anon., 2015)
Market Risks
The Group is not involved in any hedging or derivative transactions to manage interest rate risk. The interest rate risk primarily
pertains to assets and liabilities having variable interest rates.
Commodity risk
The exposure of the group to commodity risk is due to the up and down movement in the gold price. This is hedged by booking
the delivery contracts at the specific dates and rates.
Credit Risk
The group deals only with recognized third parties. There is no significant concentration of credit risk in the group.
Liquidity Risk
Liquidity of the group is managed as they have sufficient cash reserves and marketable securities and hence monitor cash flows.
6
Issuance of/Repayments for Long
Term Debt, Net
-11,950,000 -10,000,000
Repayments for Long Term Debt -11,950,000 -10,000,000
Proceeds from Issuance of Long
Term Debt
Issuance of/Payments for Common
Stock, Net
61,232,000
Proceeds from Issuance of Common
Stock
61,232,000
Issue and Financing Costs -2,935,000
Share Issuance Costs -2,935,000
Cash and Cash Equivalents, End of Period 113,221,000 99,774,000 33,726,000 34,302,000 38,378,000 35,859,000
Change in Cash 47,929,000 66,048,000 -576,000 -4,076,000 2,519,000 26,835,000
Cash and Cash Equivalents, Beginning of
Period
65,292,000 33,726,000 34,302,000 38,378,000 35,859,000 9,024,000
The above given are the Financial Statements of the company Saracen Mineral Holdings Ltd. These are the financials of last five years
of this company. In the next section of the report, a comparative study of the company on the basis of its financials is done.
BUSINESS ANALYSIS AND RECOMMENDATIONS
The Company reported a net profit after tax of $92.5 million which is an increase of 22% on the previous year. The Revenue from
sales for the year was $ 555.6 million which has increased by 9% from the previous year.
Capital expenditure on purchase of plant and equipment was $ 198.8 million which has increased from $ 130.2 million. The reason
was due to the development of Kailis open pit and the Thunderbox underground mine at TBO and the Karari and Dervish underground
mines. The increase in activities across Karari – Dervish, and Thunderbox in Carosue Dam corridor also contributed to the increase in
expenditure.
In 2019, Saracen’s total cash position stood at $ 154.5 million. The Company also maintains a long term senior corporate financing
facility. It has an initial $ 45 million loan facility with $ 5 million bank guarantee. During the year, the facility was extended by one
year to November 2020.
DIVIDEND –
No dividend has been declared by the Group since the end of the financial year and no dividend was recommended in respect of FY
2019.
On June 14, 2019 Saracen has announced an off-market takeover offer to Bligh Resources. The 100 % scrip consideration was valued
at a $38 million at the time of announcement.
FINANCIAL RISK
The Company’s financial instruments mainly include cash and short term deposits. In addition to this, the group has financial assets
measured at fair value through debtors and creditors. The Board has established Risk Management and Audit Committees which
control various aspects of financial risks. (Anon., 2015)
Market Risks
The Group is not involved in any hedging or derivative transactions to manage interest rate risk. The interest rate risk primarily
pertains to assets and liabilities having variable interest rates.
Commodity risk
The exposure of the group to commodity risk is due to the up and down movement in the gold price. This is hedged by booking
the delivery contracts at the specific dates and rates.
Credit Risk
The group deals only with recognized third parties. There is no significant concentration of credit risk in the group.
Liquidity Risk
Liquidity of the group is managed as they have sufficient cash reserves and marketable securities and hence monitor cash flows.
6
⊘ This is a preview!⊘
Do you want full access?
Subscribe today to unlock all pages.
Trusted by 1+ million students worldwide
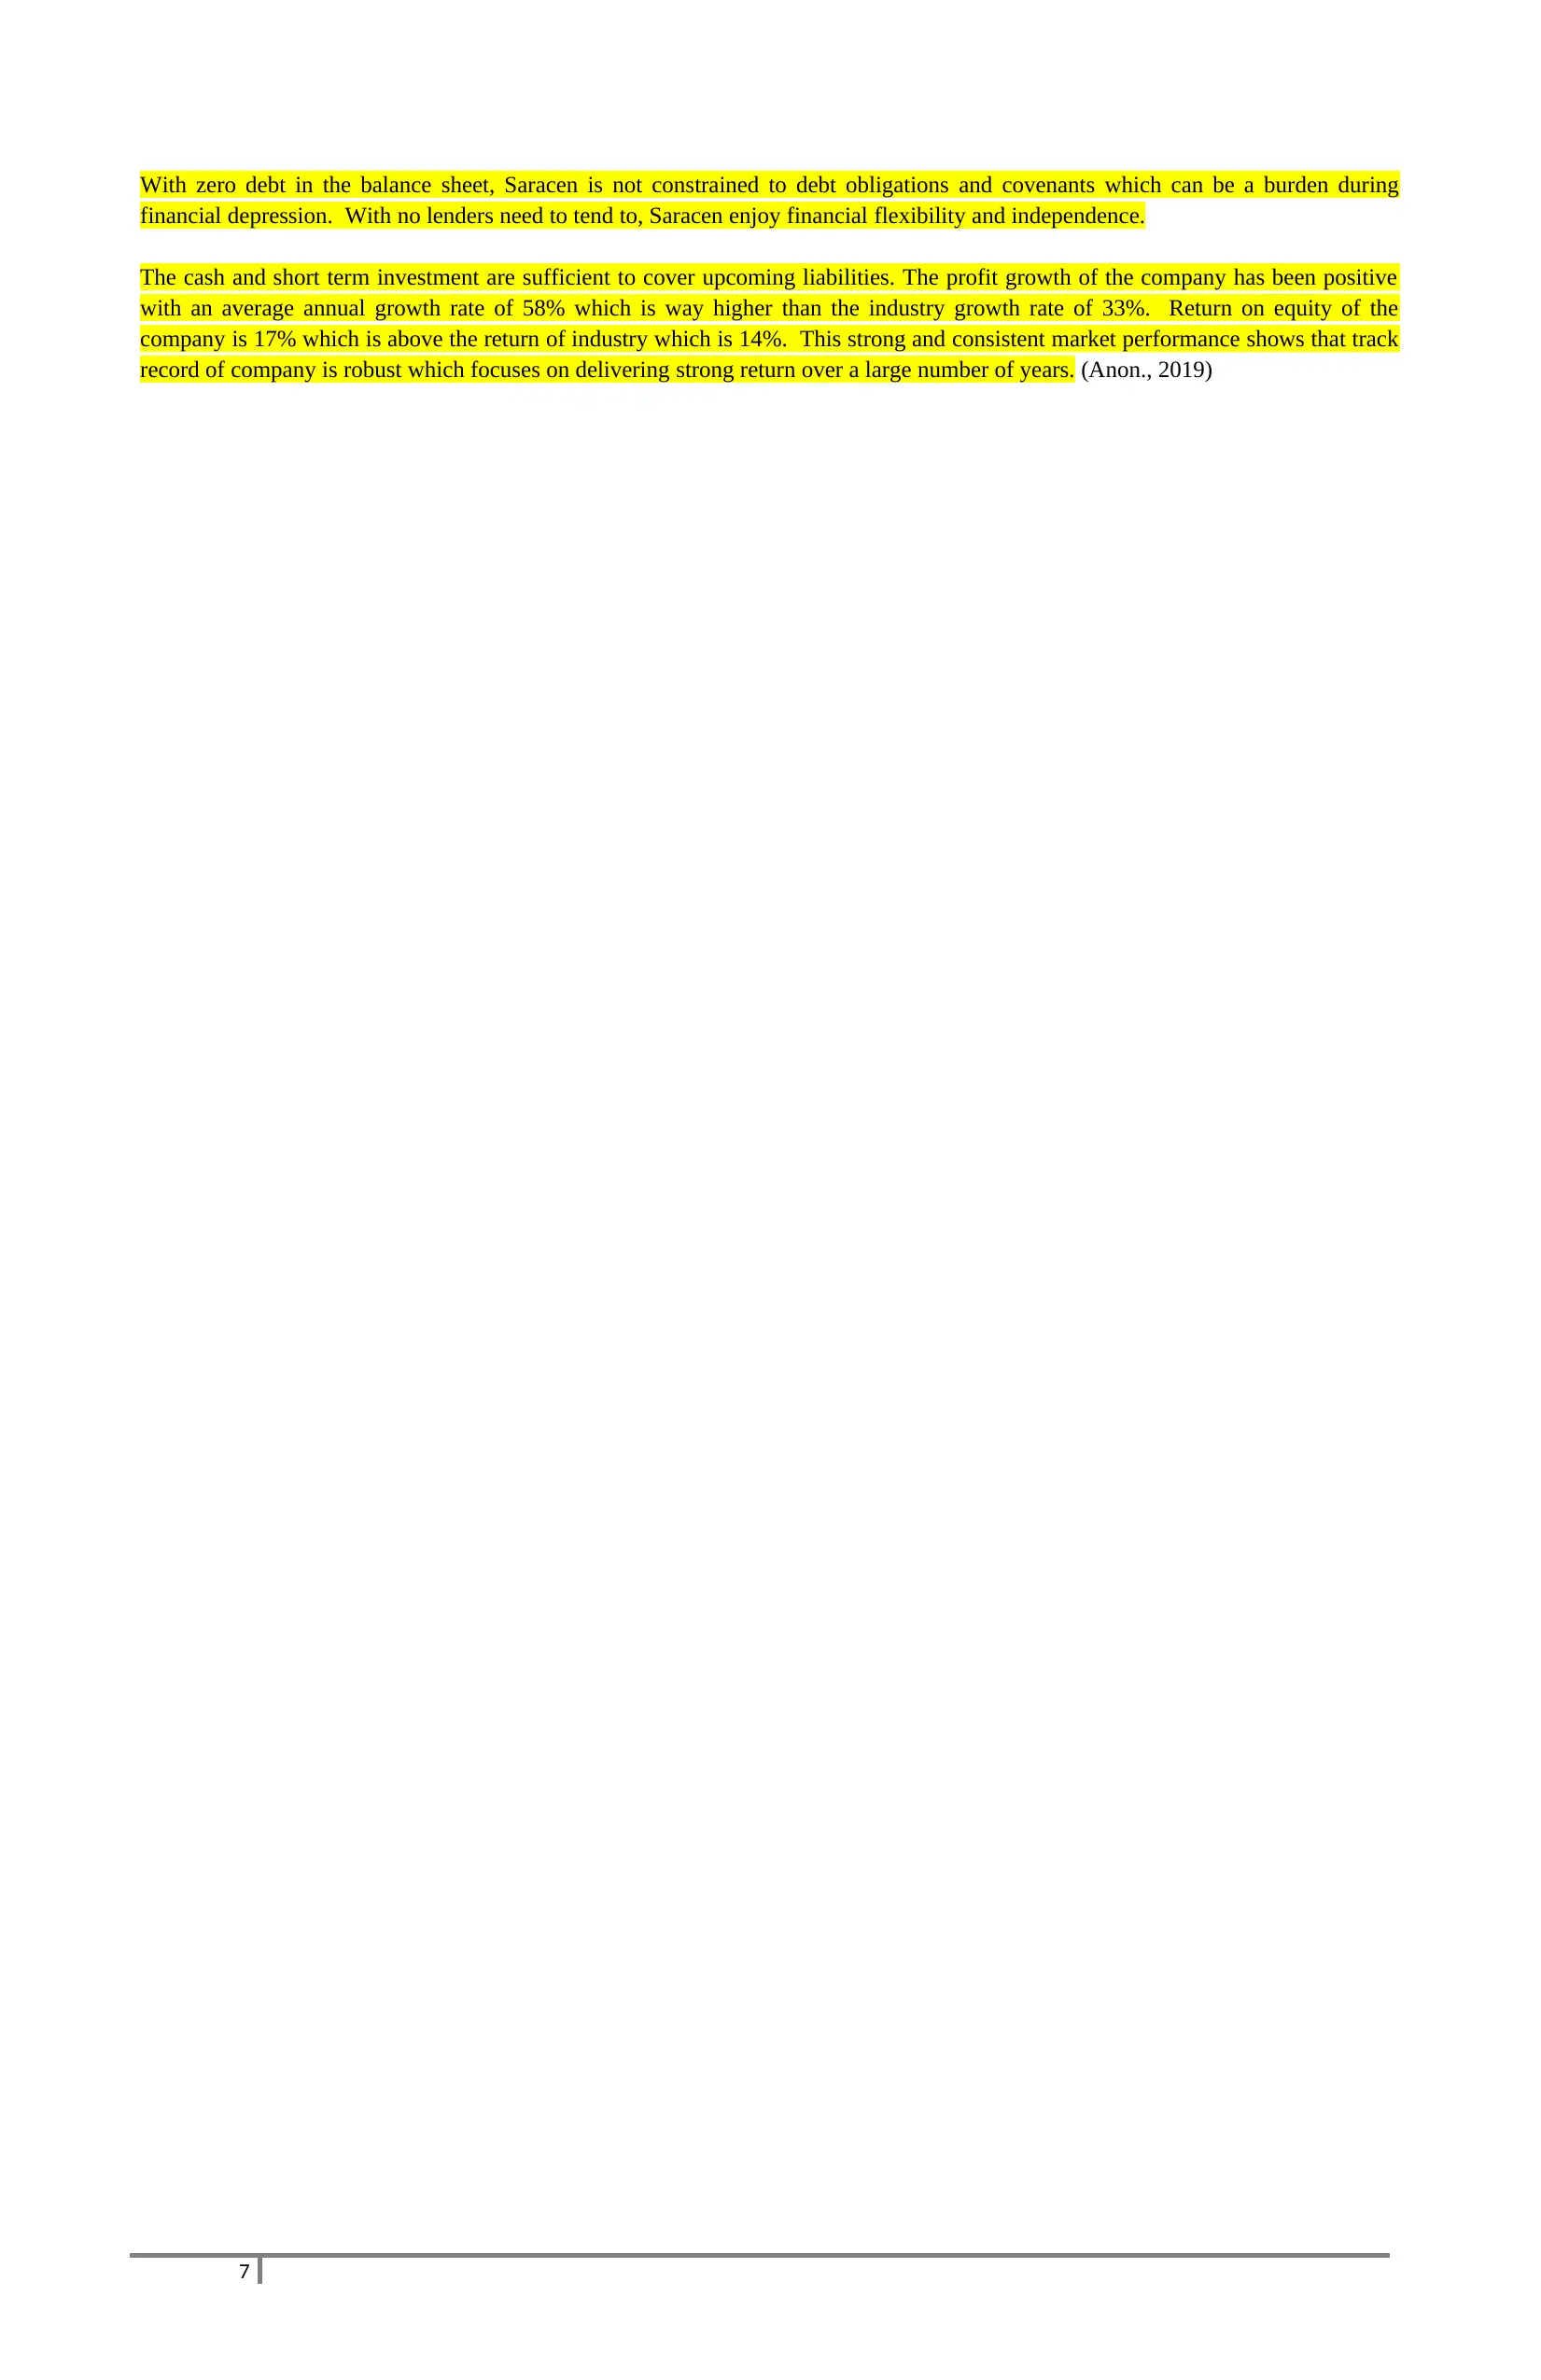
With zero debt in the balance sheet, Saracen is not constrained to debt obligations and covenants which can be a burden during
financial depression. With no lenders need to tend to, Saracen enjoy financial flexibility and independence.
The cash and short term investment are sufficient to cover upcoming liabilities. The profit growth of the company has been positive
with an average annual growth rate of 58% which is way higher than the industry growth rate of 33%. Return on equity of the
company is 17% which is above the return of industry which is 14%. This strong and consistent market performance shows that track
record of company is robust which focuses on delivering strong return over a large number of years. (Anon., 2019)
7
Paraphrase This Document
Need a fresh take? Get an instant paraphrase of this document with our AI Paraphraser
Financial Analysis
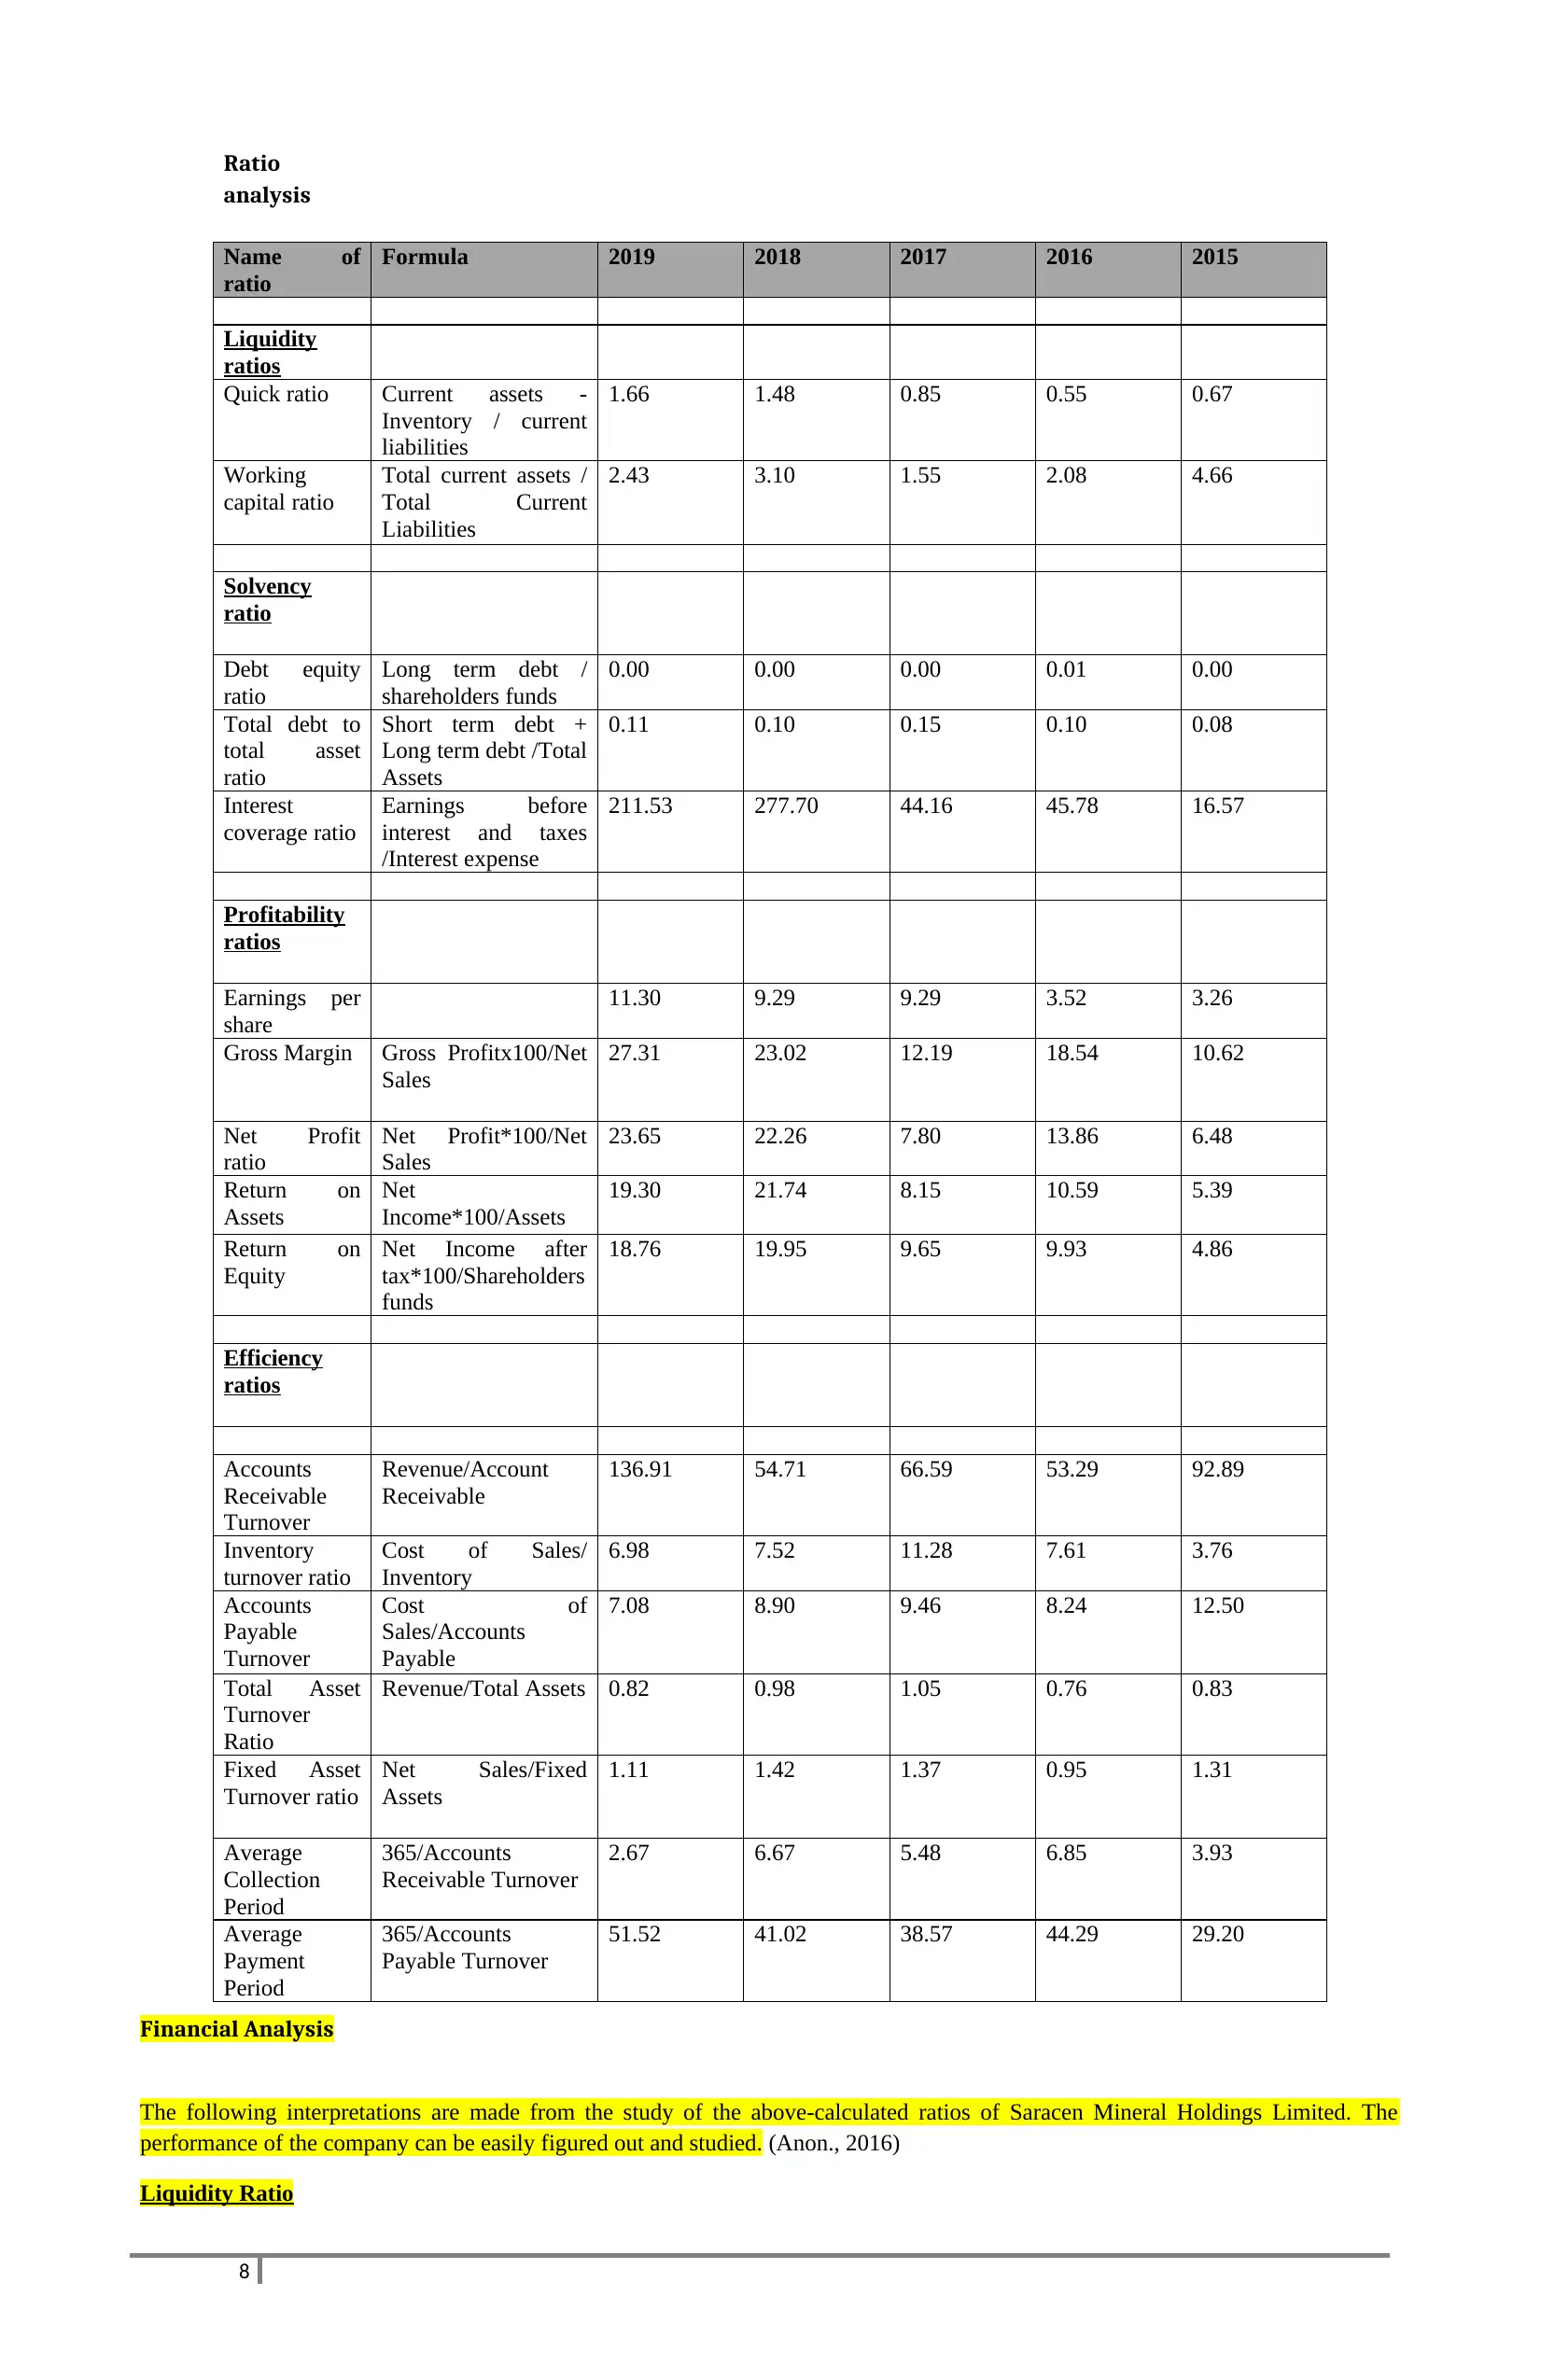
The following interpretations are made from the study of the above-calculated ratios of Saracen Mineral Holdings Limited. The
performance of the company can be easily figured out and studied. (Anon., 2016)
Liquidity Ratio
8
Ratio
analysis
Name of
ratio
Formula 2019 2018 2017 2016 2015
Liquidity
ratios
Quick ratio Current assets -
Inventory / current
liabilities
1.66 1.48 0.85 0.55 0.67
Working
capital ratio
Total current assets /
Total Current
Liabilities
2.43 3.10 1.55 2.08 4.66
Solvency
ratio
Debt equity
ratio
Long term debt /
shareholders funds
0.00 0.00 0.00 0.01 0.00
Total debt to
total asset
ratio
Short term debt +
Long term debt /Total
Assets
0.11 0.10 0.15 0.10 0.08
Interest
coverage ratio
Earnings before
interest and taxes
/Interest expense
211.53 277.70 44.16 45.78 16.57
Profitability
ratios
Earnings per
share
11.30 9.29 9.29 3.52 3.26
Gross Margin Gross Profitx100/Net
Sales
27.31 23.02 12.19 18.54 10.62
Net Profit
ratio
Net Profit*100/Net
Sales
23.65 22.26 7.80 13.86 6.48
Return on
Assets
Net
Income*100/Assets
19.30 21.74 8.15 10.59 5.39
Return on
Equity
Net Income after
tax*100/Shareholders
funds
18.76 19.95 9.65 9.93 4.86
Efficiency
ratios
Accounts
Receivable
Turnover
Revenue/Account
Receivable
136.91 54.71 66.59 53.29 92.89
Inventory
turnover ratio
Cost of Sales/
Inventory
6.98 7.52 11.28 7.61 3.76
Accounts
Payable
Turnover
Cost of
Sales/Accounts
Payable
7.08 8.90 9.46 8.24 12.50
Total Asset
Turnover
Ratio
Revenue/Total Assets 0.82 0.98 1.05 0.76 0.83
Fixed Asset
Turnover ratio
Net Sales/Fixed
Assets
1.11 1.42 1.37 0.95 1.31
Average
Collection
Period
365/Accounts
Receivable Turnover
2.67 6.67 5.48 6.85 3.93
Average
Payment
Period
365/Accounts
Payable Turnover
51.52 41.02 38.57 44.29 29.20
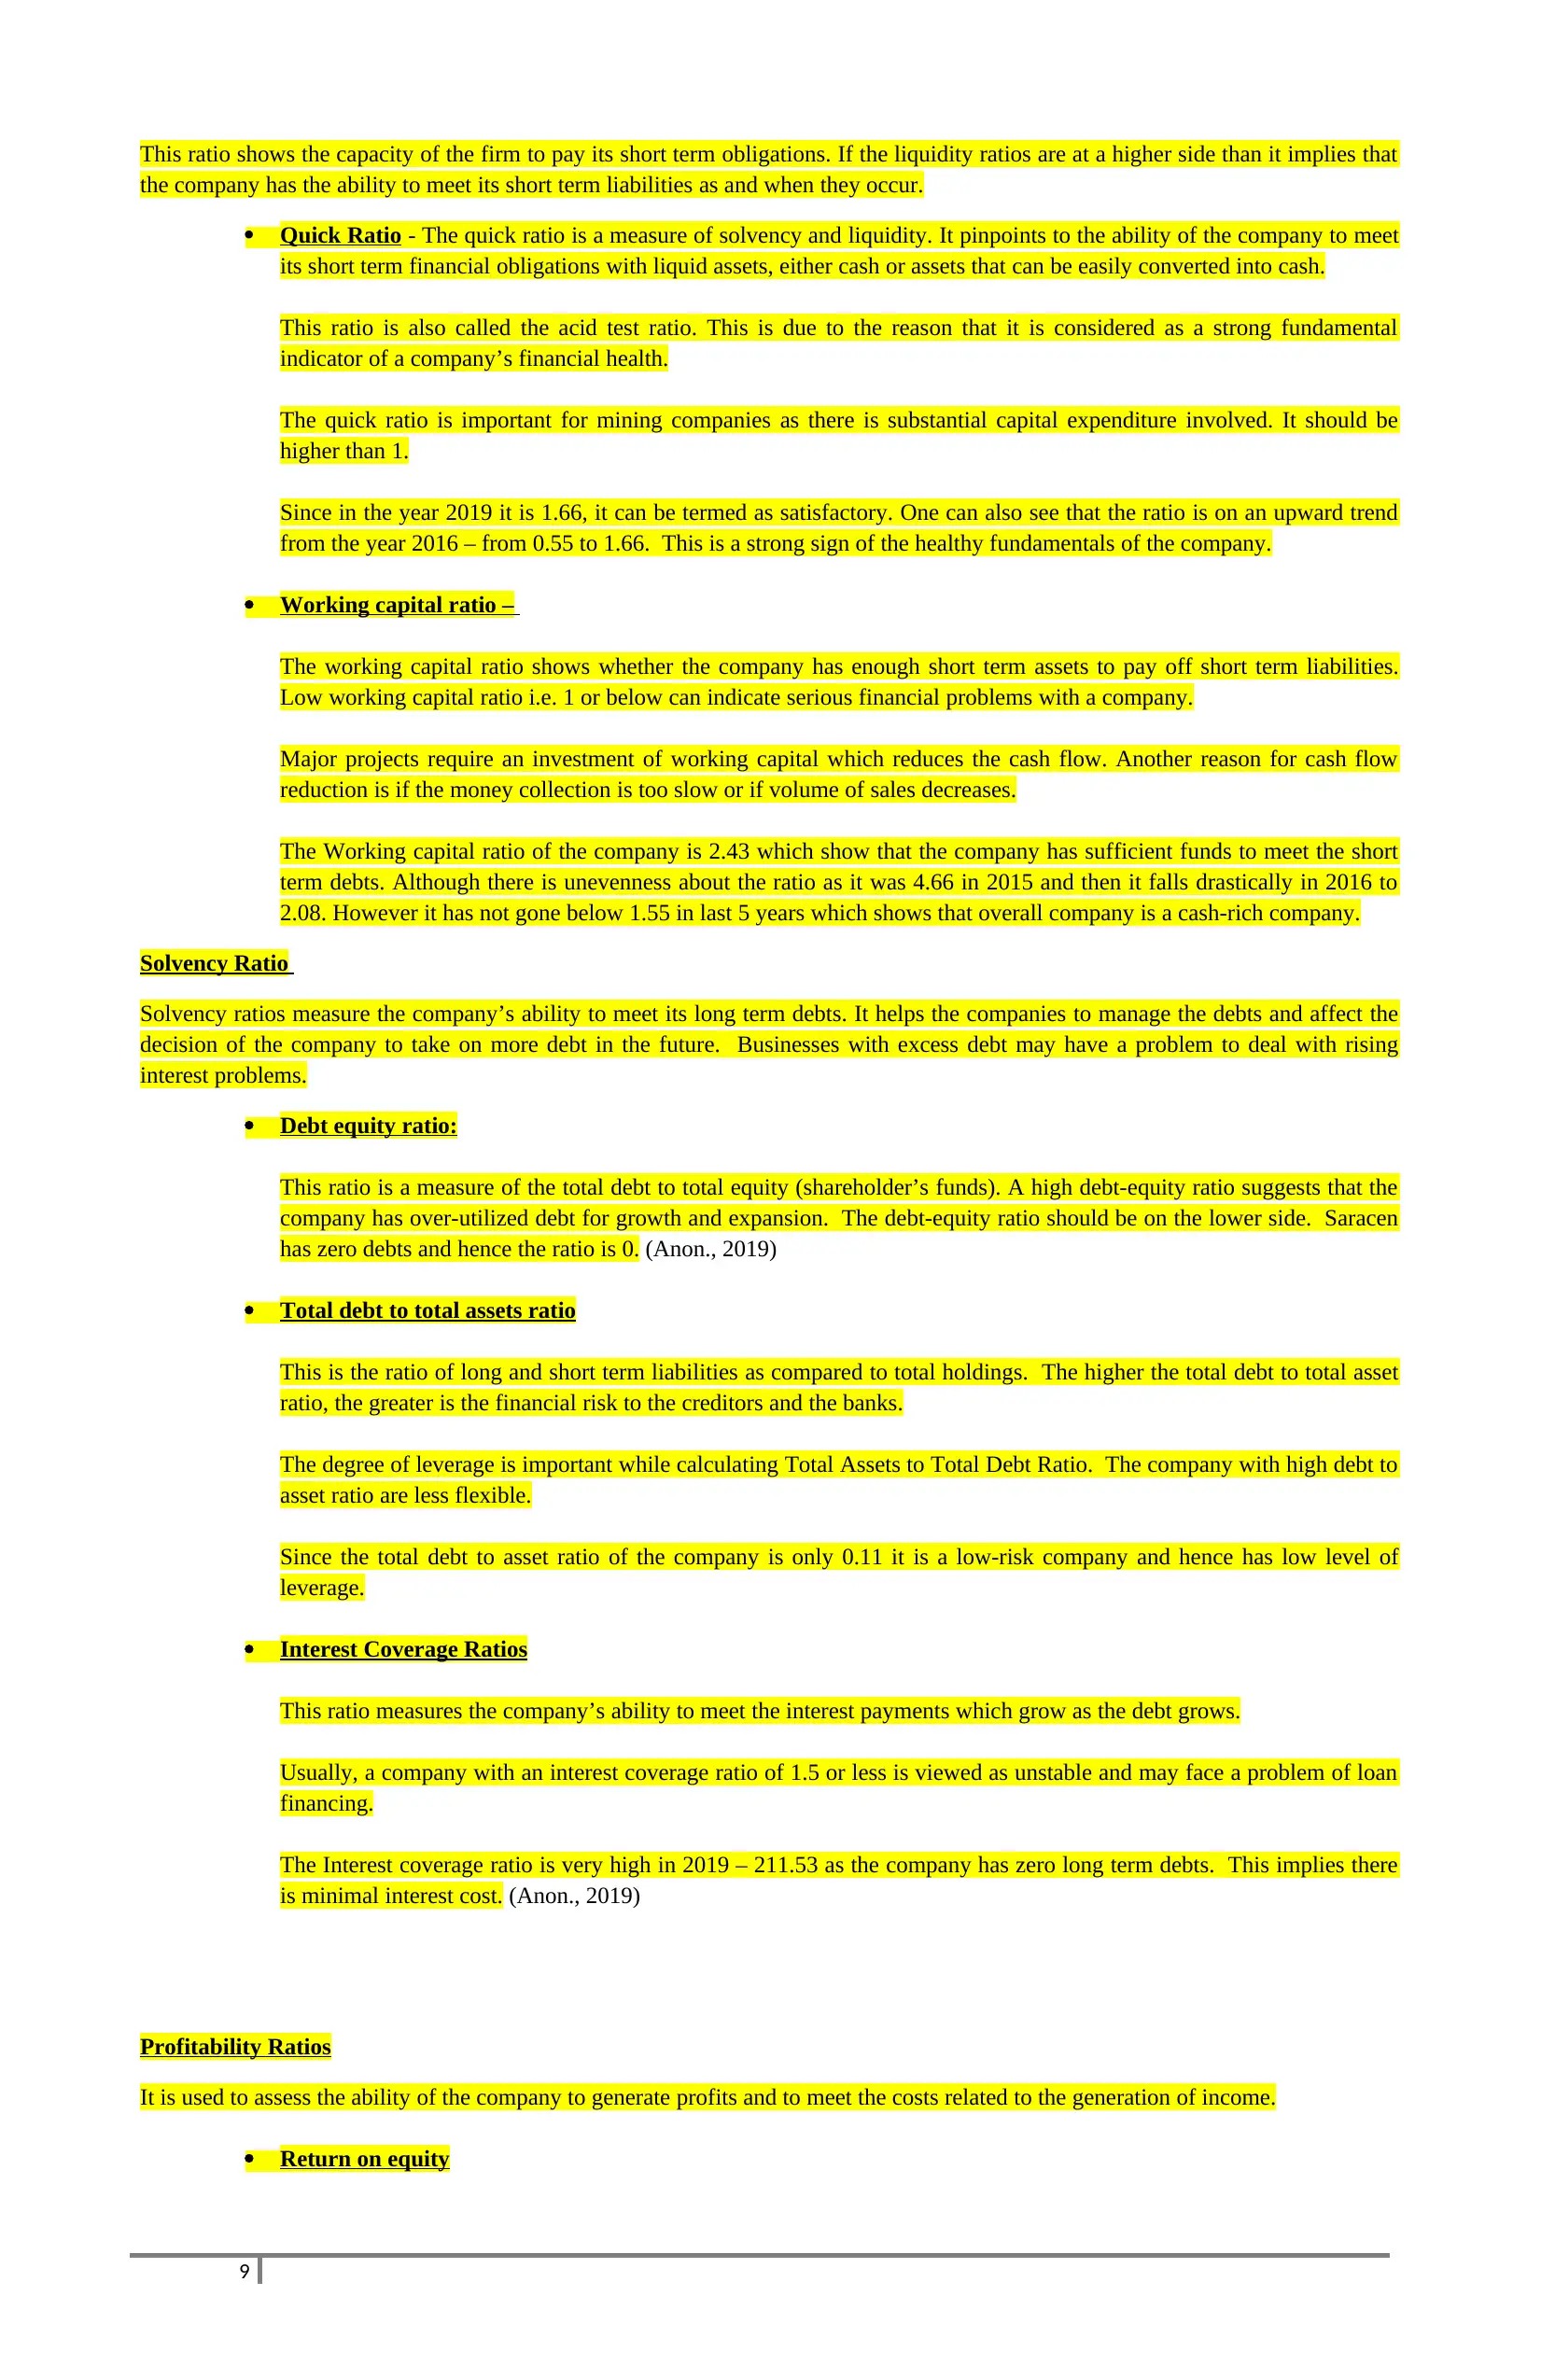
This ratio shows the capacity of the firm to pay its short term obligations. If the liquidity ratios are at a higher side than it implies that
the company has the ability to meet its short term liabilities as and when they occur.
Quick Ratio - The quick ratio is a measure of solvency and liquidity. It pinpoints to the ability of the company to meet
its short term financial obligations with liquid assets, either cash or assets that can be easily converted into cash.
This ratio is also called the acid test ratio. This is due to the reason that it is considered as a strong fundamental
indicator of a company’s financial health.
The quick ratio is important for mining companies as there is substantial capital expenditure involved. It should be
higher than 1.
Since in the year 2019 it is 1.66, it can be termed as satisfactory. One can also see that the ratio is on an upward trend
from the year 2016 – from 0.55 to 1.66. This is a strong sign of the healthy fundamentals of the company.
Working capital ratio –
The working capital ratio shows whether the company has enough short term assets to pay off short term liabilities.
Low working capital ratio i.e. 1 or below can indicate serious financial problems with a company.
Major projects require an investment of working capital which reduces the cash flow. Another reason for cash flow
reduction is if the money collection is too slow or if volume of sales decreases.
The Working capital ratio of the company is 2.43 which show that the company has sufficient funds to meet the short
term debts. Although there is unevenness about the ratio as it was 4.66 in 2015 and then it falls drastically in 2016 to
2.08. However it has not gone below 1.55 in last 5 years which shows that overall company is a cash-rich company.
Solvency Ratio
Solvency ratios measure the company’s ability to meet its long term debts. It helps the companies to manage the debts and affect the
decision of the company to take on more debt in the future. Businesses with excess debt may have a problem to deal with rising
interest problems.
Debt equity ratio:
This ratio is a measure of the total debt to total equity (shareholder’s funds). A high debt-equity ratio suggests that the
company has over-utilized debt for growth and expansion. The debt-equity ratio should be on the lower side. Saracen
has zero debts and hence the ratio is 0. (Anon., 2019)
Total debt to total assets ratio
This is the ratio of long and short term liabilities as compared to total holdings. The higher the total debt to total asset
ratio, the greater is the financial risk to the creditors and the banks.
The degree of leverage is important while calculating Total Assets to Total Debt Ratio. The company with high debt to
asset ratio are less flexible.
Since the total debt to asset ratio of the company is only 0.11 it is a low-risk company and hence has low level of
leverage.
Interest Coverage Ratios
This ratio measures the company’s ability to meet the interest payments which grow as the debt grows.
Usually, a company with an interest coverage ratio of 1.5 or less is viewed as unstable and may face a problem of loan
financing.
The Interest coverage ratio is very high in 2019 – 211.53 as the company has zero long term debts. This implies there
is minimal interest cost. (Anon., 2019)
Profitability Ratios
It is used to assess the ability of the company to generate profits and to meet the costs related to the generation of income.
Return on equity
9
⊘ This is a preview!⊘
Do you want full access?
Subscribe today to unlock all pages.
Trusted by 1+ million students worldwide
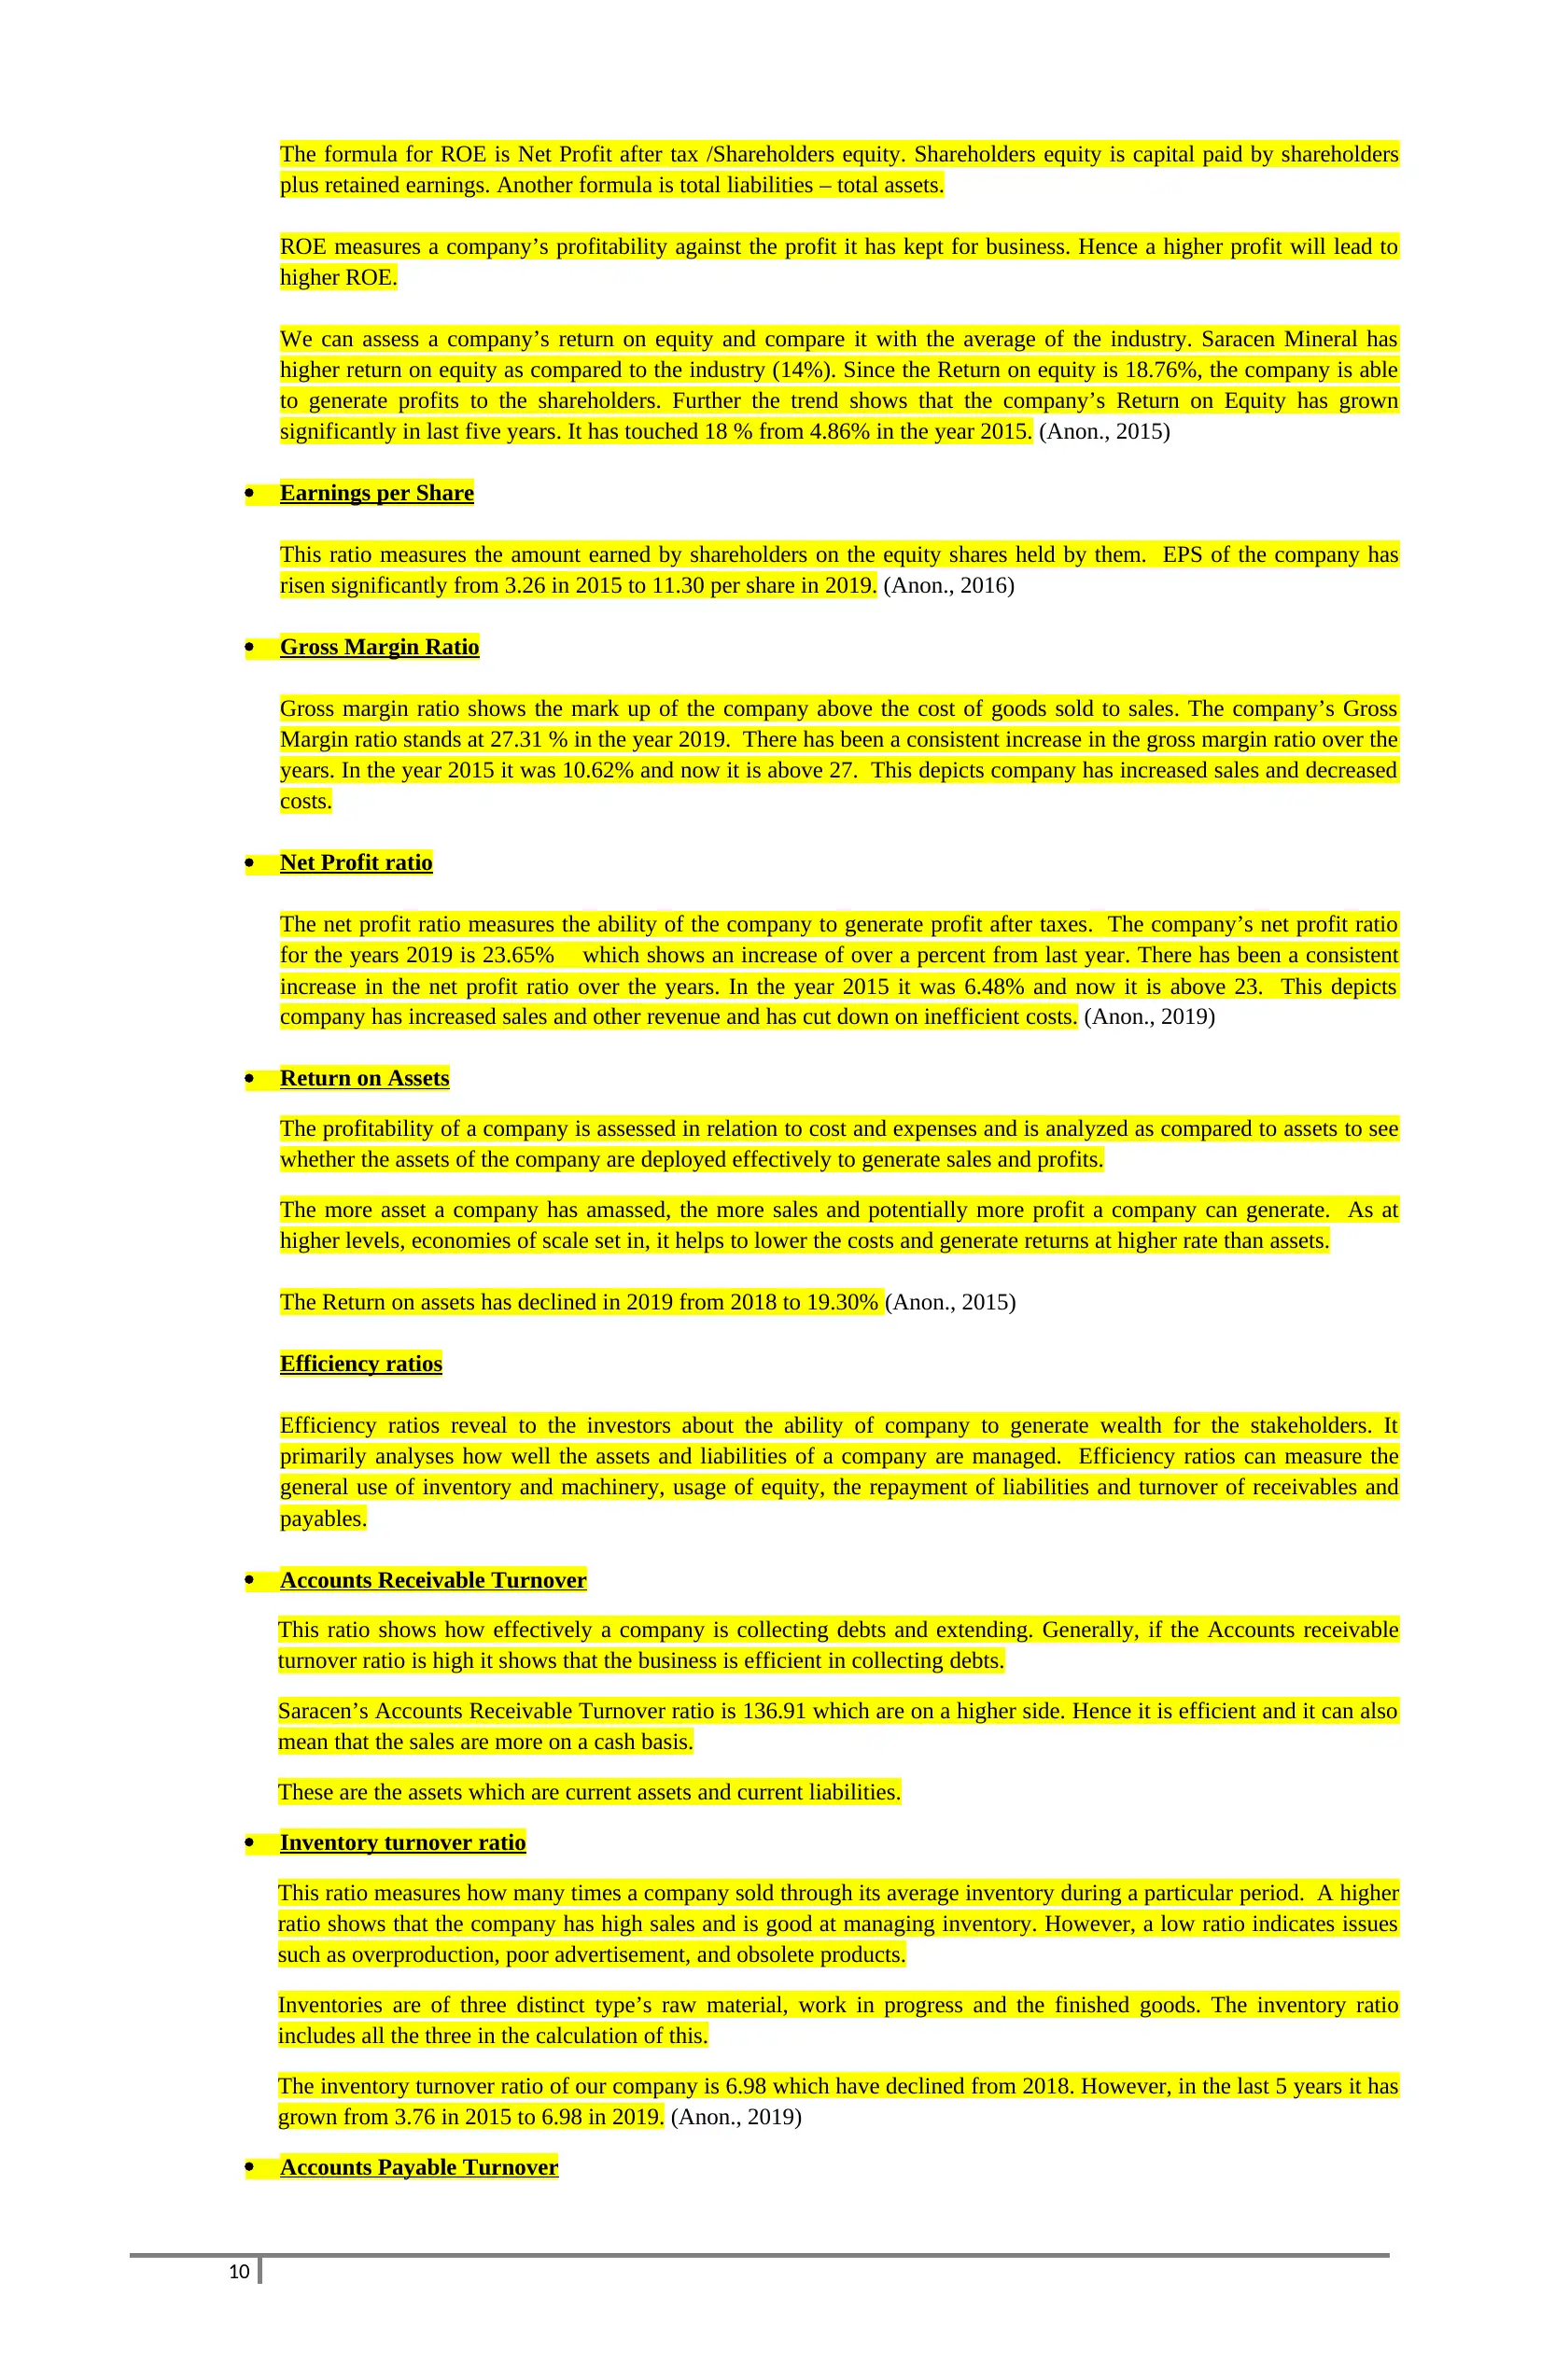
The formula for ROE is Net Profit after tax /Shareholders equity. Shareholders equity is capital paid by shareholders
plus retained earnings. Another formula is total liabilities – total assets.
ROE measures a company’s profitability against the profit it has kept for business. Hence a higher profit will lead to
higher ROE.
We can assess a company’s return on equity and compare it with the average of the industry. Saracen Mineral has
higher return on equity as compared to the industry (14%). Since the Return on equity is 18.76%, the company is able
to generate profits to the shareholders. Further the trend shows that the company’s Return on Equity has grown
significantly in last five years. It has touched 18 % from 4.86% in the year 2015. (Anon., 2015)
Earnings per Share
This ratio measures the amount earned by shareholders on the equity shares held by them. EPS of the company has
risen significantly from 3.26 in 2015 to 11.30 per share in 2019. (Anon., 2016)
Gross Margin Ratio
Gross margin ratio shows the mark up of the company above the cost of goods sold to sales. The company’s Gross
Margin ratio stands at 27.31 % in the year 2019. There has been a consistent increase in the gross margin ratio over the
years. In the year 2015 it was 10.62% and now it is above 27. This depicts company has increased sales and decreased
costs.
Net Profit ratio
The net profit ratio measures the ability of the company to generate profit after taxes. The company’s net profit ratio
for the years 2019 is 23.65% which shows an increase of over a percent from last year. There has been a consistent
increase in the net profit ratio over the years. In the year 2015 it was 6.48% and now it is above 23. This depicts
company has increased sales and other revenue and has cut down on inefficient costs. (Anon., 2019)
Return on Assets
The profitability of a company is assessed in relation to cost and expenses and is analyzed as compared to assets to see
whether the assets of the company are deployed effectively to generate sales and profits.
The more asset a company has amassed, the more sales and potentially more profit a company can generate. As at
higher levels, economies of scale set in, it helps to lower the costs and generate returns at higher rate than assets.
The Return on assets has declined in 2019 from 2018 to 19.30% (Anon., 2015)
Efficiency ratios
Efficiency ratios reveal to the investors about the ability of company to generate wealth for the stakeholders. It
primarily analyses how well the assets and liabilities of a company are managed. Efficiency ratios can measure the
general use of inventory and machinery, usage of equity, the repayment of liabilities and turnover of receivables and
payables.
Accounts Receivable Turnover
This ratio shows how effectively a company is collecting debts and extending. Generally, if the Accounts receivable
turnover ratio is high it shows that the business is efficient in collecting debts.
Saracen’s Accounts Receivable Turnover ratio is 136.91 which are on a higher side. Hence it is efficient and it can also
mean that the sales are more on a cash basis.
These are the assets which are current assets and current liabilities.
Inventory turnover ratio
This ratio measures how many times a company sold through its average inventory during a particular period. A higher
ratio shows that the company has high sales and is good at managing inventory. However, a low ratio indicates issues
such as overproduction, poor advertisement, and obsolete products.
Inventories are of three distinct type’s raw material, work in progress and the finished goods. The inventory ratio
includes all the three in the calculation of this.
The inventory turnover ratio of our company is 6.98 which have declined from 2018. However, in the last 5 years it has
grown from 3.76 in 2015 to 6.98 in 2019. (Anon., 2019)
Accounts Payable Turnover
10
Paraphrase This Document
Need a fresh take? Get an instant paraphrase of this document with our AI Paraphraser
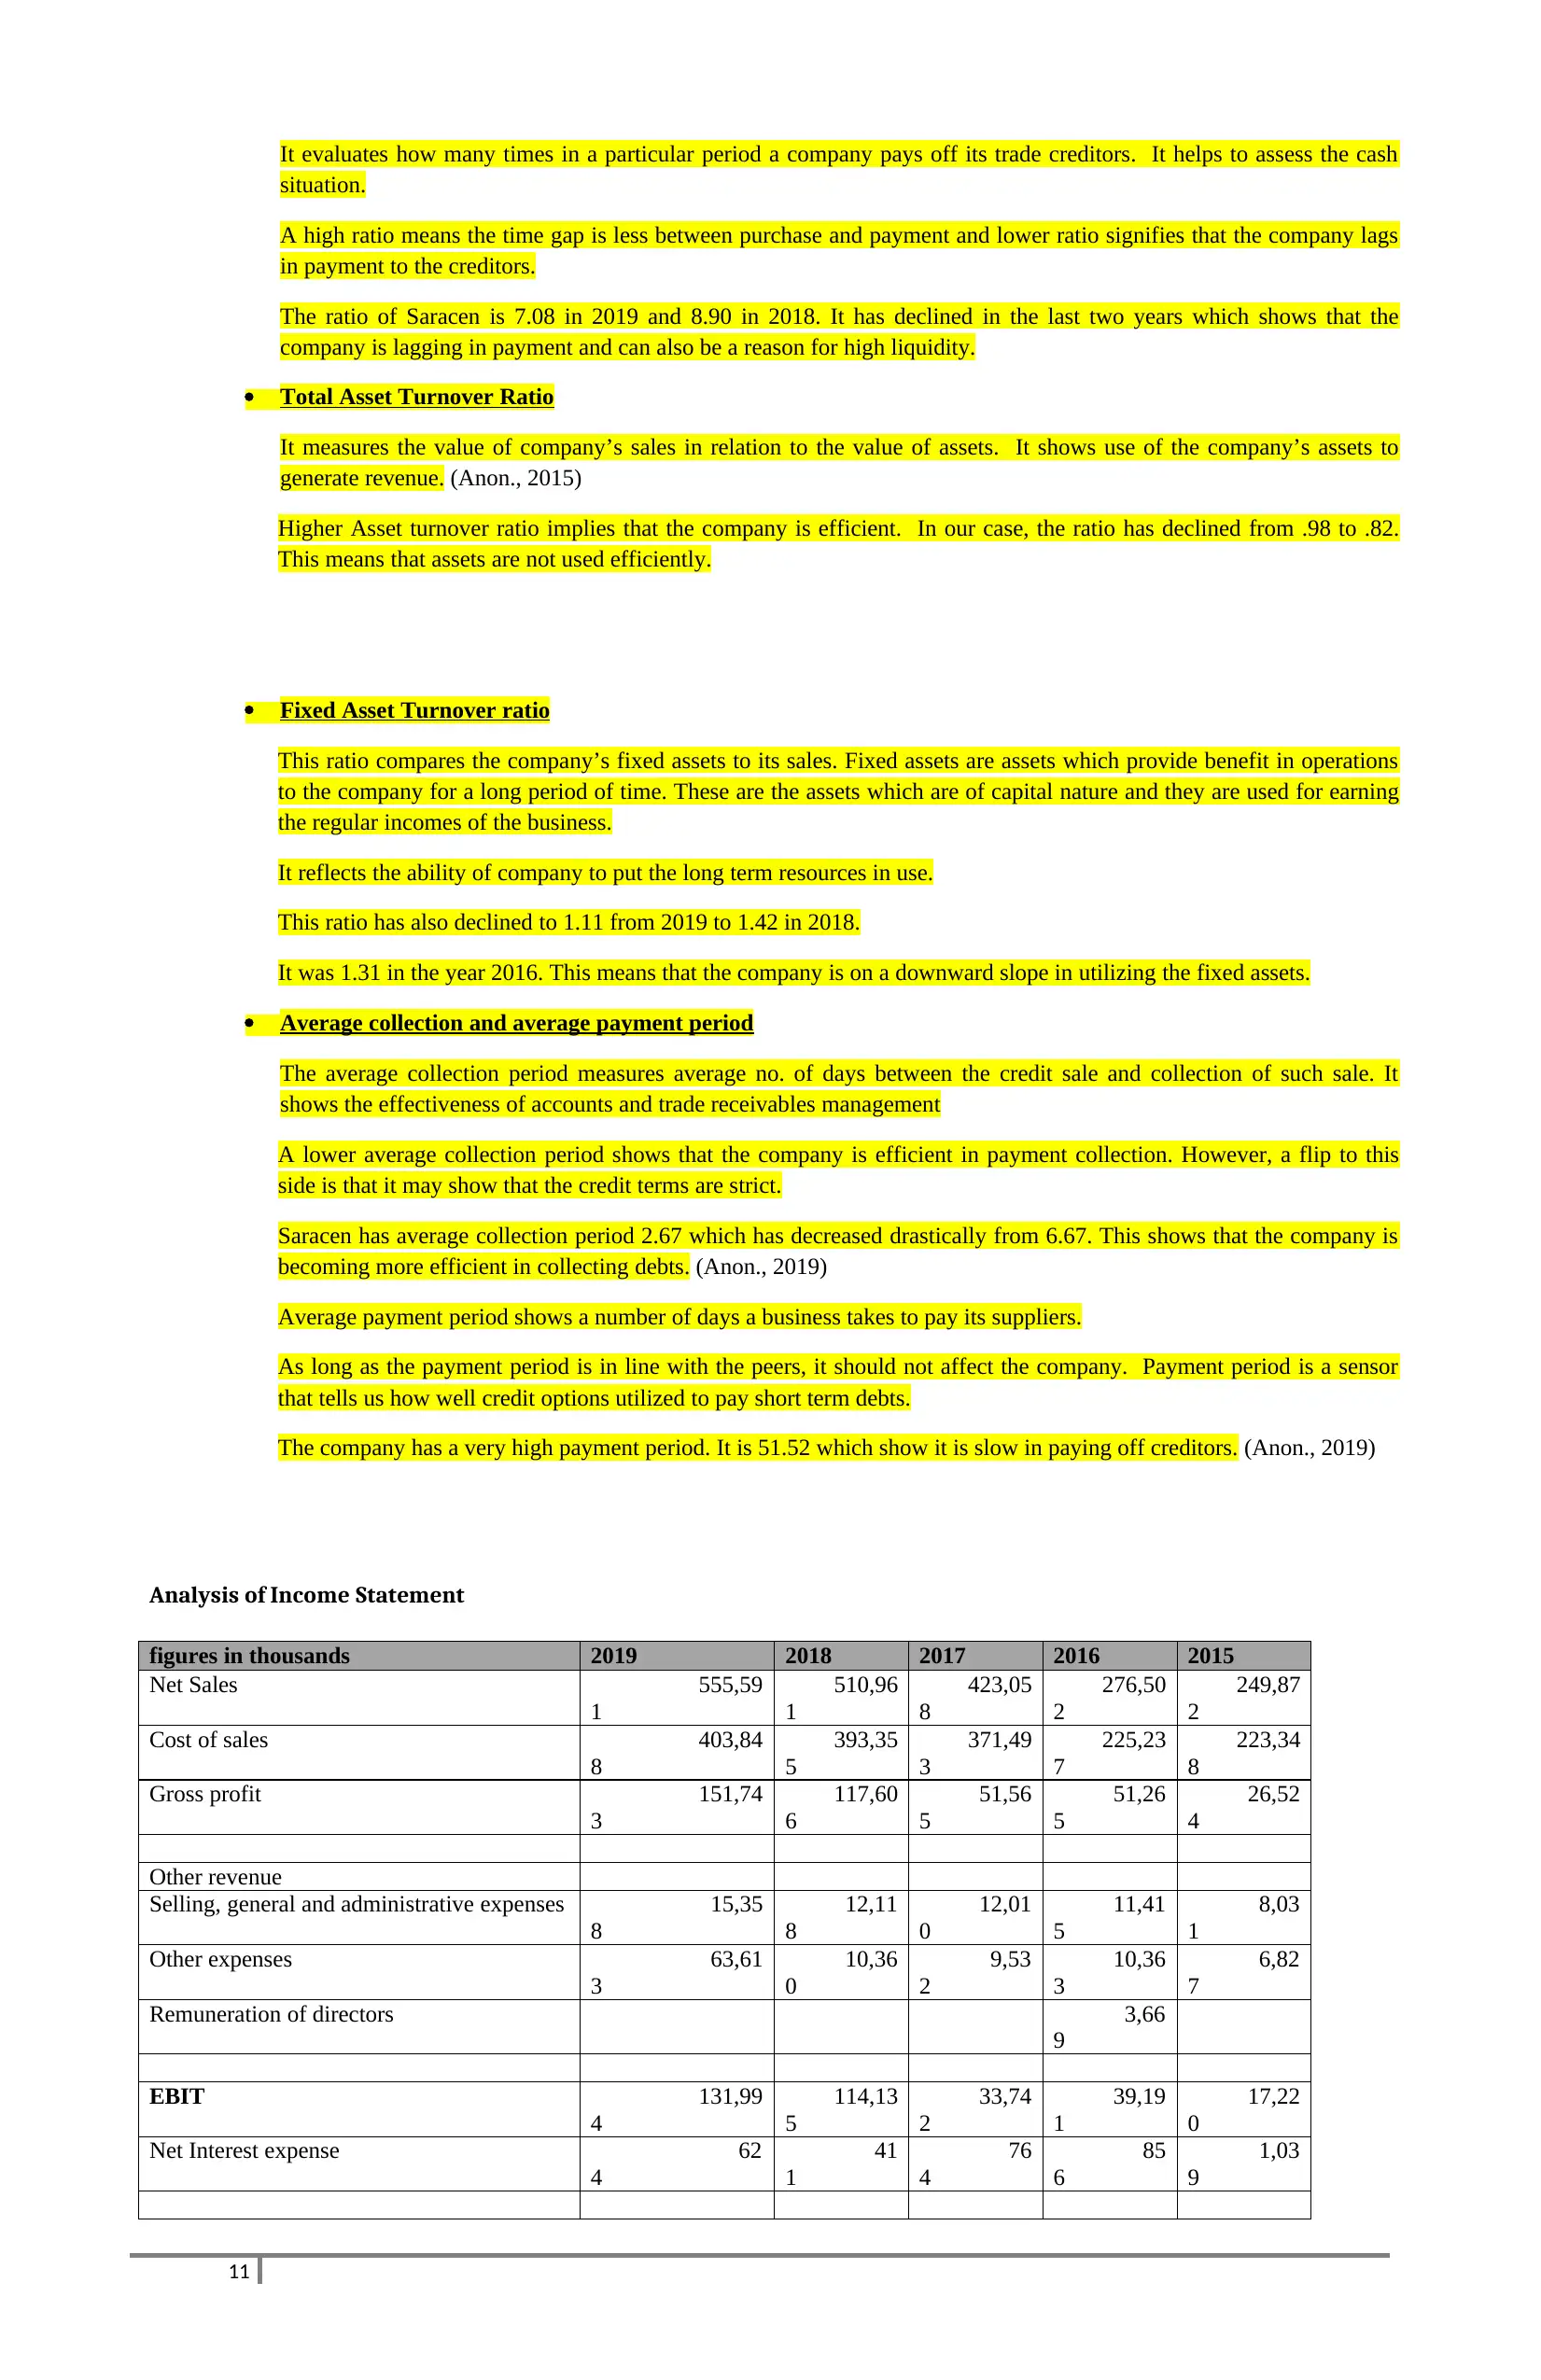
It evaluates how many times in a particular period a company pays off its trade creditors. It helps to assess the cash
situation.
A high ratio means the time gap is less between purchase and payment and lower ratio signifies that the company lags
in payment to the creditors.
The ratio of Saracen is 7.08 in 2019 and 8.90 in 2018. It has declined in the last two years which shows that the
company is lagging in payment and can also be a reason for high liquidity.
Total Asset Turnover Ratio
It measures the value of company’s sales in relation to the value of assets. It shows use of the company’s assets to
generate revenue. (Anon., 2015)
Higher Asset turnover ratio implies that the company is efficient. In our case, the ratio has declined from .98 to .82.
This means that assets are not used efficiently.
Fixed Asset Turnover ratio
This ratio compares the company’s fixed assets to its sales. Fixed assets are assets which provide benefit in operations
to the company for a long period of time. These are the assets which are of capital nature and they are used for earning
the regular incomes of the business.
It reflects the ability of company to put the long term resources in use.
This ratio has also declined to 1.11 from 2019 to 1.42 in 2018.
It was 1.31 in the year 2016. This means that the company is on a downward slope in utilizing the fixed assets.
Average collection and average payment period
The average collection period measures average no. of days between the credit sale and collection of such sale. It
shows the effectiveness of accounts and trade receivables management
A lower average collection period shows that the company is efficient in payment collection. However, a flip to this
side is that it may show that the credit terms are strict.
Saracen has average collection period 2.67 which has decreased drastically from 6.67. This shows that the company is
becoming more efficient in collecting debts. (Anon., 2019)
Average payment period shows a number of days a business takes to pay its suppliers.
As long as the payment period is in line with the peers, it should not affect the company. Payment period is a sensor
that tells us how well credit options utilized to pay short term debts.
The company has a very high payment period. It is 51.52 which show it is slow in paying off creditors. (Anon., 2019)
Analysis of Income Statement
figures in thousands 2019 2018 2017 2016 2015
Net Sales 555,59
1
510,96
1
423,05
8
276,50
2
249,87
2
Cost of sales 403,84
8
393,35
5
371,49
3
225,23
7
223,34
8
Gross profit 151,74
3
117,60
6
51,56
5
51,26
5
26,52
4
Other revenue
Selling, general and administrative expenses 15,35
8
12,11
8
12,01
0
11,41
5
8,03
1
Other expenses 63,61
3
10,36
0
9,53
2
10,36
3
6,82
7
Remuneration of directors 3,66
9
EBIT 131,99
4
114,13
5
33,74
2
39,19
1
17,22
0
Net Interest expense 62
4
41
1
76
4
85
6
1,03
9
11
EBT 131,37
0
113,72
4
32,97
8
38,33
5
16,18
1
Income tax paid 38,87
6
37,68
9
4,59
2
12,44
6
5,03
3
Earnings After-tax 92,49
4
76,03
5
28,38
6
25,88
9
11,14
8
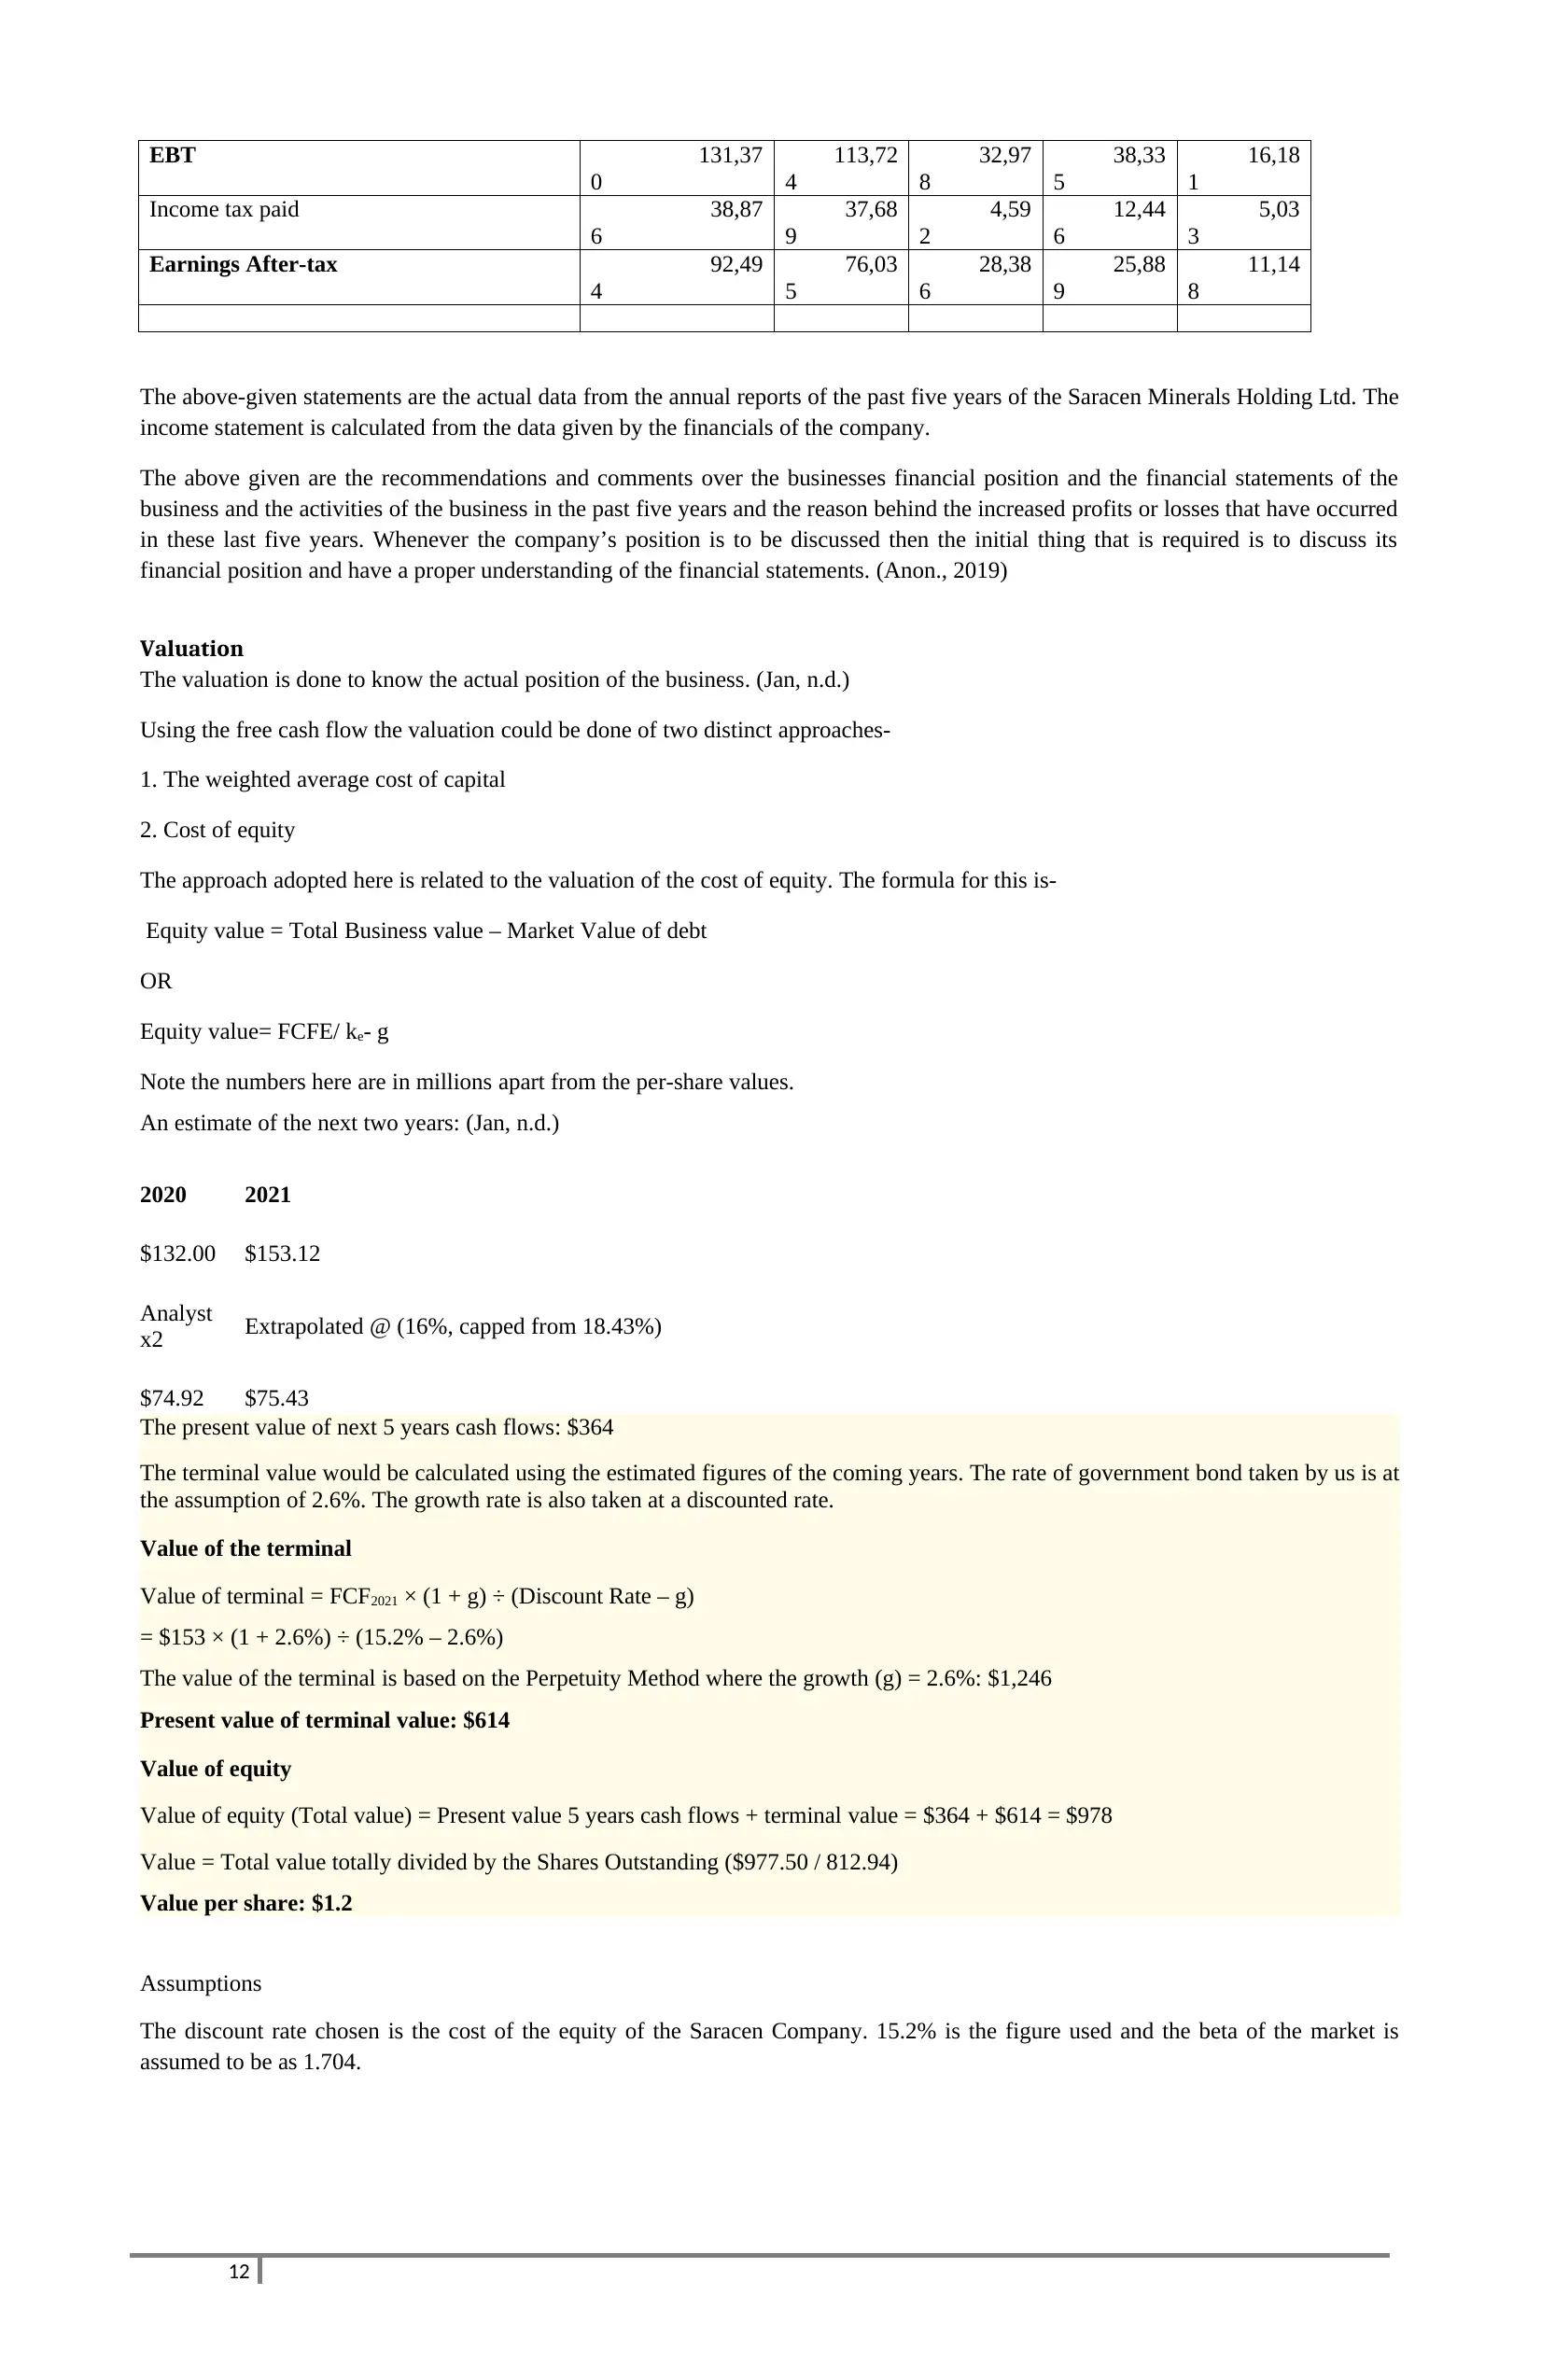
The above-given statements are the actual data from the annual reports of the past five years of the Saracen Minerals Holding Ltd. The
income statement is calculated from the data given by the financials of the company.
The above given are the recommendations and comments over the businesses financial position and the financial statements of the
business and the activities of the business in the past five years and the reason behind the increased profits or losses that have occurred
in these last five years. Whenever the company’s position is to be discussed then the initial thing that is required is to discuss its
financial position and have a proper understanding of the financial statements. (Anon., 2019)
Valuation
The valuation is done to know the actual position of the business. (Jan, n.d.)
Using the free cash flow the valuation could be done of two distinct approaches-
1. The weighted average cost of capital
2. Cost of equity
The approach adopted here is related to the valuation of the cost of equity. The formula for this is-
Equity value = Total Business value – Market Value of debt
OR
Equity value= FCFE/ ke- g
Note the numbers here are in millions apart from the per-share values.
An estimate of the next two years: (Jan, n.d.)
2020 2021
$132.00 $153.12
Analyst
x2 Extrapolated @ (16%, capped from 18.43%)
$74.92 $75.43
The present value of next 5 years cash flows: $364
The terminal value would be calculated using the estimated figures of the coming years. The rate of government bond taken by us is at
the assumption of 2.6%. The growth rate is also taken at a discounted rate.
Value of the terminal
Value of terminal = FCF2021 × (1 + g) ÷ (Discount Rate – g)
= $153 × (1 + 2.6%) ÷ (15.2% – 2.6%)
The value of the terminal is based on the Perpetuity Method where the growth (g) = 2.6%: $1,246
Present value of terminal value: $614
Value of equity
Value of equity (Total value) = Present value 5 years cash flows + terminal value = $364 + $614 = $978
Value = Total value totally divided by the Shares Outstanding ($977.50 / 812.94)
Value per share: $1.2
Assumptions
The discount rate chosen is the cost of the equity of the Saracen Company. 15.2% is the figure used and the beta of the market is
assumed to be as 1.704.
12
0
113,72
4
32,97
8
38,33
5
16,18
1
Income tax paid 38,87
6
37,68
9
4,59
2
12,44
6
5,03
3
Earnings After-tax 92,49
4
76,03
5
28,38
6
25,88
9
11,14
8
The above-given statements are the actual data from the annual reports of the past five years of the Saracen Minerals Holding Ltd. The
income statement is calculated from the data given by the financials of the company.
The above given are the recommendations and comments over the businesses financial position and the financial statements of the
business and the activities of the business in the past five years and the reason behind the increased profits or losses that have occurred
in these last five years. Whenever the company’s position is to be discussed then the initial thing that is required is to discuss its
financial position and have a proper understanding of the financial statements. (Anon., 2019)
Valuation
The valuation is done to know the actual position of the business. (Jan, n.d.)
Using the free cash flow the valuation could be done of two distinct approaches-
1. The weighted average cost of capital
2. Cost of equity
The approach adopted here is related to the valuation of the cost of equity. The formula for this is-
Equity value = Total Business value – Market Value of debt
OR
Equity value= FCFE/ ke- g
Note the numbers here are in millions apart from the per-share values.
An estimate of the next two years: (Jan, n.d.)
2020 2021
$132.00 $153.12
Analyst
x2 Extrapolated @ (16%, capped from 18.43%)
$74.92 $75.43
The present value of next 5 years cash flows: $364
The terminal value would be calculated using the estimated figures of the coming years. The rate of government bond taken by us is at
the assumption of 2.6%. The growth rate is also taken at a discounted rate.
Value of the terminal
Value of terminal = FCF2021 × (1 + g) ÷ (Discount Rate – g)
= $153 × (1 + 2.6%) ÷ (15.2% – 2.6%)
The value of the terminal is based on the Perpetuity Method where the growth (g) = 2.6%: $1,246
Present value of terminal value: $614
Value of equity
Value of equity (Total value) = Present value 5 years cash flows + terminal value = $364 + $614 = $978
Value = Total value totally divided by the Shares Outstanding ($977.50 / 812.94)
Value per share: $1.2
Assumptions
The discount rate chosen is the cost of the equity of the Saracen Company. 15.2% is the figure used and the beta of the market is
assumed to be as 1.704.
12
⊘ This is a preview!⊘
Do you want full access?
Subscribe today to unlock all pages.
Trusted by 1+ million students worldwide
1 out of 12
Related Documents


Your All-in-One AI-Powered Toolkit for Academic Success.
+13062052269
info@desklib.com
Available 24*7 on WhatsApp / Email
![[object Object]](/_next/static/media/star-bottom.7253800d.svg)
Unlock your academic potential
Copyright © 2020–2026 A2Z Services. All Rights Reserved. Developed and managed by ZUCOL.