PHSI2005: Analyzing Force-Length Relationship & Sarcomere Length

Verified

Added on  2023/06/12

|18
|1724
|160
Report
AI Summary
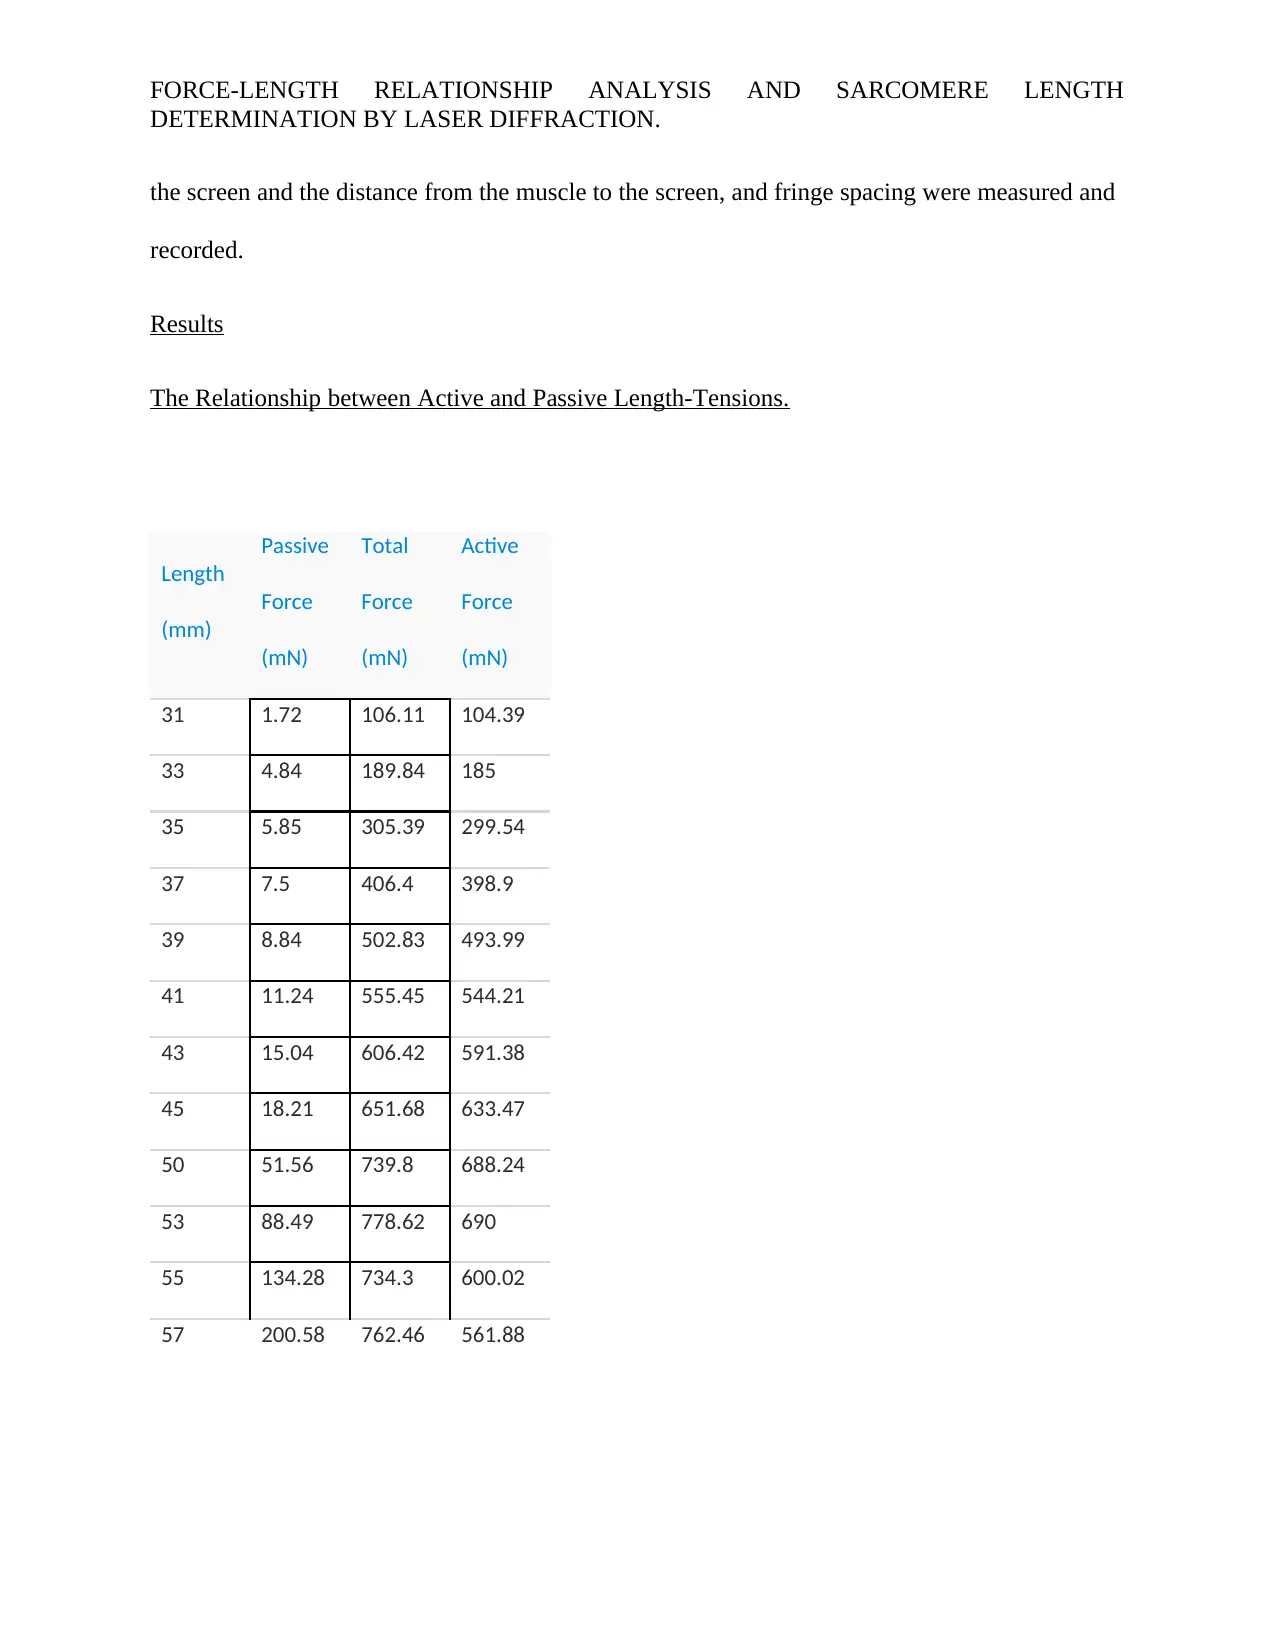
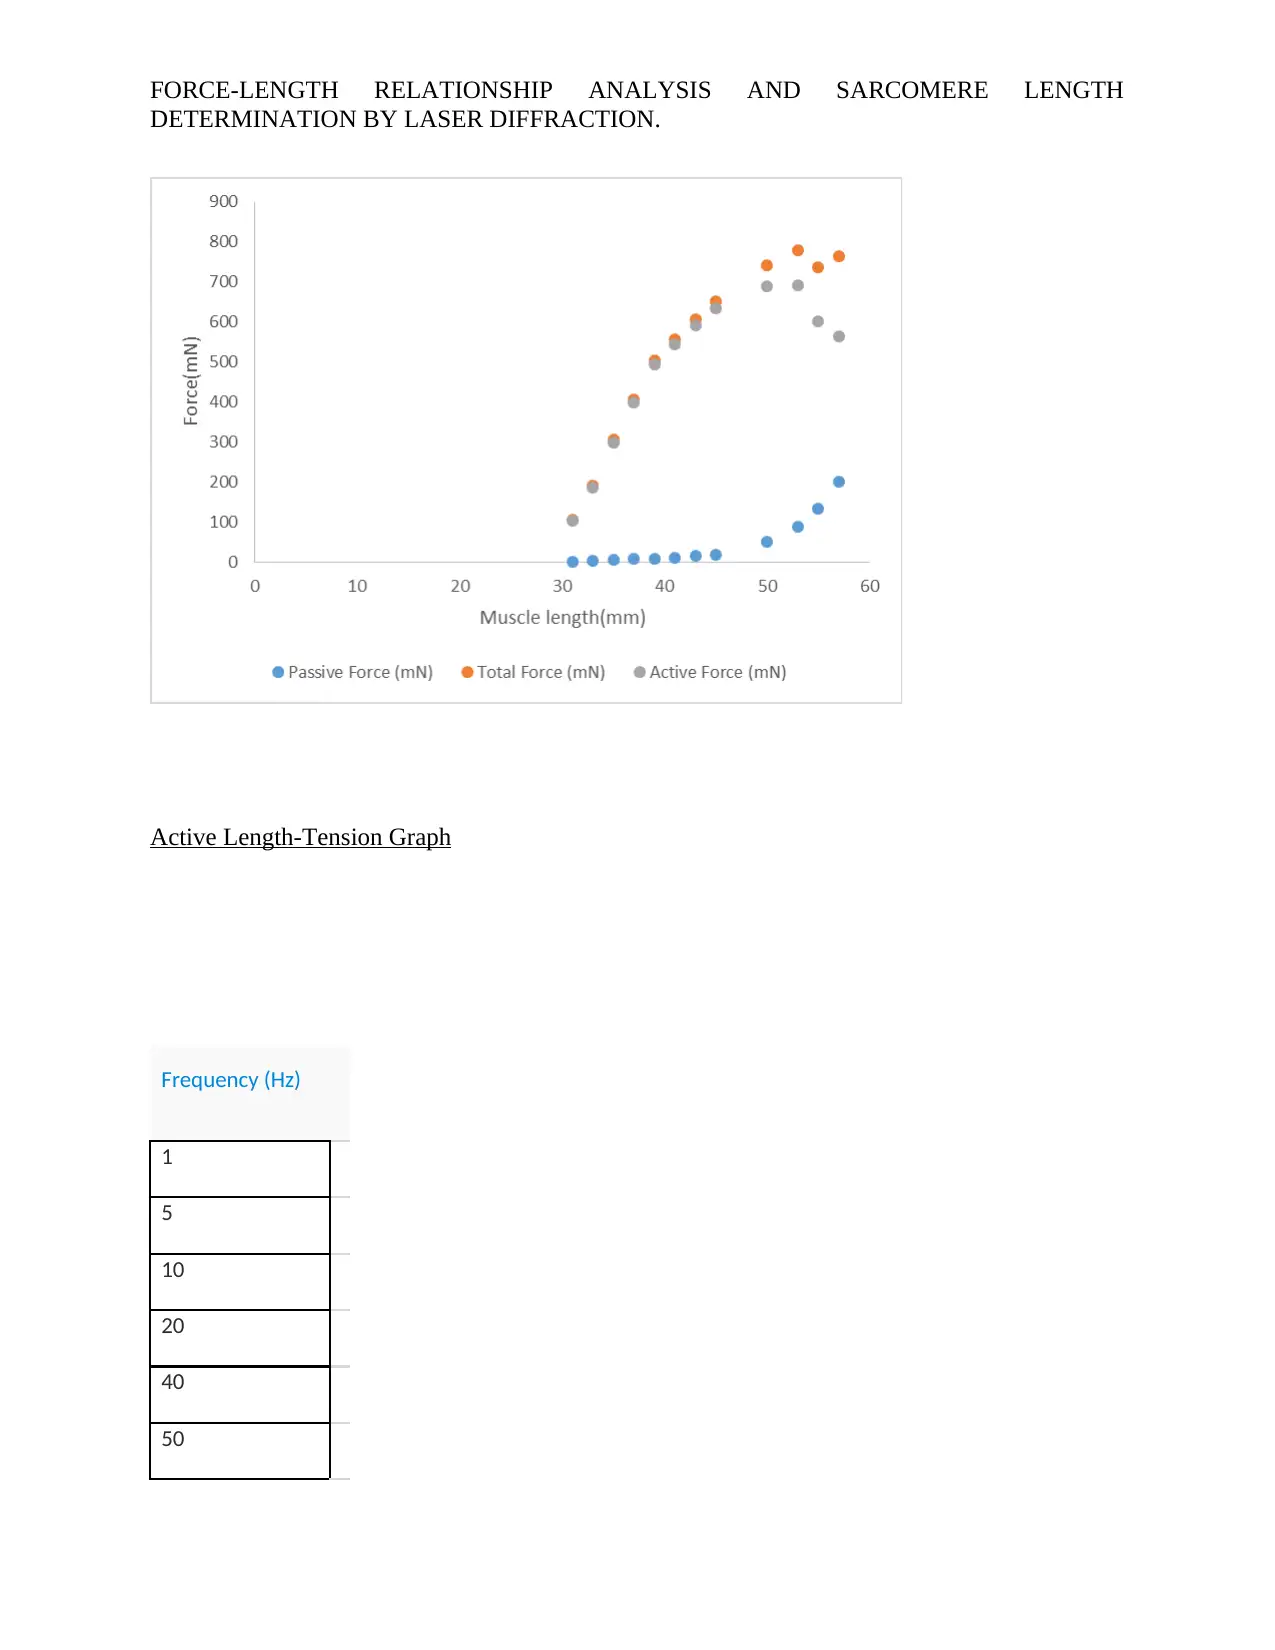
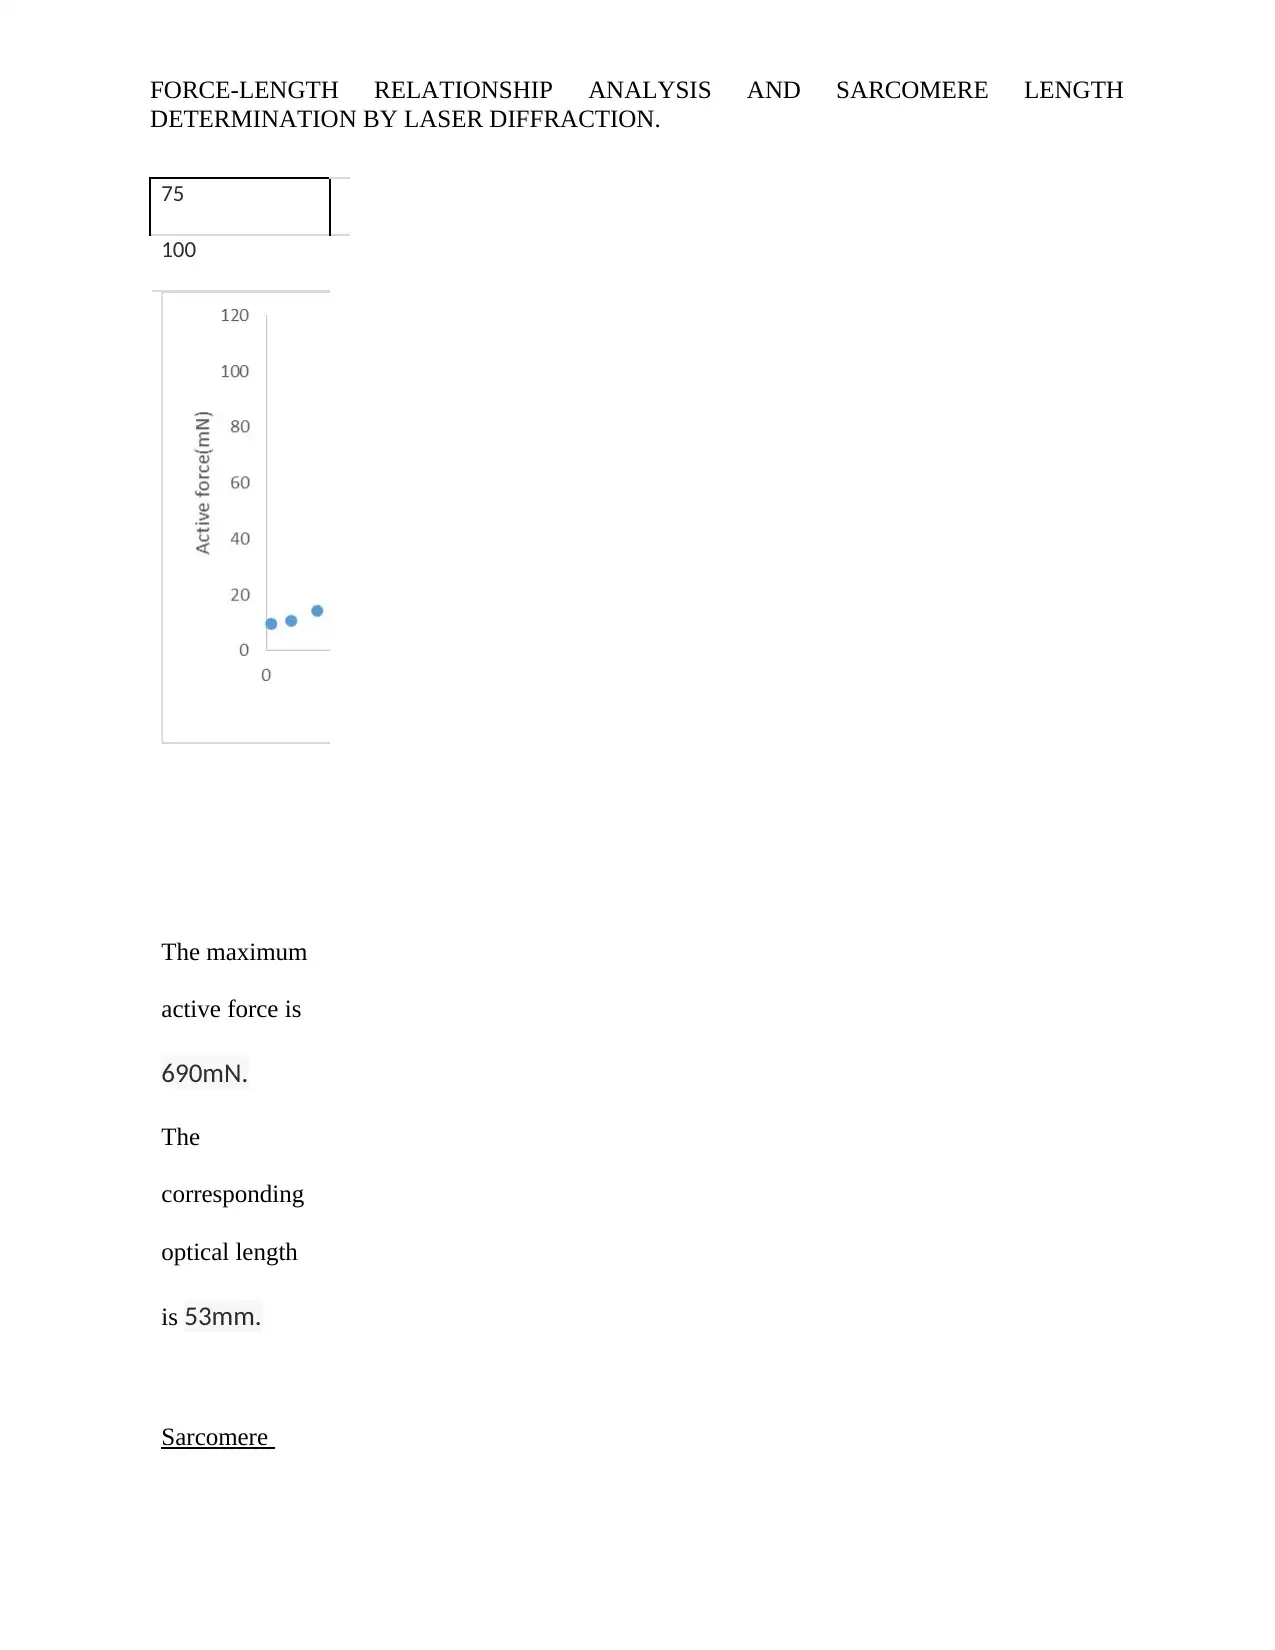
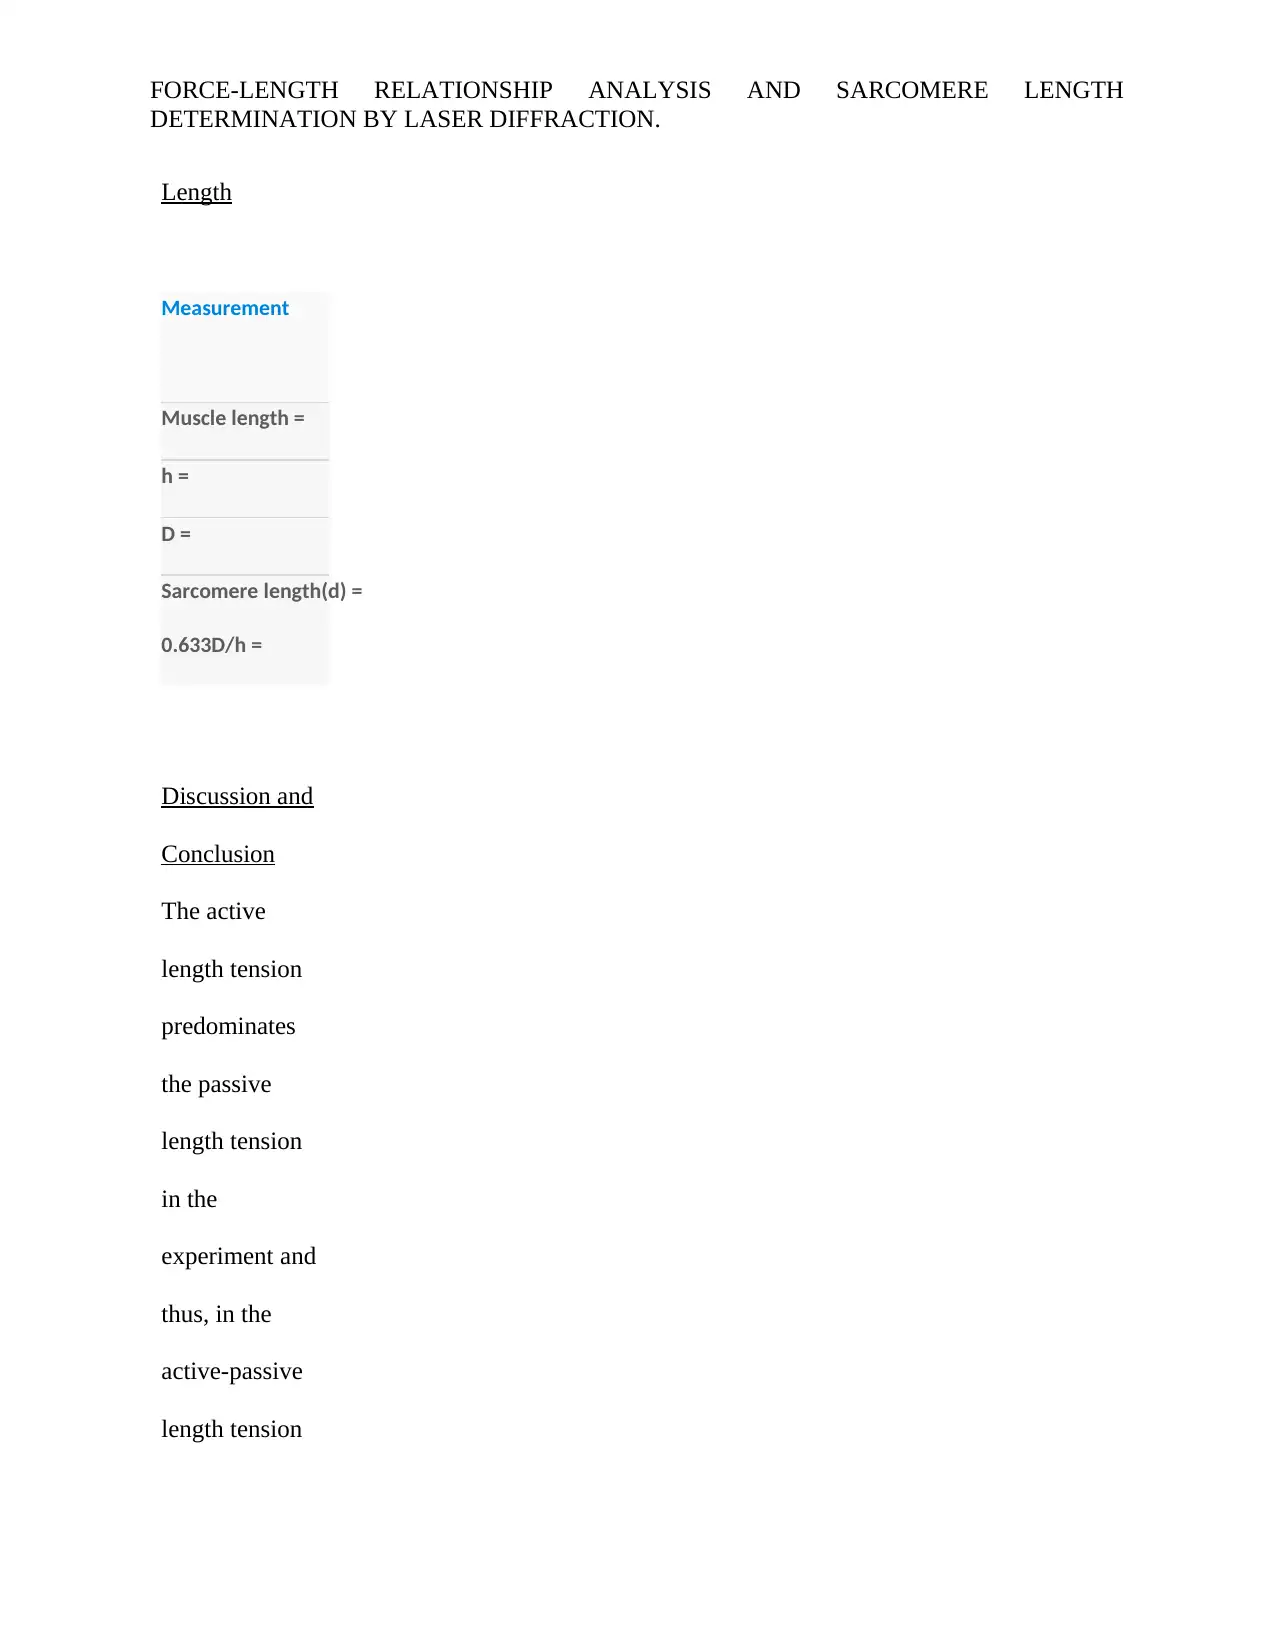
This report details an experiment exploring the force-length relationship in skeletal muscle, examining both active and passive length-tension relationships, and determining sarcomere length using laser diffraction. The experiment involved measuring passive and active forces generated by skeletal muscle, plotting the relationships between these forces and muscle length, and discussing the underlying reasons for observed behaviors. The active length-tension graph illustrates the interplay between actin and myosin filaments, while the passive length-tension graph highlights the role of elastic fibers like titin. Sarcomere length was calculated via laser diffraction, and the results were compared with theoretical values, with deviations attributed to potential experimental errors. The report concludes that the experiment successfully demonstrated the force-length relationship, with the active length tension predominating over the passive, and identifies actin and myosin as key proteins responsible for the observed force-length dynamics. Desklib offers a wealth of similar solved assignments and past papers to aid students in their studies.
Document Page
FORCE-LENGTH RELATIONSHIP ANALYSIS AND SARCOMERE LENGTH
DETERMINATION BY LASER DIFFRACTION.
Abstract.
The experiment describes the force-length relationship: active and passive length-tensions. In
addition, it determines the sarcomere length through laser diffraction technique. The active
length tension graph that describes the muscle characteristics is developed. The graph consists of
an ascending limb that indicates a rapid increase in sarcomere length as a result of the action of
actin and myosin filament overlap that reduces the potential for strength expression (Anon, n.d).
It also consists of a plateau where there is no change in force with the increasing length since
there is no cross bridge being formed by the filaments. Lastly, the descending limb in the active
length-tension graph is as a result of a decrease in overlap between the actin and myosin
filaments, therefore making it possible for the sarcomere to decrease with an increase in length.
The passive length-tension on the other hand also has a graph that has two characteristics
depending on whether the optimal length is reached or not. Below the optimal length, the muscle
is extended and very little passive force is exerted. Above the optimum length, the force exerted
by the passive structures within the sarcomere increases very rapidly (Anon, n.d). This passive
force is as a result of titin action in the sarcomere and also because of elastic structures like
connective tissues.
tabler-icon-diamond-filled.svg

Paraphrase This Document

Need a fresh take? Get an instant paraphrase of this document with our AI Paraphraser
Document Page
FORCE-LENGTH RELATIONSHIP ANALYSIS AND SARCOMERE LENGTH
DETERMINATION BY LASER DIFFRACTION.
Introduction
The skeletal muscle is a highly compartmentalized organ of the body, composed of single fibres
that are embedded in a matrix of collagen (University of California, 2000). At the end of the
muscle belly, the matrix becomes the tendon that connects the muscle to the bone (University of
California, 2000). Each of the cell is enclosed by a cell membrane, they also contain
mitochondria for the oxidative metabolism of nutrients and lastly they contain organelles that
help them in protein synthesis. Actin and myosin molecules in the muscle are the main molecules
that generate the length-tension. They are arranged in interdigitating matrices that are capable of
sliding across each other (University of California, 2000). The force is created when the myosin
filaments form cross bridges with the actin filament, and slightly rotate in order to pull the
filaments across each other. This isometric force exerted by the muscle is dependent on the
length when tested and hence it forms the length tension relationship that consists of the active
length tension and passive length tension relationships. According to (University of California,
1984), the active length tension relationship is thought to occur as a result of the degree of
overlap between actin and myosin filaments within a sarcomere. Too much overlap can however
lead to the development of sub-optimal tension. The passive length tension relationship reflects
the presence of elastic fibres within the sarcomere that stretch in order to produce a force with an
increasing length. The muscle moves to longer lengths in eccentric contractions compared to
concentric concentrations and because of the superior rapid force development in concentric
contractions.
According to (University of Sydney, 2018), “Within the sarcomere the thick and thin filaments
are arranged in parallel and are also in longitudinal register such that the structure of the
Document Page
FORCE-LENGTH RELATIONSHIP ANALYSIS AND SARCOMERE LENGTH
DETERMINATION BY LASER DIFFRACTION.
sarcomere forms bands: A and I bands. The different optical properties of these bands mean that
when a laser beam of appropriate wavelength is shone onto a prepared sample a diffraction
pattern can be projected onto a screen.” The muscle diffraction is simplified by considering the
diffraction order position and intensity to be the result of grating and Bragg diffraction (Yeh
et.al, 1980).
https://syd1.kuracloud.com/i/7c51d22c/student/courses/151/runs/69188/preview/page/15
Document Page
FORCE-LENGTH RELATIONSHIP ANALYSIS AND SARCOMERE LENGTH
DETERMINATION BY LASER DIFFRACTION.
The objectives of the experiment are to measure the passive force and active force generated by
the skeletal muscle and plot graphs showing the relationships between the forces and muscle
length. The reason behind this behavior is also to be discussed in the experiment. The students
were also to measure the sarcomere length through laser diffraction and compare the calculated
value with the sarcomere length in books. Also, they were to describe the proteins that were
involved in describing sarcomere length.
The prediction from the experiment was that as the muscle length increases, the active force also
increases until a maximum force is generated after which it then decreases. The passive force
prediction was that it would increase relative to muscle length.
Method
Force-Length Relationship Analysis.
The muscle was moistened and checked whether it was in contact with the stimulating electrodes
holder. The muscle length was then determined after which the maximum stimulus voltage was
applied. Passive force and the total force were measured and recorded. The active force was
thereafter calculated and the results were recorded.
Determination of Sarcomere Length
The muscle was detached from the transducer and placed onto a microscope slide. The length
was then set to optimal length. Thereafter, two drops of Ringer`s reagent was applied on the
muscle and a coverslip was then placed onto the muscle. This assembly was placed in front of
the laser to allow for light to pass through the sample. The diffraction patterns were displayed on
tabler-icon-diamond-filled.svg

Paraphrase This Document

Need a fresh take? Get an instant paraphrase of this document with our AI Paraphraser
Document Page
FORCE-LENGTH RELATIONSHIP ANALYSIS AND SARCOMERE LENGTH
DETERMINATION BY LASER DIFFRACTION.
the screen and the distance from the muscle to the screen, and fringe spacing were measured and
recorded.
Results
The Relationship between Active and Passive Length-Tensions.
Length
(mm)
Passive
Force
(mN)
Total
Force
(mN)
Active
Force
(mN)
31 1.72 106.11 104.39
33 4.84 189.84 185
35 5.85 305.39 299.54
37 7.5 406.4 398.9
39 8.84 502.83 493.99
41 11.24 555.45 544.21
43 15.04 606.42 591.38
45 18.21 651.68 633.47
50 51.56 739.8 688.24
53 88.49 778.62 690
55 134.28 734.3 600.02
57 200.58 762.46 561.88
Document Page
FORCE-LENGTH RELATIONSHIP ANALYSIS AND SARCOMERE LENGTH
DETERMINATION BY LASER DIFFRACTION.
Active Length-Tension Graph
Frequency (Hz)
1
5
10
20
40
50
Document Page
FORCE-LENGTH RELATIONSHIP ANALYSIS AND SARCOMERE LENGTH
DETERMINATION BY LASER DIFFRACTION.
75
100
The maximum
active force is
690mN.
The
corresponding
optical length
is 53mm.
Sarcomere
tabler-icon-diamond-filled.svg

Paraphrase This Document

Need a fresh take? Get an instant paraphrase of this document with our AI Paraphraser
Document Page
FORCE-LENGTH RELATIONSHIP ANALYSIS AND SARCOMERE LENGTH
DETERMINATION BY LASER DIFFRACTION.
Length
Measurement
Muscle length =
h =
D =
Sarcomere length(d) =
0.633D/h =
Discussion and
Conclusion
The active
length tension
predominates
the passive
length tension
in the
experiment and
thus, in the
active-passive
length tension
Document Page
FORCE-LENGTH RELATIONSHIP ANALYSIS AND SARCOMERE LENGTH
DETERMINATION BY LASER DIFFRACTION.
graph, the
graph rises as a
result of a rapid
increase in
sarcomere
length due to
the actin and
myosin
filaments
overlap which
is an
occurrence in
active length
tension. The
graph
thereafter
plateaus since
cross bridges
are not being
formed at this
point. The
graph
thereafter
Document Page
FORCE-LENGTH RELATIONSHIP ANALYSIS AND SARCOMERE LENGTH
DETERMINATION BY LASER DIFFRACTION.
descends as a
result of actin
and myosin
overlap
decrease. This
is the expected
relationship
since from the
experiment the
active length
tension
overshadows
the passive
length tension
and hence, its
relationship is
more
predominant.
Hence, in this
section of the
experiment,
very little
errors are
tabler-icon-diamond-filled.svg

Paraphrase This Document

Need a fresh take? Get an instant paraphrase of this document with our AI Paraphraser
Document Page
FORCE-LENGTH RELATIONSHIP ANALYSIS AND SARCOMERE LENGTH
DETERMINATION BY LASER DIFFRACTION.
present. The
active graph
also shows this
relation as it
follows the
same principle.
The passive
and active
forces were
measured and
the values
obtained were
used in
calibrating
their graphs in
the experiment.
The actin and
myosin
proteins were
found to be the
proteins
responsible for
the force-
Document Page
FORCE-LENGTH RELATIONSHIP ANALYSIS AND SARCOMERE LENGTH
DETERMINATION BY LASER DIFFRACTION.
length
relationship in
skeletal
muscles. Also
the sarcomere
length was
calculated and
found out to be
3.17 mm. This
was a deviation
from the
theoretical
value of 2.2mm
(University of
Bristol, 1998).
The deviation
could be
attributed to
experimental
errors while
determining the
length
especially
Document Page
FORCE-LENGTH RELATIONSHIP ANALYSIS AND SARCOMERE LENGTH
DETERMINATION BY LASER DIFFRACTION.
during
measuring the
fringe spacing
and distance
from the
muscle to the
screen.
Nevertheless,
all the
objectives were
achieved and
hence, the
experiment was
a success.
tabler-icon-diamond-filled.svg

Paraphrase This Document

Need a fresh take? Get an instant paraphrase of this document with our AI Paraphraser
Document Page
FORCE-LENGTH RELATIONSHIP ANALYSIS AND SARCOMERE LENGTH
DETERMINATION BY LASER DIFFRACTION.
References
University of
California
(2000) Skeletal
Muscle
Structure.
Muscle
Physiology.
[Online].
Available
from:
http://muscle.u
csd.edu/musint
Document Page
FORCE-LENGTH RELATIONSHIP ANALYSIS AND SARCOMERE LENGTH
DETERMINATION BY LASER DIFFRACTION.
ro/struct.shtml
[Retrieved 1
June, 2018].
Anon. (n.d)
Length Tension
Relationship.
[Online].
Available
from:
https://www.str
engthandcondit
ioningresearch.
com/biomecha
nics/length-
tension-
relationship/
[Retrieved 1
June, 2018].
University of
Sydney (2018)
Skeletal
Muscle
Practical.
Document Page
FORCE-LENGTH RELATIONSHIP ANALYSIS AND SARCOMERE LENGTH
DETERMINATION BY LASER DIFFRACTION.
[Online].
Available
from:
https://syd1.kur
acloud.com/i/7
c51d22c/studen
t/courses/151/r
uns/69188/
preview/page/
15 [Retrieved 1
June, 2018].
University of
Bristol (1998)
The Sarcomere
Length Tension
Relation.
[Online].
Available
from:
http://www.bris
tol.ac.uk/phys-
pharm-neuro/m
edia/plangton/u
tabler-icon-diamond-filled.svg

Paraphrase This Document

Need a fresh take? Get an instant paraphrase of this document with our AI Paraphraser
Document Page
FORCE-LENGTH RELATIONSHIP ANALYSIS AND SARCOMERE LENGTH
DETERMINATION BY LASER DIFFRACTION.
gteach/ugindex
/m1_index/
nm_tension/
page2.htm
[Retrieved 1
June, 2018].
Yeh, Y.,
Baskin, R.,
Lieber, L. and
Roos, K.
(1980) Theory
of Light
Diffraction by
Single Skeletal
Muscle Fibers.
Biophysiology
Journal, 295,
pp 509-522.
University of
California
(1984)
Sarcomere
Length
Document Page
FORCE-LENGTH RELATIONSHIP ANALYSIS AND SARCOMERE LENGTH
DETERMINATION BY LASER DIFFRACTION.
Determination
by Laser
Diffraction:
Effect of Beam
and Fiber
Diameter.
[Online].
Available
from:
http://muscle.u
csd.edu/More_
HTML/papers/
pdf/Lieber_BJ_
1984.pdf
[Retrieved 1
June, 2018].
chevron_up_icon
1 out of 18
circle_padding
hide_on_mobile
zoom_out_icon
[object Object]