Finance Report: Saturn Group Global Investment Analysis
VerifiedAdded on 2020/10/22
|14
|2921
|214
Report
AI Summary
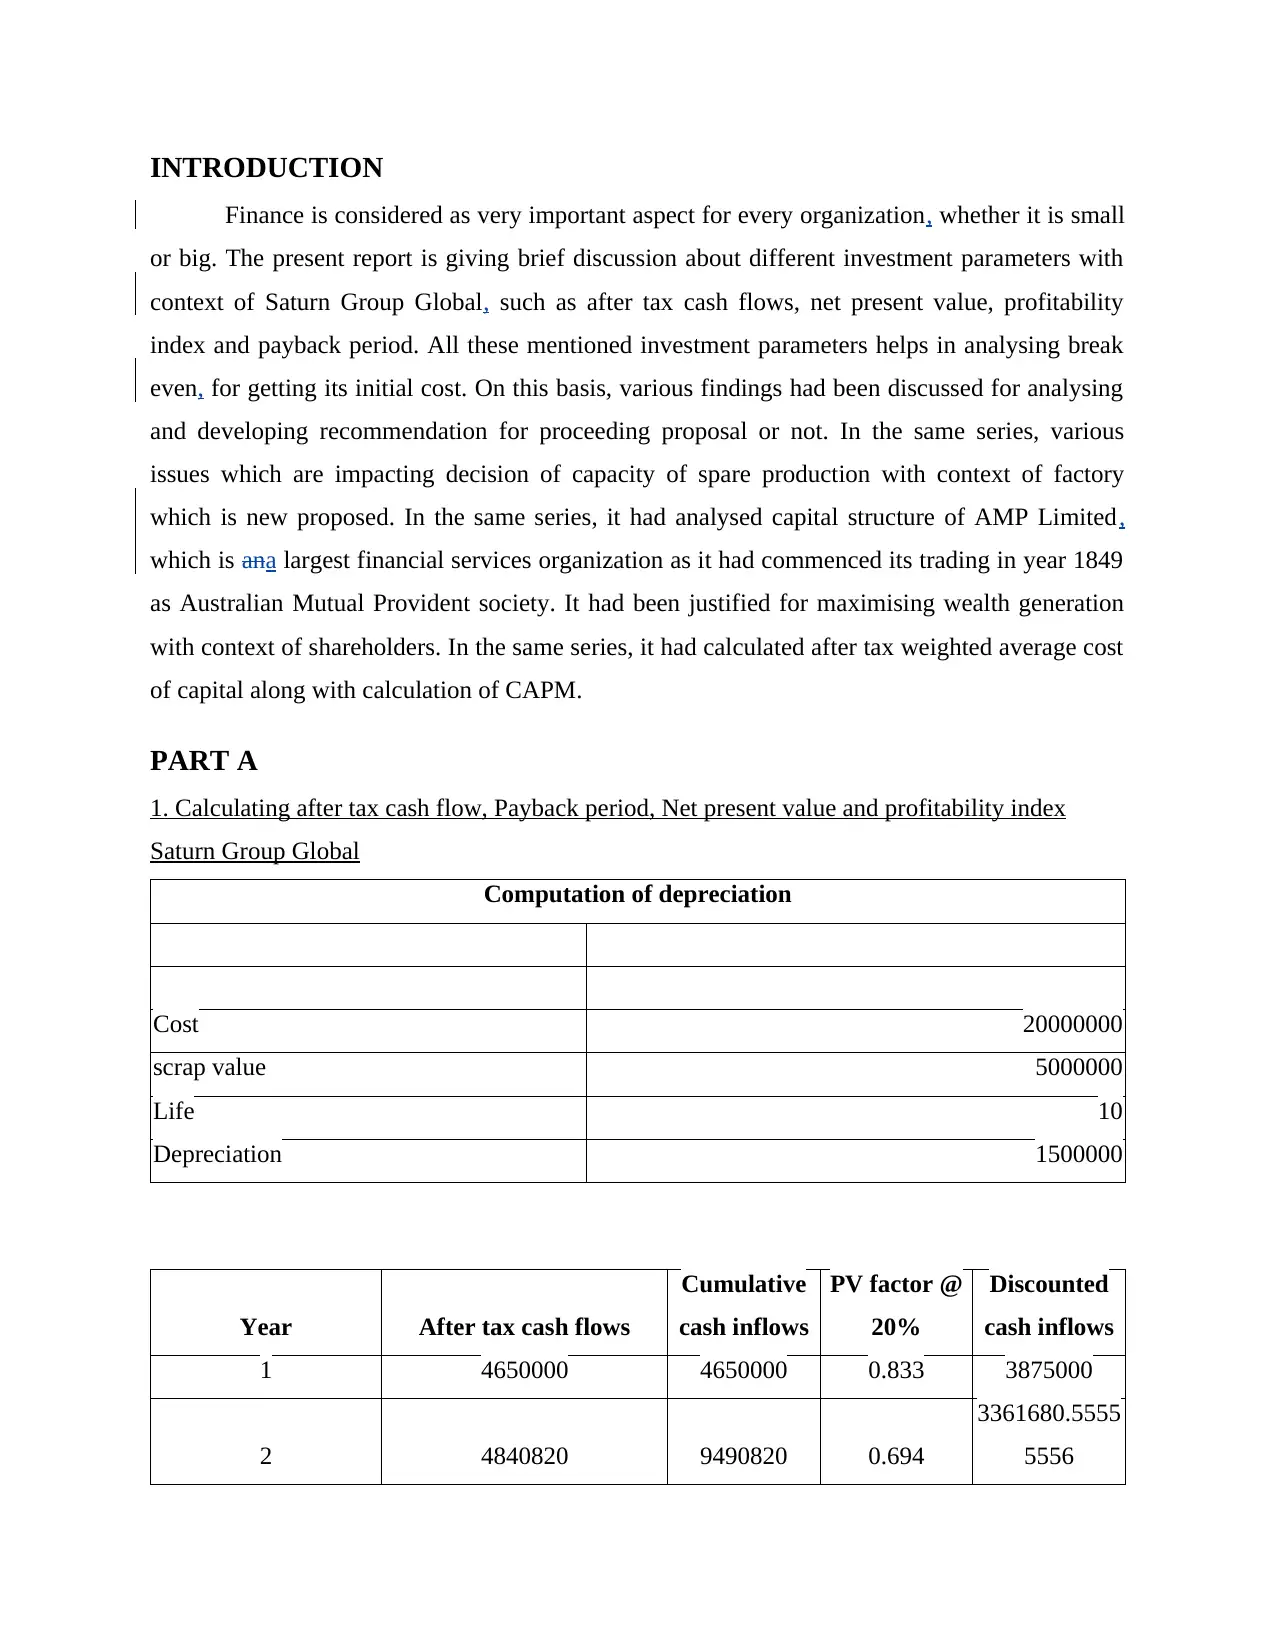
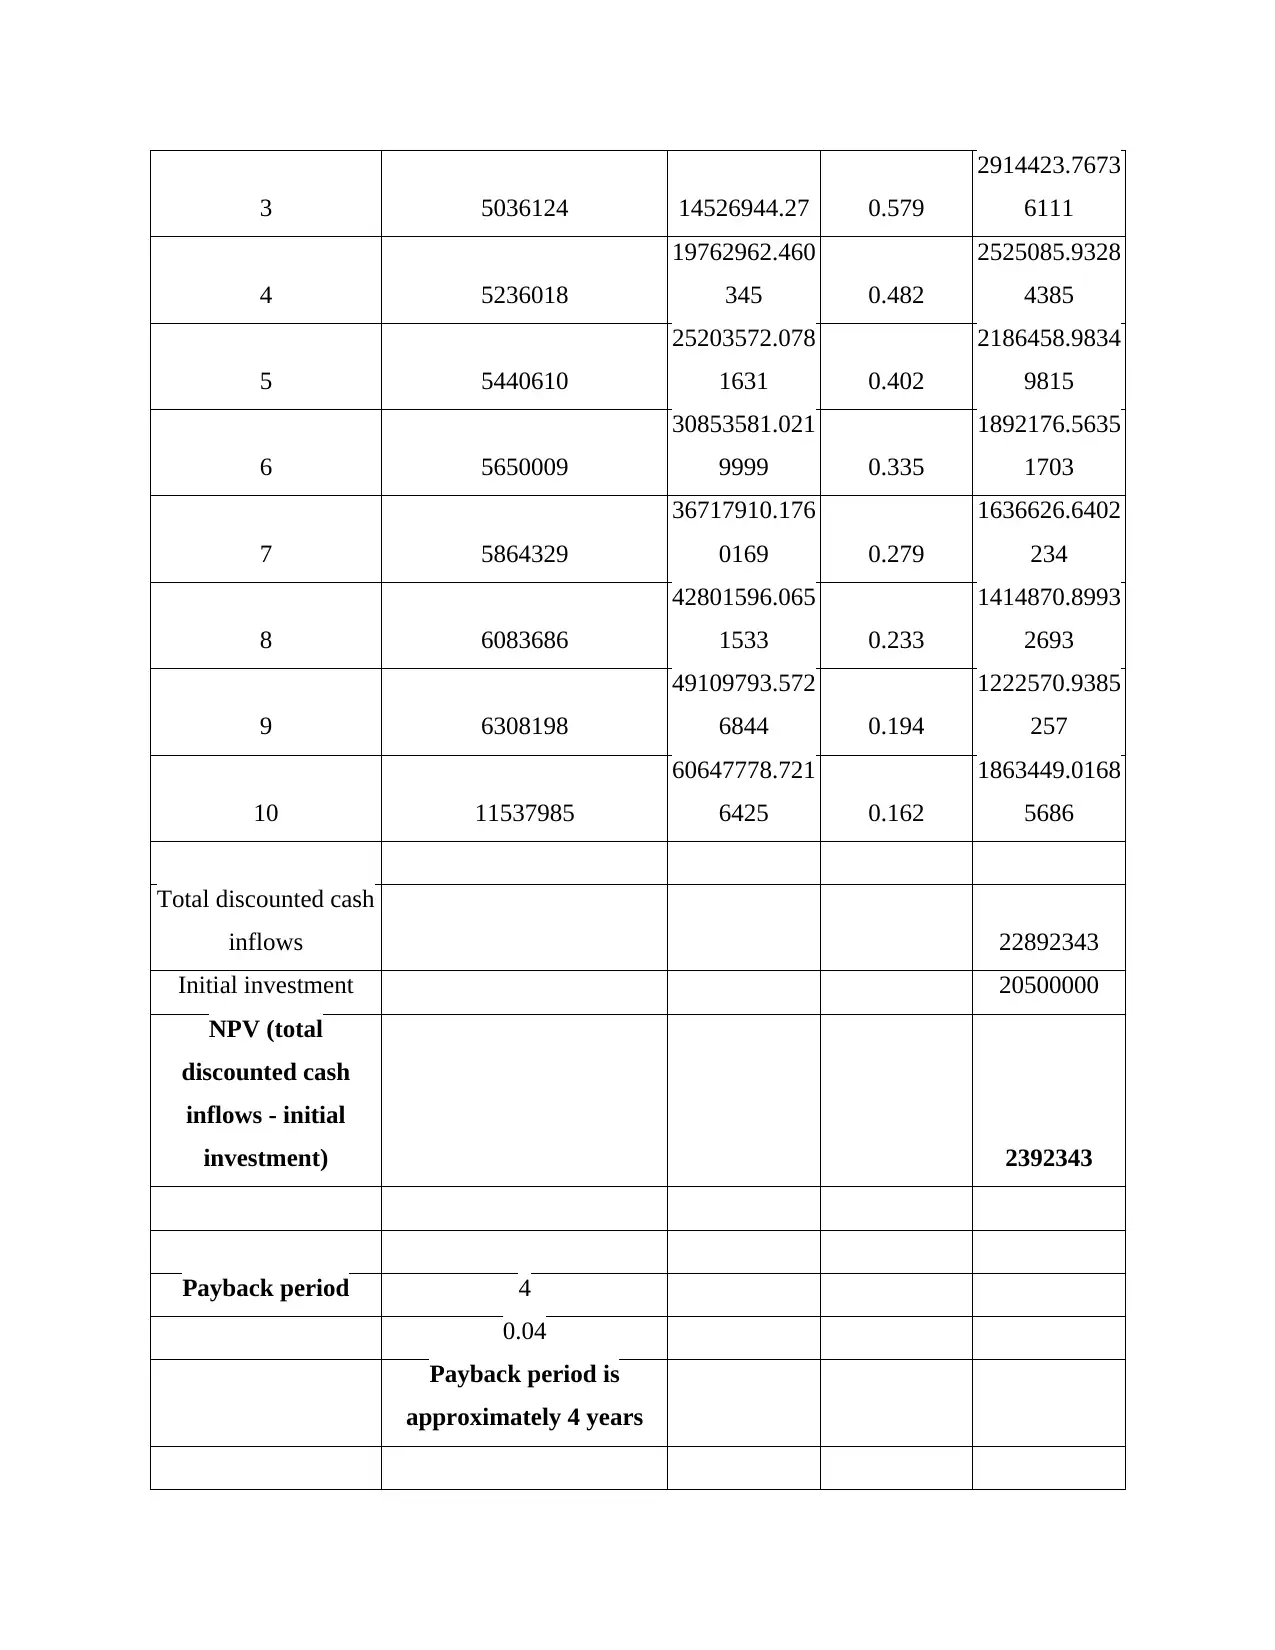
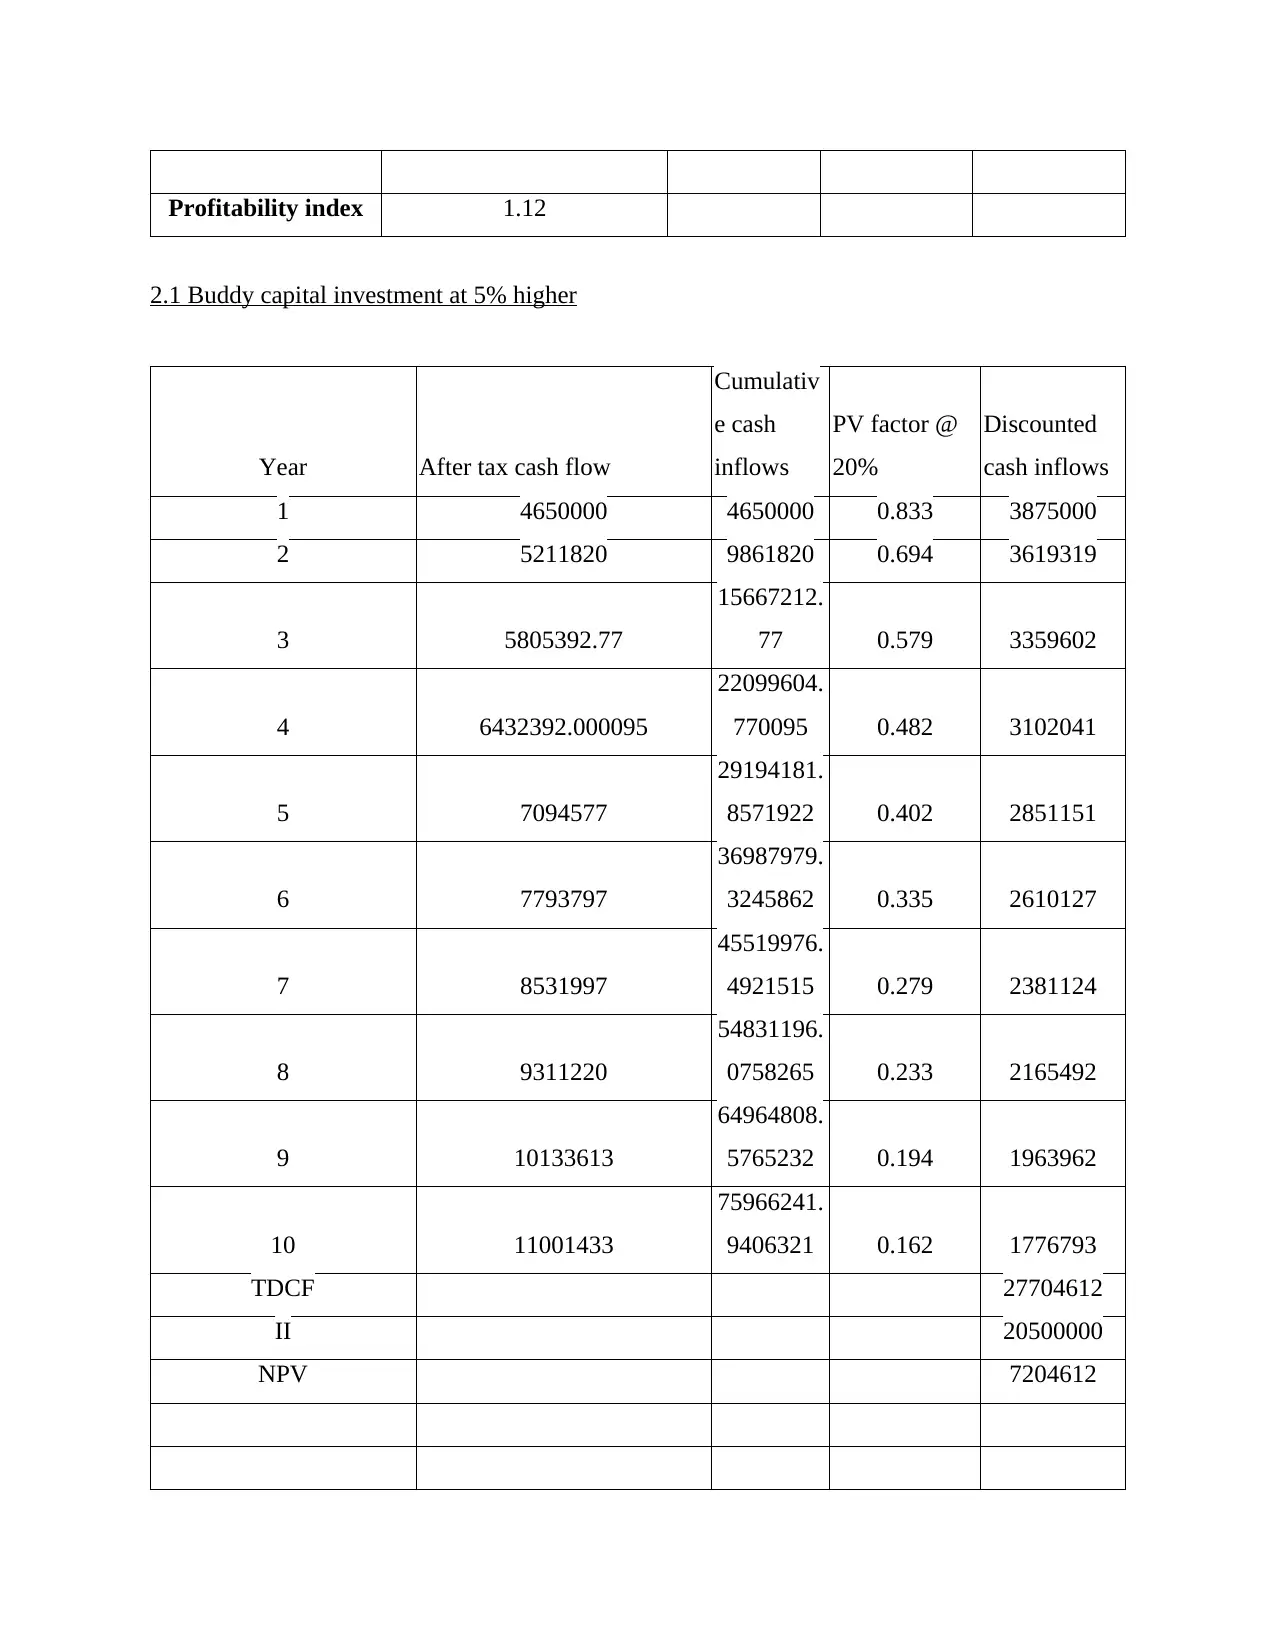
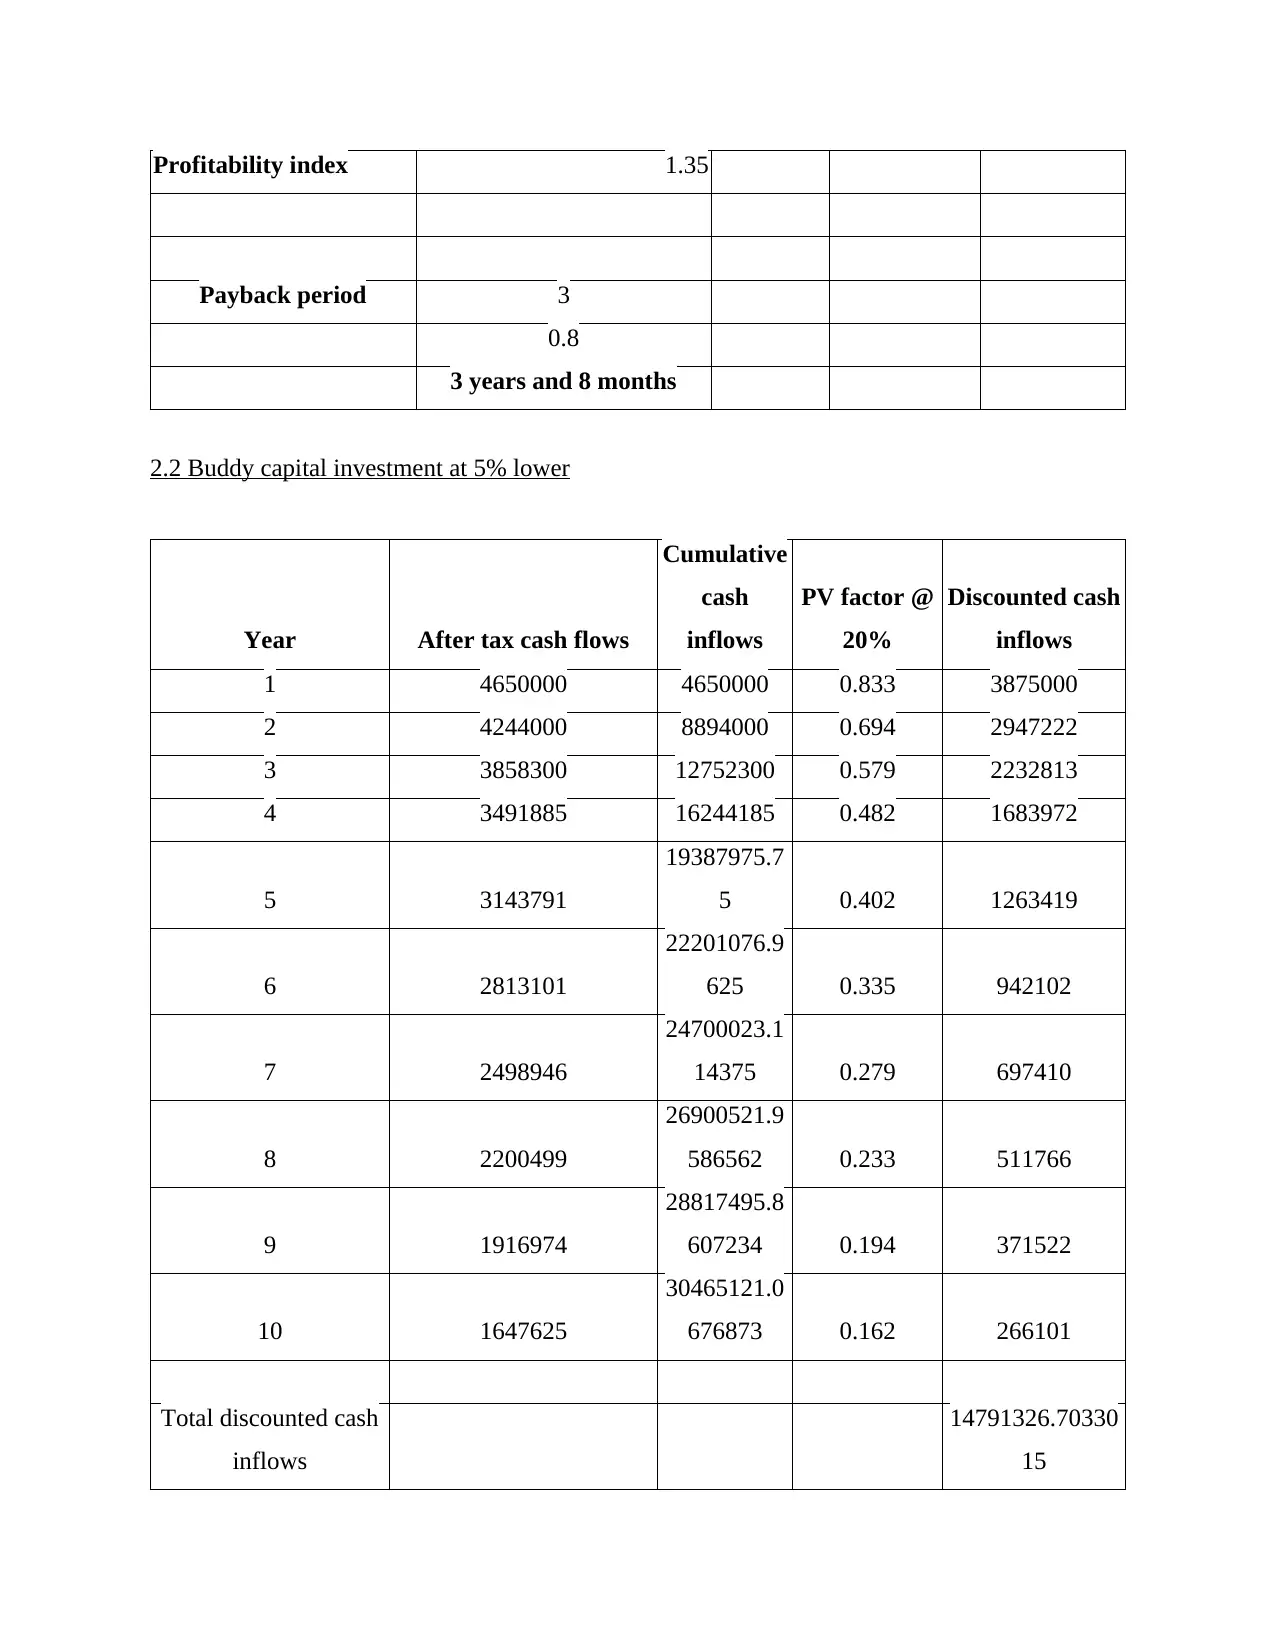
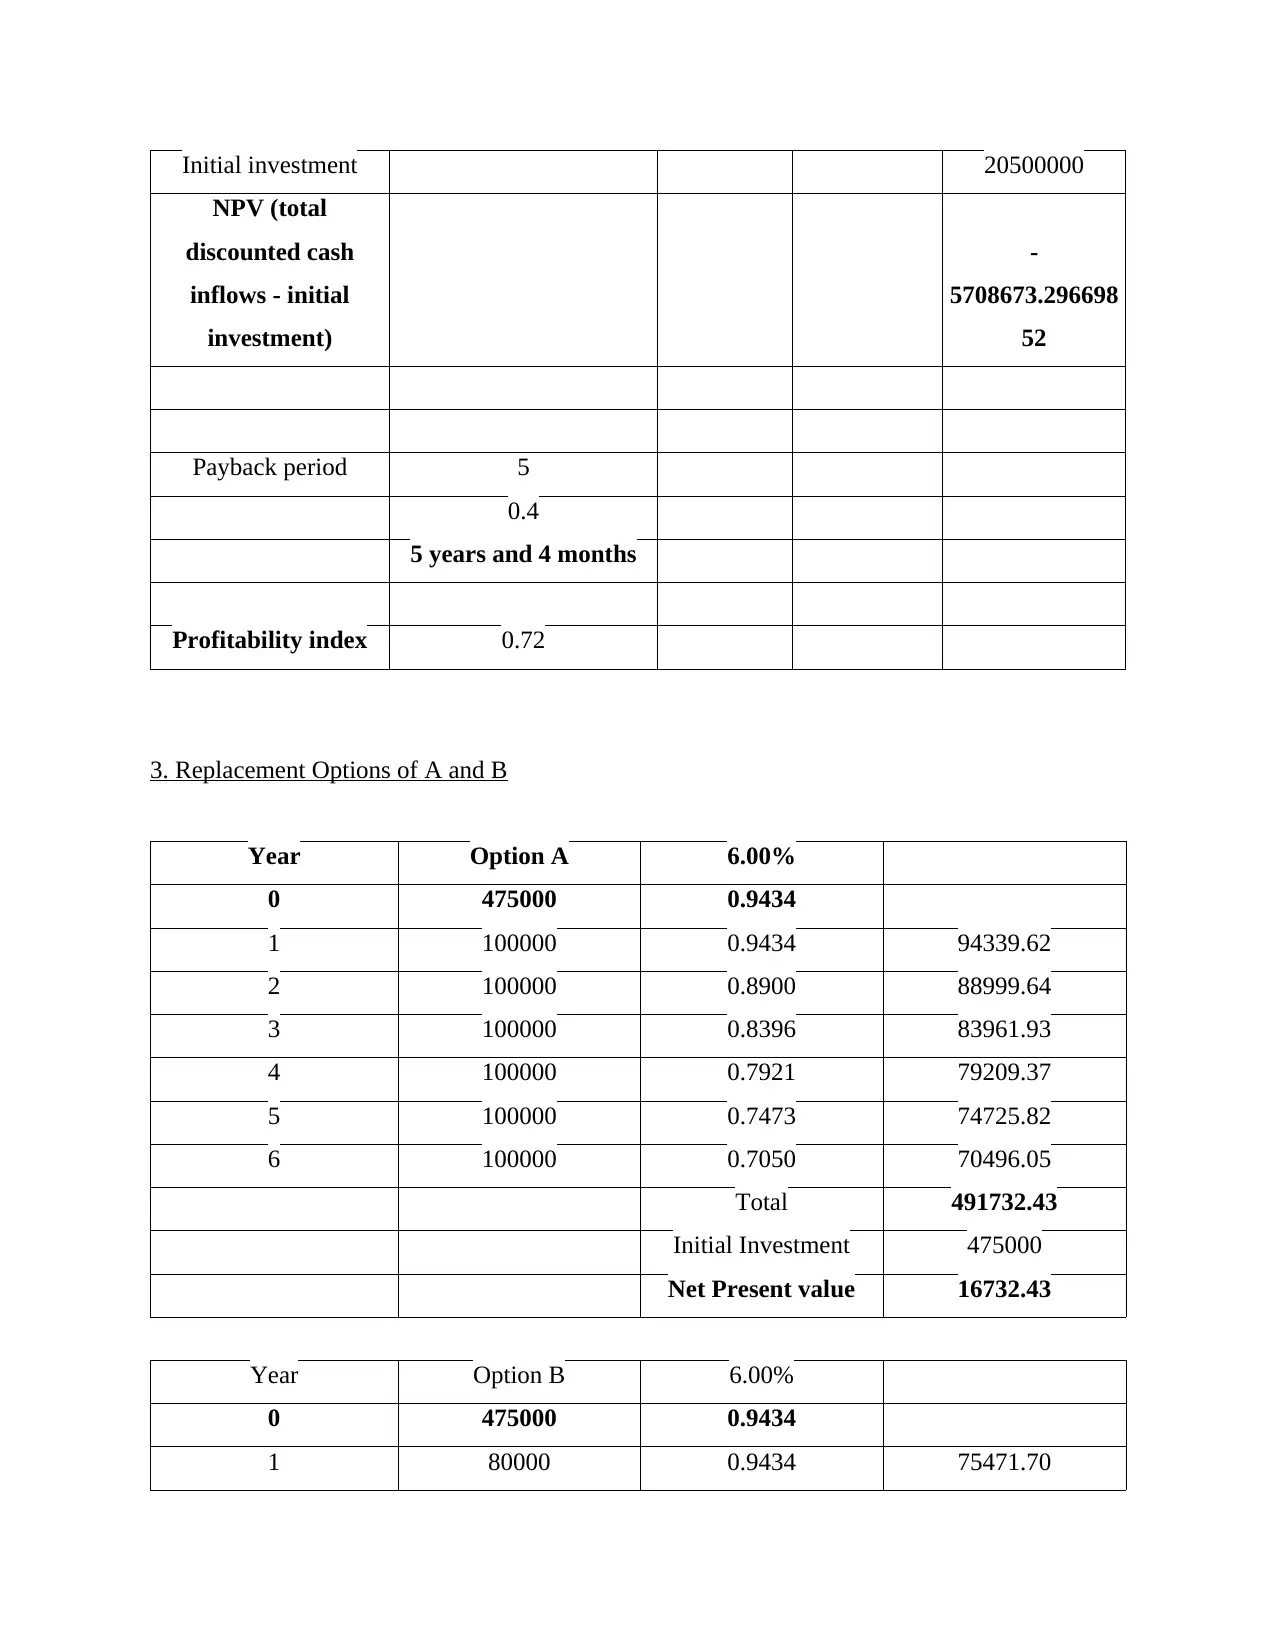
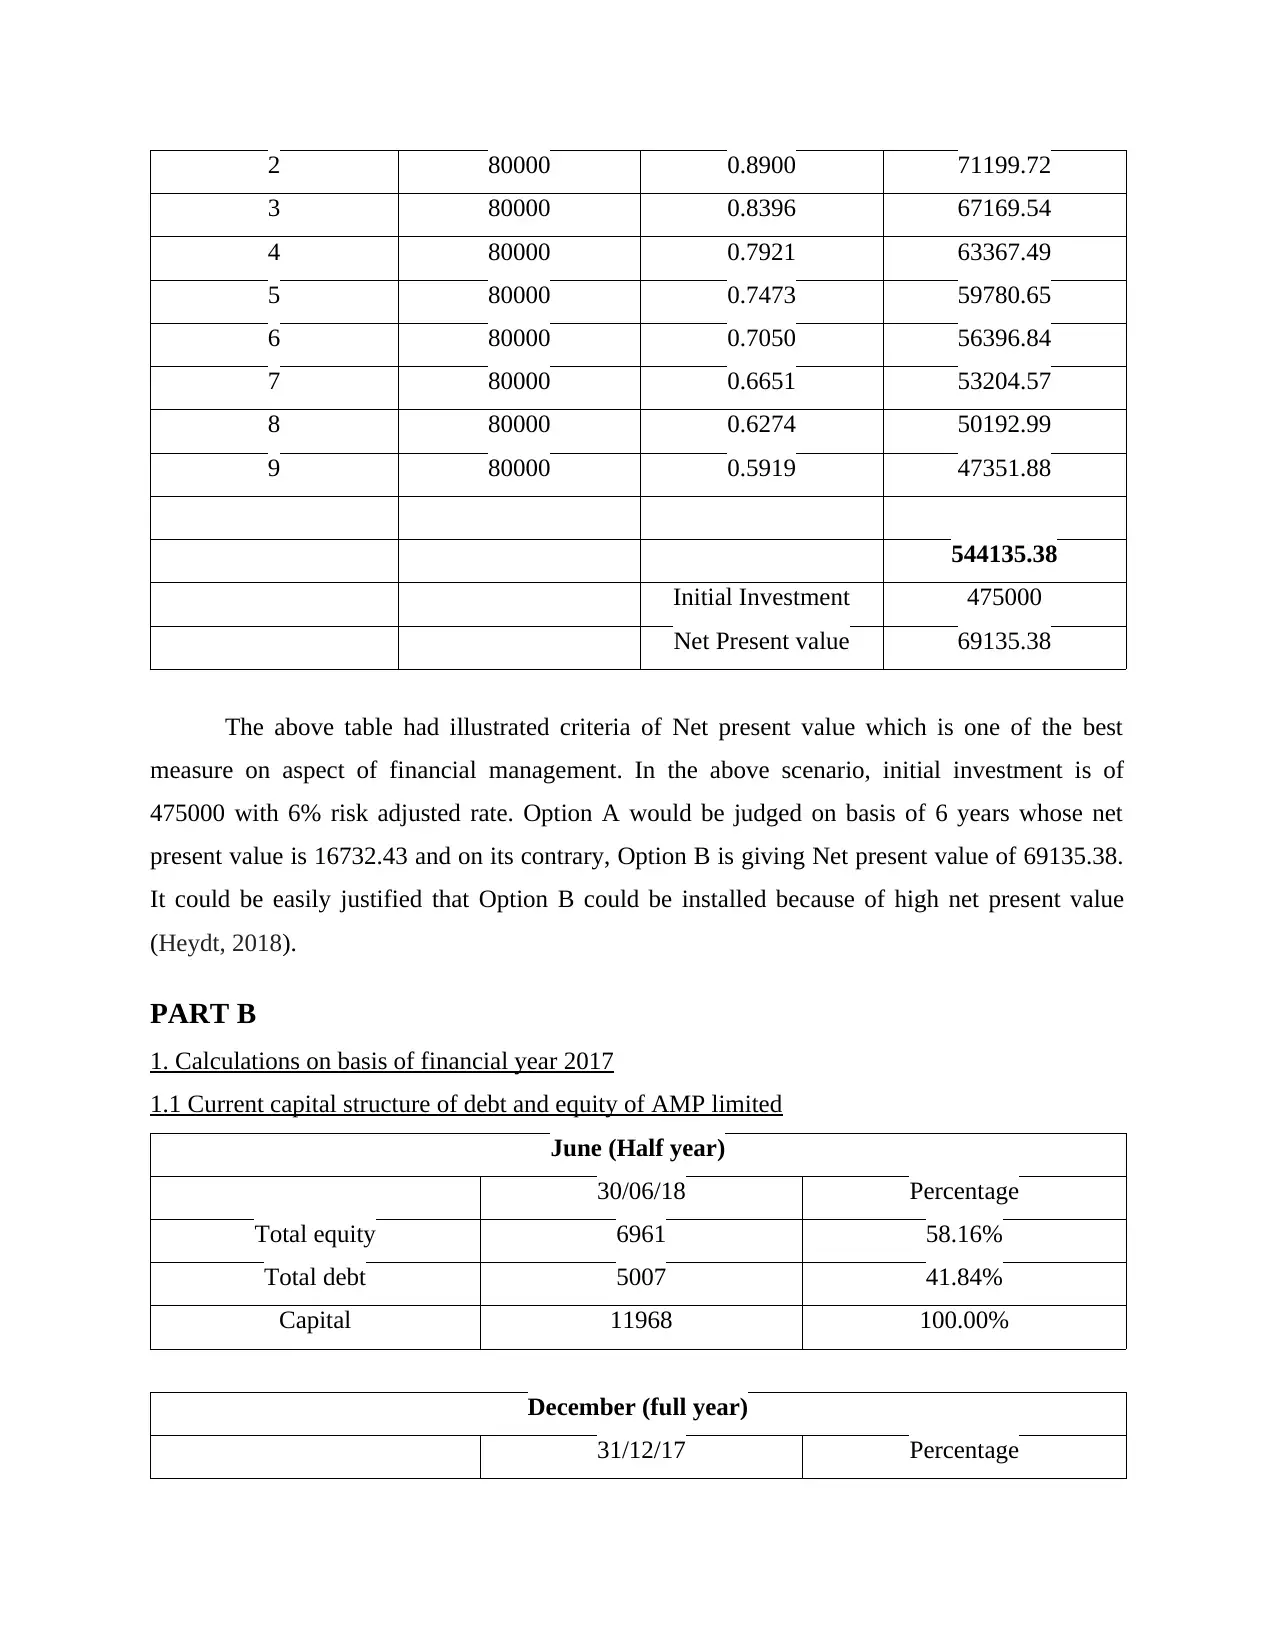
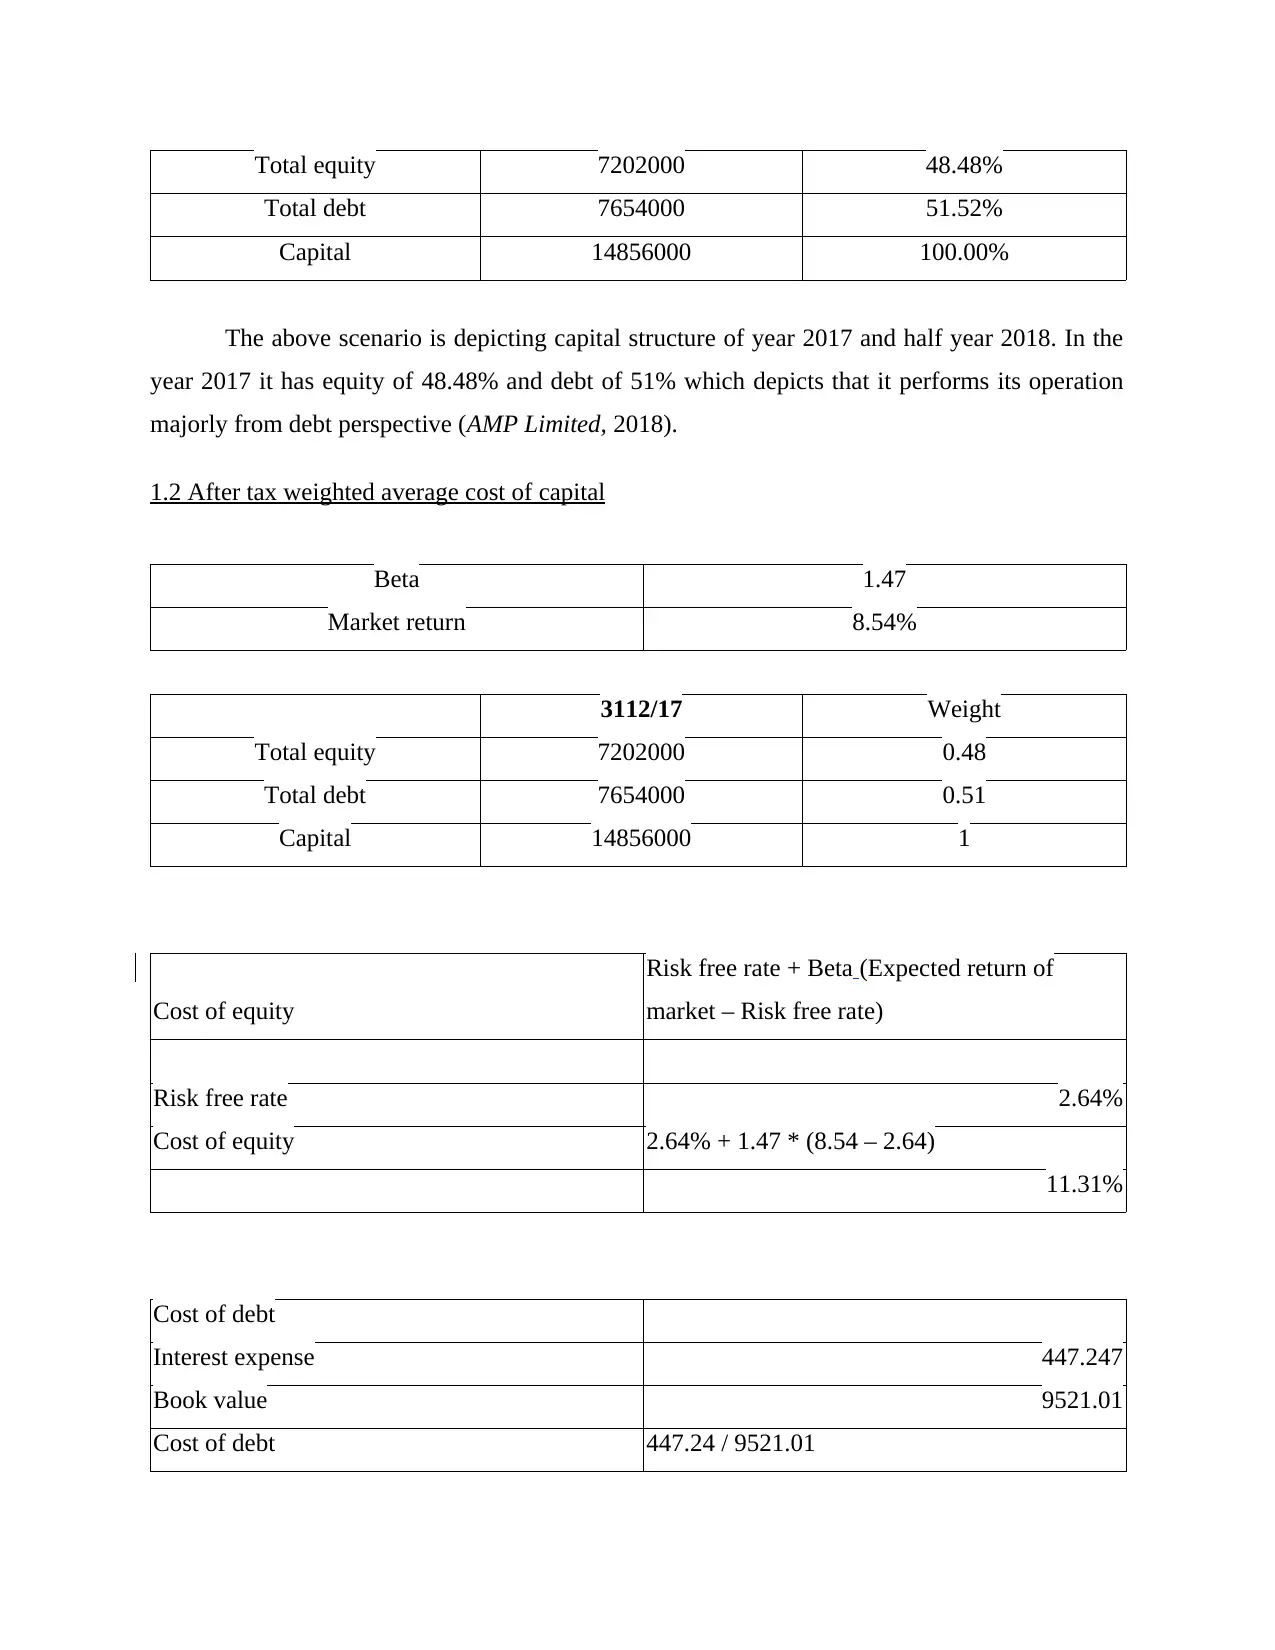
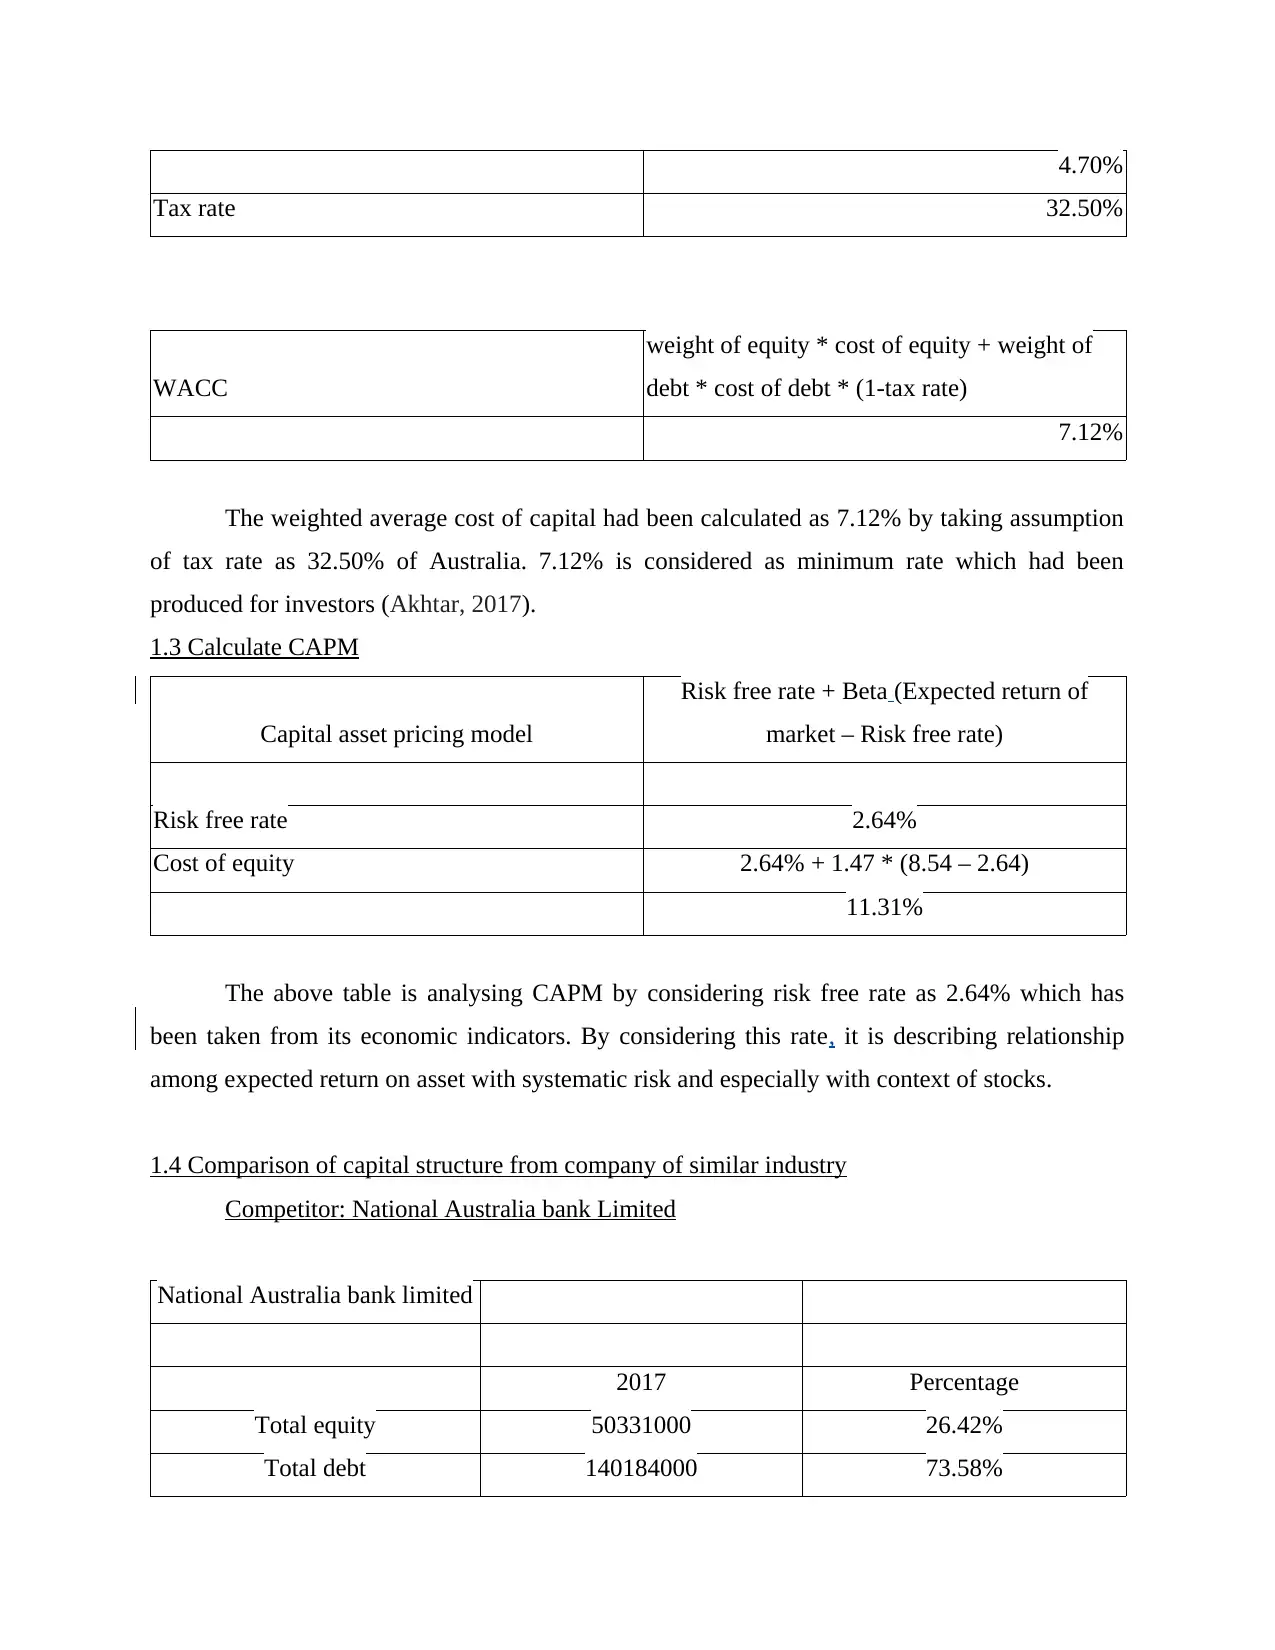
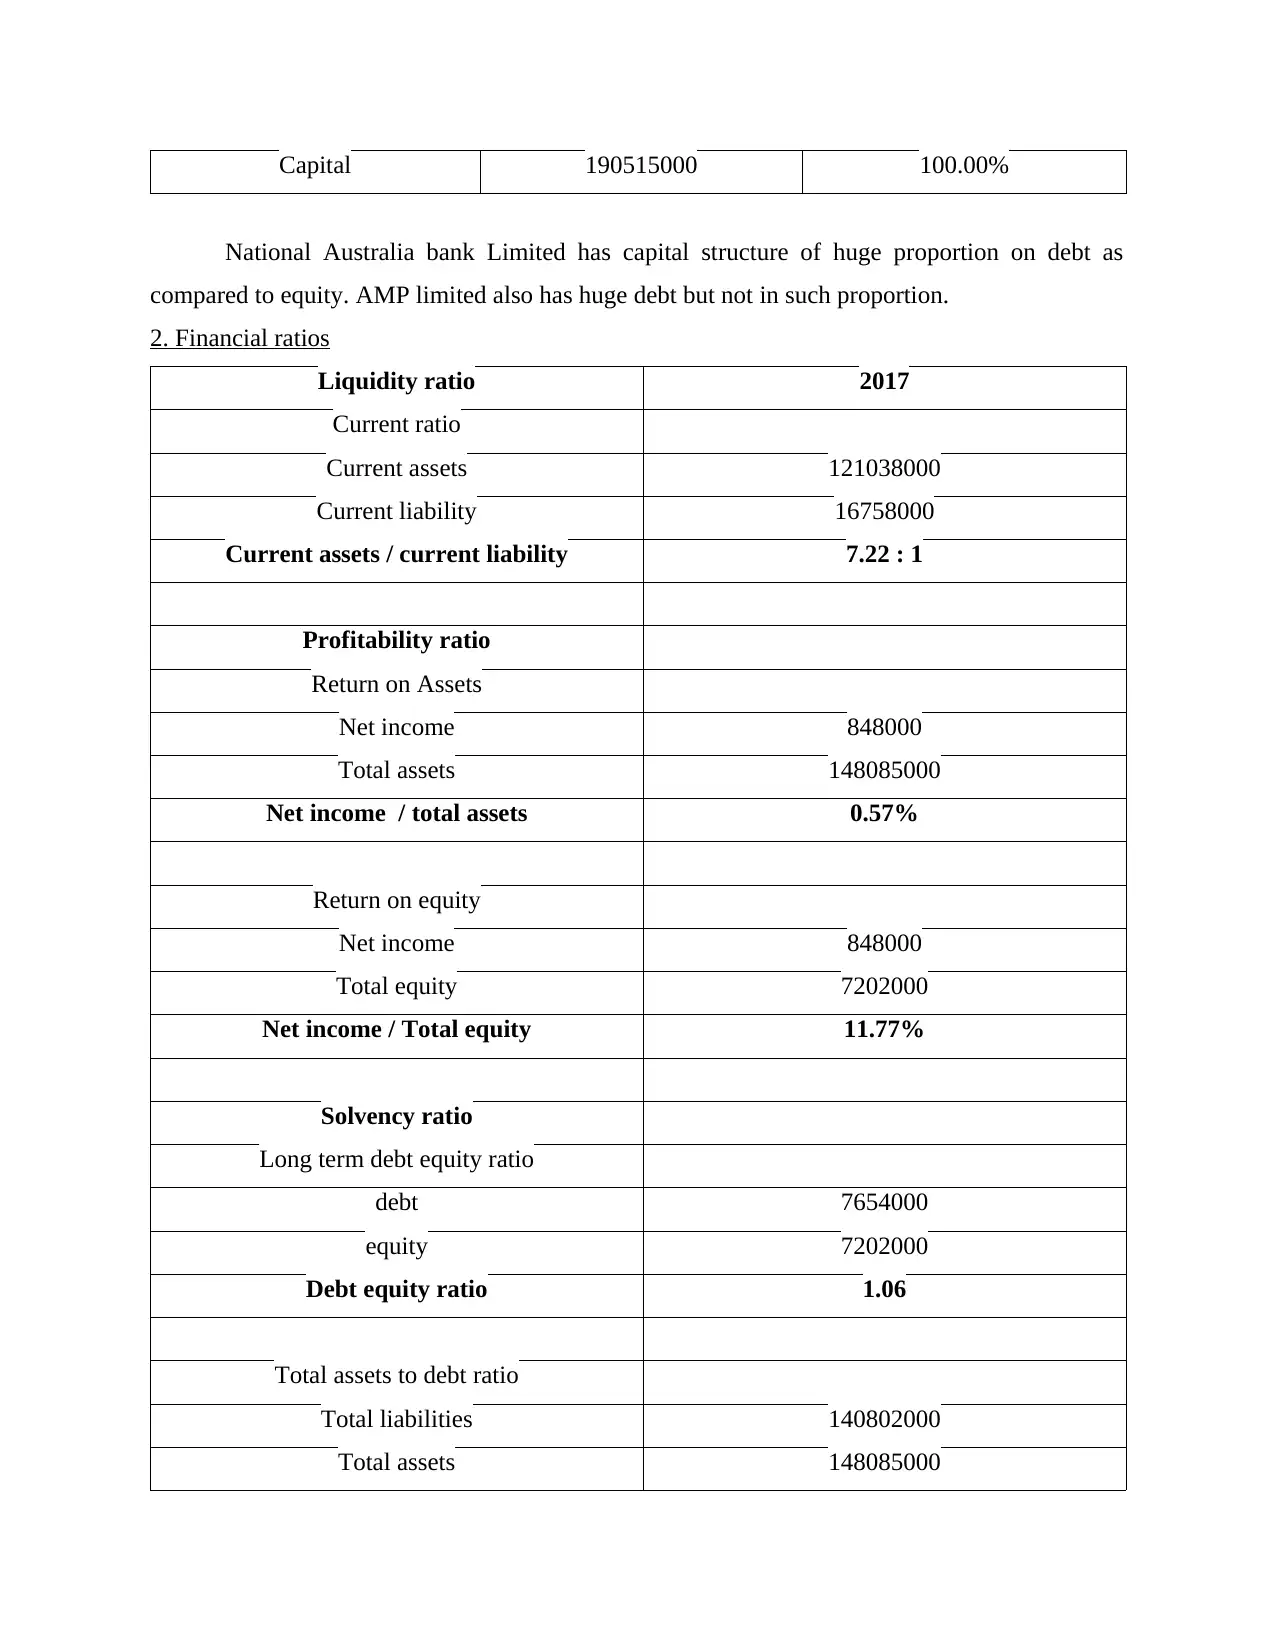
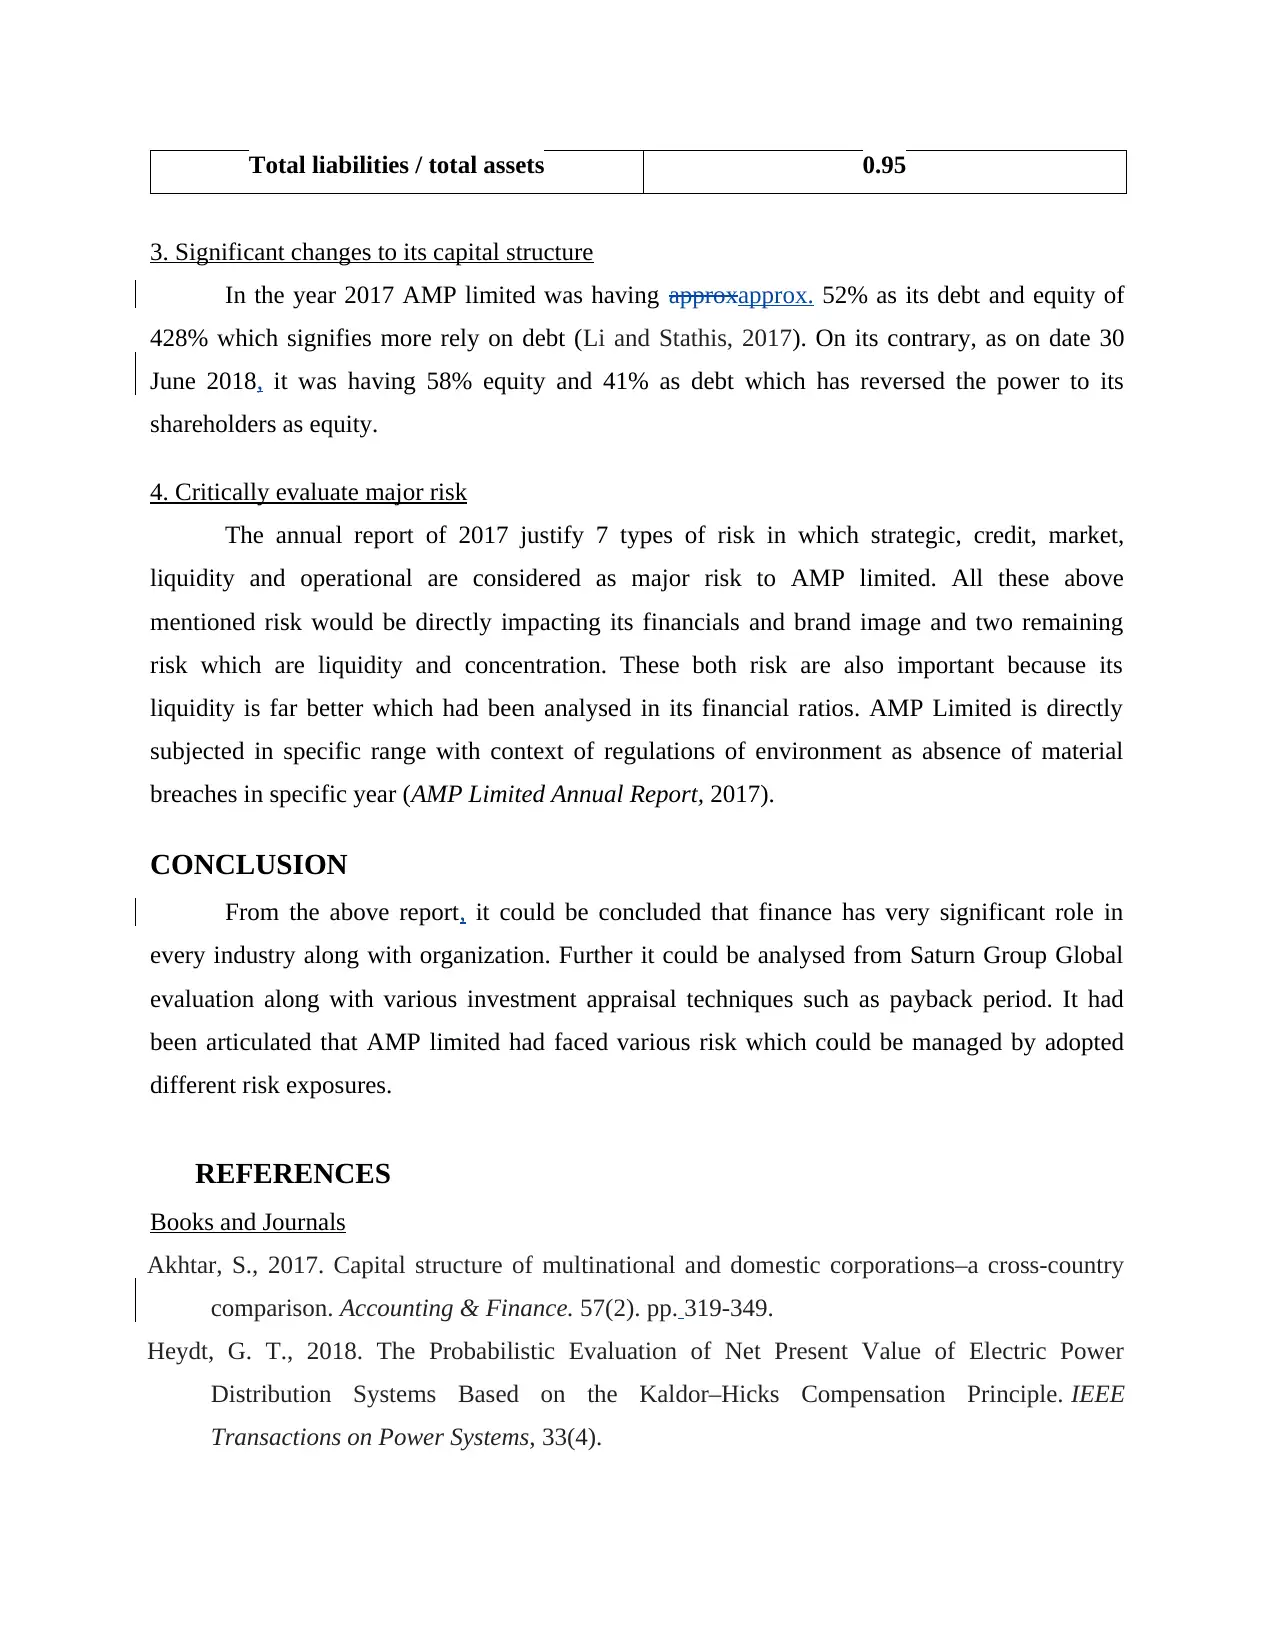
This report presents a detailed financial analysis of Saturn Group Global, examining various investment parameters such as after-tax cash flows, net present value, profitability index, and payback period to assess investment viability. The report delves into the capital structure of AMP Limited, calculating the after-tax weighted average cost of capital (WACC) and CAPM, and comparing it to industry peers. Financial ratios are computed and analyzed, along with a discussion of significant capital structure changes and major risks faced by AMP Limited. The analysis includes calculations for investment options with varying cash flows, incorporating depreciation and illustrating the impact of different investment scenarios. The report concludes with an evaluation of investment options and the importance of financial management principles. It provides insights into financial decision-making, risk management, and the impact of financial metrics on investment choices.
Contribute Materials
Your contribution can guide someone’s learning journey. Share your
documents today.

FINANCE
Secure Best Marks with AI Grader
Need help grading? Try our AI Grader for instant feedback on your assignments.

TABLE OF CONTENTS
INTRODUCTION...........................................................................................................................3
PART A...........................................................................................................................................3
1. Calculating after tax cash flow, Payback period, Net present value and profitability index. .3
2.1 Buddy capital investment at 5% higher................................................................................4
2.2 Buddy capital investment at 5% lower..................................................................................5
3. Replacement Options of A and B............................................................................................6
PART B............................................................................................................................................7
1. Calculations on basis of financial year 2017...........................................................................7
1.1 Current capital structure of debt and equity of AMP limited................................................7
1.2 After tax weighted average cost of capital............................................................................8
1.3 Calculate CAPM...................................................................................................................9
1.4 Comparison of capital structure from company of similar industry.....................................9
2. Financial ratios........................................................................................................................9
3. Significant changes to its capital structure............................................................................10
4. Critically evaluate major risk................................................................................................10
CONCLUSION..............................................................................................................................10
REFERENCES.............................................................................................................................11
APPENDIX....................................................................................................................................12
1. Income statement..................................................................................................................12
2.1 5% higher (Income statement)............................................................................................13
2.2 5% lower (Income statement).............................................................................................14

INTRODUCTION
Finance is considered as very important aspect for every organization, whether it is small
or big. The present report is giving brief discussion about different investment parameters with
context of Saturn Group Global, such as after tax cash flows, net present value, profitability
index and payback period. All these mentioned investment parameters helps in analysing break
even, for getting its initial cost. On this basis, various findings had been discussed for analysing
and developing recommendation for proceeding proposal or not. In the same series, various
issues which are impacting decision of capacity of spare production with context of factory
which is new proposed. In the same series, it had analysed capital structure of AMP Limited,
which is ana largest financial services organization as it had commenced its trading in year 1849
as Australian Mutual Provident society. It had been justified for maximising wealth generation
with context of shareholders. In the same series, it had calculated after tax weighted average cost
of capital along with calculation of CAPM.
PART A
1. Calculating after tax cash flow, Payback period, Net present value and profitability index
Saturn Group Global
Computation of depreciation
Cost 20000000
scrap value 5000000
Life 10
Depreciation 1500000
Year After tax cash flows
Cumulative
cash inflows
PV factor @
20%
Discounted
cash inflows
1 4650000 4650000 0.833 3875000
2 4840820 9490820 0.694
3361680.5555
5556

3 5036124 14526944.27 0.579
2914423.7673
6111
4 5236018
19762962.460
345 0.482
2525085.9328
4385
5 5440610
25203572.078
1631 0.402
2186458.9834
9815
6 5650009
30853581.021
9999 0.335
1892176.5635
1703
7 5864329
36717910.176
0169 0.279
1636626.6402
234
8 6083686
42801596.065
1533 0.233
1414870.8993
2693
9 6308198
49109793.572
6844 0.194
1222570.9385
257
10 11537985
60647778.721
6425 0.162
1863449.0168
5686
Total discounted cash
inflows 22892343
Initial investment 20500000
NPV (total
discounted cash
inflows - initial
investment) 2392343
Payback period 4
0.04
Payback period is
approximately 4 years
Secure Best Marks with AI Grader
Need help grading? Try our AI Grader for instant feedback on your assignments.

Profitability index 1.12
2.1 Buddy capital investment at 5% higher
Year After tax cash flow
Cumulativ
e cash
inflows
PV factor @
20%
Discounted
cash inflows
1 4650000 4650000 0.833 3875000
2 5211820 9861820 0.694 3619319
3 5805392.77
15667212.
77 0.579 3359602
4 6432392.000095
22099604.
770095 0.482 3102041
5 7094577
29194181.
8571922 0.402 2851151
6 7793797
36987979.
3245862 0.335 2610127
7 8531997
45519976.
4921515 0.279 2381124
8 9311220
54831196.
0758265 0.233 2165492
9 10133613
64964808.
5765232 0.194 1963962
10 11001433
75966241.
9406321 0.162 1776793
TDCF 27704612
II 20500000
NPV 7204612

Profitability index 1.35
Payback period 3
0.8
3 years and 8 months
2.2 Buddy capital investment at 5% lower
Year After tax cash flows
Cumulative
cash
inflows
PV factor @
20%
Discounted cash
inflows
1 4650000 4650000 0.833 3875000
2 4244000 8894000 0.694 2947222
3 3858300 12752300 0.579 2232813
4 3491885 16244185 0.482 1683972
5 3143791
19387975.7
5 0.402 1263419
6 2813101
22201076.9
625 0.335 942102
7 2498946
24700023.1
14375 0.279 697410
8 2200499
26900521.9
586562 0.233 511766
9 1916974
28817495.8
607234 0.194 371522
10 1647625
30465121.0
676873 0.162 266101
Total discounted cash
inflows
14791326.70330
15

Initial investment 20500000
NPV (total
discounted cash
inflows - initial
investment)
-
5708673.296698
52
Payback period 5
0.4
5 years and 4 months
Profitability index 0.72
3. Replacement Options of A and B
Year Option A 6.00%
0 475000 0.9434
1 100000 0.9434 94339.62
2 100000 0.8900 88999.64
3 100000 0.8396 83961.93
4 100000 0.7921 79209.37
5 100000 0.7473 74725.82
6 100000 0.7050 70496.05
Total 491732.43
Initial Investment 475000
Net Present value 16732.43
Year Option B 6.00%
0 475000 0.9434
1 80000 0.9434 75471.70
Paraphrase This Document
Need a fresh take? Get an instant paraphrase of this document with our AI Paraphraser

2 80000 0.8900 71199.72
3 80000 0.8396 67169.54
4 80000 0.7921 63367.49
5 80000 0.7473 59780.65
6 80000 0.7050 56396.84
7 80000 0.6651 53204.57
8 80000 0.6274 50192.99
9 80000 0.5919 47351.88
544135.38
Initial Investment 475000
Net Present value 69135.38
The above table had illustrated criteria of Net present value which is one of the best
measure on aspect of financial management. In the above scenario, initial investment is of
475000 with 6% risk adjusted rate. Option A would be judged on basis of 6 years whose net
present value is 16732.43 and on its contrary, Option B is giving Net present value of 69135.38.
It could be easily justified that Option B could be installed because of high net present value
(Heydt, 2018).
PART B
1. Calculations on basis of financial year 2017
1.1 Current capital structure of debt and equity of AMP limited
June (Half year)
30/06/18 Percentage
Total equity 6961 58.16%
Total debt 5007 41.84%
Capital 11968 100.00%
December (full year)
31/12/17 Percentage

Total equity 7202000 48.48%
Total debt 7654000 51.52%
Capital 14856000 100.00%
The above scenario is depicting capital structure of year 2017 and half year 2018. In the
year 2017 it has equity of 48.48% and debt of 51% which depicts that it performs its operation
majorly from debt perspective (AMP Limited, 2018).
1.2 After tax weighted average cost of capital
Beta 1.47
Market return 8.54%
3112/17 Weight
Total equity 7202000 0.48
Total debt 7654000 0.51
Capital 14856000 1
Cost of equity
Risk free rate + Beta (Expected return of
market – Risk free rate)
Risk free rate 2.64%
Cost of equity 2.64% + 1.47 * (8.54 – 2.64)
11.31%
Cost of debt
Interest expense 447.247
Book value 9521.01
Cost of debt 447.24 / 9521.01

4.70%
Tax rate 32.50%
WACC
weight of equity * cost of equity + weight of
debt * cost of debt * (1-tax rate)
7.12%
The weighted average cost of capital had been calculated as 7.12% by taking assumption
of tax rate as 32.50% of Australia. 7.12% is considered as minimum rate which had been
produced for investors (Akhtar, 2017).
1.3 Calculate CAPM
Capital asset pricing model
Risk free rate + Beta (Expected return of
market – Risk free rate)
Risk free rate 2.64%
Cost of equity 2.64% + 1.47 * (8.54 – 2.64)
11.31%
The above table is analysing CAPM by considering risk free rate as 2.64% which has
been taken from its economic indicators. By considering this rate, it is describing relationship
among expected return on asset with systematic risk and especially with context of stocks.
1.4 Comparison of capital structure from company of similar industry
Competitor: National Australia bank Limited
National Australia bank limited
2017 Percentage
Total equity 50331000 26.42%
Total debt 140184000 73.58%
Secure Best Marks with AI Grader
Need help grading? Try our AI Grader for instant feedback on your assignments.

Capital 190515000 100.00%
National Australia bank Limited has capital structure of huge proportion on debt as
compared to equity. AMP limited also has huge debt but not in such proportion.
2. Financial ratios
Liquidity ratio 2017
Current ratio
Current assets 121038000
Current liability 16758000
Current assets / current liability 7.22 : 1
Profitability ratio
Return on Assets
Net income 848000
Total assets 148085000
Net income / total assets 0.57%
Return on equity
Net income 848000
Total equity 7202000
Net income / Total equity 11.77%
Solvency ratio
Long term debt equity ratio
debt 7654000
equity 7202000
Debt equity ratio 1.06
Total assets to debt ratio
Total liabilities 140802000
Total assets 148085000

Total liabilities / total assets 0.95
3. Significant changes to its capital structure
In the year 2017 AMP limited was having approxapprox. 52% as its debt and equity of
428% which signifies more rely on debt (Li and Stathis, 2017). On its contrary, as on date 30
June 2018, it was having 58% equity and 41% as debt which has reversed the power to its
shareholders as equity.
4. Critically evaluate major risk
The annual report of 2017 justify 7 types of risk in which strategic, credit, market,
liquidity and operational are considered as major risk to AMP limited. All these above
mentioned risk would be directly impacting its financials and brand image and two remaining
risk which are liquidity and concentration. These both risk are also important because its
liquidity is far better which had been analysed in its financial ratios. AMP Limited is directly
subjected in specific range with context of regulations of environment as absence of material
breaches in specific year (AMP Limited Annual Report, 2017).
CONCLUSION
From the above report, it could be concluded that finance has very significant role in
every industry along with organization. Further it could be analysed from Saturn Group Global
evaluation along with various investment appraisal techniques such as payback period. It had
been articulated that AMP limited had faced various risk which could be managed by adopted
different risk exposures.
REFERENCES
Books and Journals
Akhtar, S., 2017. Capital structure of multinational and domestic corporations–a cross‐country
comparison. Accounting & Finance. 57(2). pp. 319-349.
Heydt, G. T., 2018. The Probabilistic Evaluation of Net Present Value of Electric Power
Distribution Systems Based on the Kaldor–Hicks Compensation Principle. IEEE
Transactions on Power Systems, 33(4).

Li, H. and Stathis, P., 2017. Determinants of capital structure in Australia: an analysis of
important factors. Managerial Finance. 43(8). pp. 881-897.
Online
AMP Limited. 2018. [Online] Available through: <https://finance.yahoo.com/quote/amp.ax?
ltr=1>
AMP Limited Annual Report. 2017. [Online] Available through:
<http://www.annualreports.com/HostedData/AnnualReports/PDF/OTC_AMLTY_2017.pd
f>
Paraphrase This Document
Need a fresh take? Get an instant paraphrase of this document with our AI Paraphraser

APPENDIX
1. Income statement
Year 1 2 3 4 5 6 7 8 9 10
Sales 20000000
20470
000
20951
045
21443
394.55
75
21947
314.32
96012
22463
076.21
63469
22990
958.50
7431
23531
246.03
23557
24084
230.31
4116
24650
209.72
64977
Selling
price per
unit 1.25 1.28 1.31 1.34 1.37 1.40 1.44 1.47 1.51 1.54
Variable
manufactu
ring cost 7000000
71645
00
73328
65.75
75051
88.095
125
76815
60.015
36044
78620
76.675
72141
80468
35.477
60086
82359
36.111
32448
84294
80.609
94061
86275
73.404
27421
Fixed
manufactu
ring cost 5600000
56000
00
56000
00
56000
00
56000
00
56000
00
56000
00
56000
00
56000
00
56000
00
Variable
manufactu
ring cost 1400000
14329
00
14665
73.15
15010
37.619
025
15363
12.003
07209
15724
15.335
14428
16093
67.095
52017
16471
87.222
2649
16858
96.121
98812
17255
14.680
85484
Total cost 14000000
14197
400
14399
438.9
14606
225.71
415
14817
872.01
84325
15034
492.01
08657
15256
202.57
3121
15483
123.33
35894
15715
376.73
19287
15953
088.08
51291
Gross
profit 6000000
62726
00
65516
06.1
68371
68.843
35
71294
42.311
16872
74285
84.205
48119
77347
55.934
30999
80481
22.698
76628
83688
53.582
18729
86971
21.641
36869
less:
depreciatio
n 1500000
15000
00
15000
00
15000
00
15000
00
15000
00
15000
00
15000
00
15000
00
15000
00
EBT 4500000
47726
00
50516
06.1
53371
68.843
35
56294
42.311
16872
59285
84.205
48119
62347
55.934
30999
65481
22.698
76628
68688
53.582
18729
71971
21.641
36869
1 out of 14
Related Documents

Your All-in-One AI-Powered Toolkit for Academic Success.
+13062052269
info@desklib.com
Available 24*7 on WhatsApp / Email
Unlock your academic potential
© 2024 | Zucol Services PVT LTD | All rights reserved.