Sayaji Hotels Ltd. Financial Performance Analysis Report (2018-2019)
VerifiedAdded on 2021/08/03
|12
|2759
|181
Report
AI Summary
This report presents a financial analysis of Sayaji Hotels Ltd., a prominent India-based hospitality company, using the 2019 annual report for comparison with 2018 data. The methodology employs ratio analysis, including liquidity (current, quick, cash), profitability (gross profit, net profit, return on asset), investor (return on investment, return on capital employed, return on equity), solvency (debt-asset, debt-equity), and activity ratios (working capital turnover, asset turnover). The analysis reveals a mixed performance: while some ratios show improvement, the company's overall financial health remains a concern, particularly regarding liquidity and profitability. The report concludes that Sayaji Hotels Ltd. has shown some financial improvement from the previous year, but has not shown drastic changes in profit or revenue. The findings highlight areas for potential improvement and strategic considerations for the company's financial management.
I. Introduction
Coming out as one of the top India-based hospitality company, Sayaji Hotels Ltd. was
assimilated in April 1982 and commenced in the year 1987 under the direction of Mr Sajid R.
Dhanani. Starting off with the first hotel in Vadodara, followed by properties in other cities
such as Indore, Pune, Bhopal, Kolhapur, Raipur and Gurugram. With more upcoming
properties in Bhopal and Zirakpur, Sayaji Hotel Ltd has four sub-brands under its name,
namely, Enrise by Sayaji, which is a full service, mid- scale and upscale resorts. Their target
market is Leisure travellers who want comfort luxury at an affordable price. Effotel by Sayaji
on the other hand is a four star and upscale business hotel. Sayaji Hotels provide full service
five star luxury experience and services. Lastly, Barbeque Nations restaurant became of the
leading casual dining chain in India is under Sayaji Hotel Ltd. With 10 hotels, 28 restaurants
and 8000+ employees, Sayaji Hotel Ltd. is emerging as a pioneer in Indian Hospitality
Brands. Sayaji Hotel Ltd. has also been awarded with The Economic Times ‘India’s Best
Companies to Work For’ in 2018 and 2019.
II. Methodology
To understand and analyse the financial feasibility of the company taken, the annual report of
Sayaji Hotel Ltd. for 2019 was taken from the official website of the company. The report
was for year ending March 2019 and year ending March 2018 that were used for horizontal
comparison analysis. The financial statements used were as follows:
1) Balance Sheet
2) Statement of Profit & Loss for the year
3) Cash Flow Statement for the year
III. Discussion and Analysis
The tool which is used for the comparison is Ratio Analysis, under which five ratios were
used, namely:
Liquidity Ratio
Profitability Ratio
Investors Ratio
Solvency Ratio
Paraphrase This Document
Need a fresh take? Get an instant paraphrase of this document with our AI Paraphraser
Activity Ratio
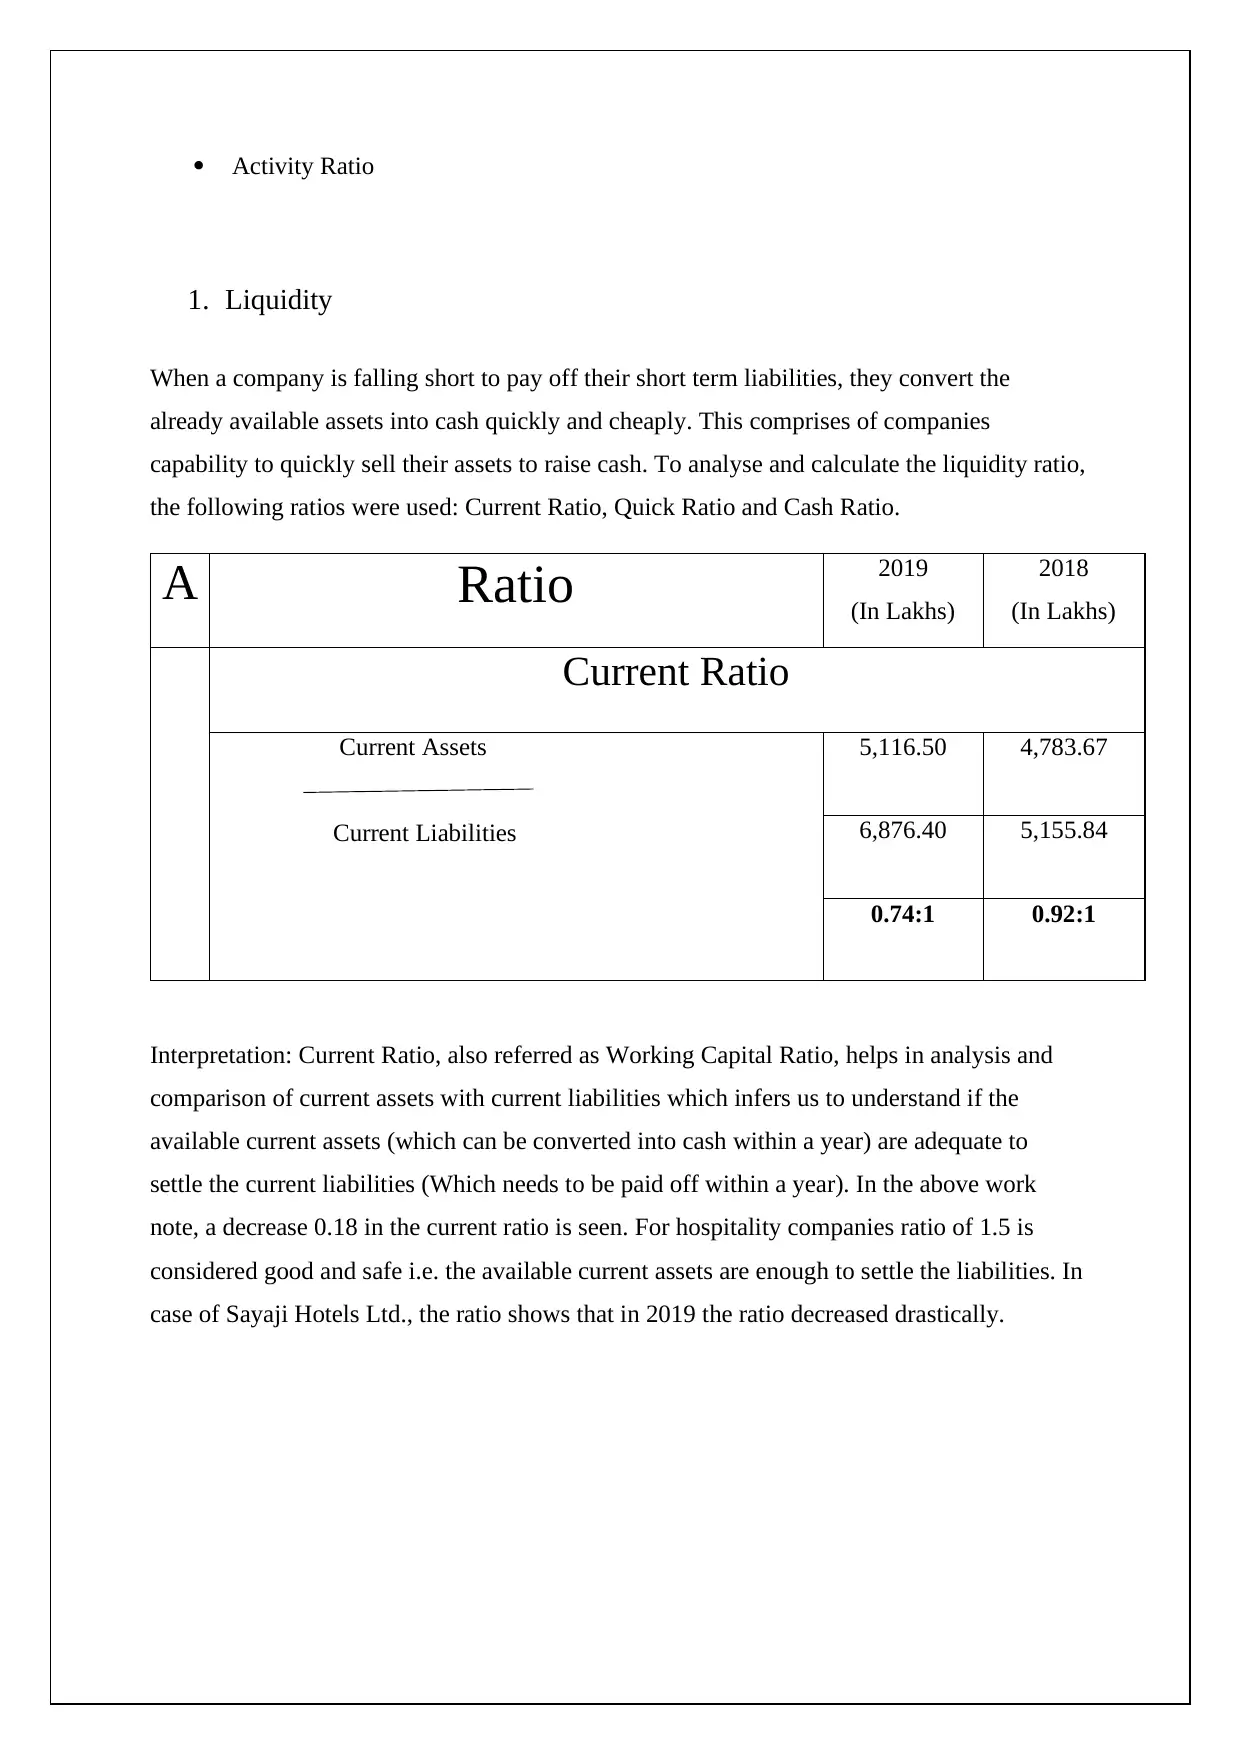
1. Liquidity
When a company is falling short to pay off their short term liabilities, they convert the
already available assets into cash quickly and cheaply. This comprises of companies
capability to quickly sell their assets to raise cash. To analyse and calculate the liquidity ratio,
the following ratios were used: Current Ratio, Quick Ratio and Cash Ratio.
A Ratio 2019
(In Lakhs)
2018
(In Lakhs)
Current Ratio
Current Assets
Current Liabilities
5,116.50 4,783.67
6,876.40 5,155.84
0.74:1 0.92:1
Interpretation: Current Ratio, also referred as Working Capital Ratio, helps in analysis and
comparison of current assets with current liabilities which infers us to understand if the
available current assets (which can be converted into cash within a year) are adequate to
settle the current liabilities (Which needs to be paid off within a year). In the above work
note, a decrease 0.18 in the current ratio is seen. For hospitality companies ratio of 1.5 is
considered good and safe i.e. the available current assets are enough to settle the liabilities. In
case of Sayaji Hotels Ltd., the ratio shows that in 2019 the ratio decreased drastically.
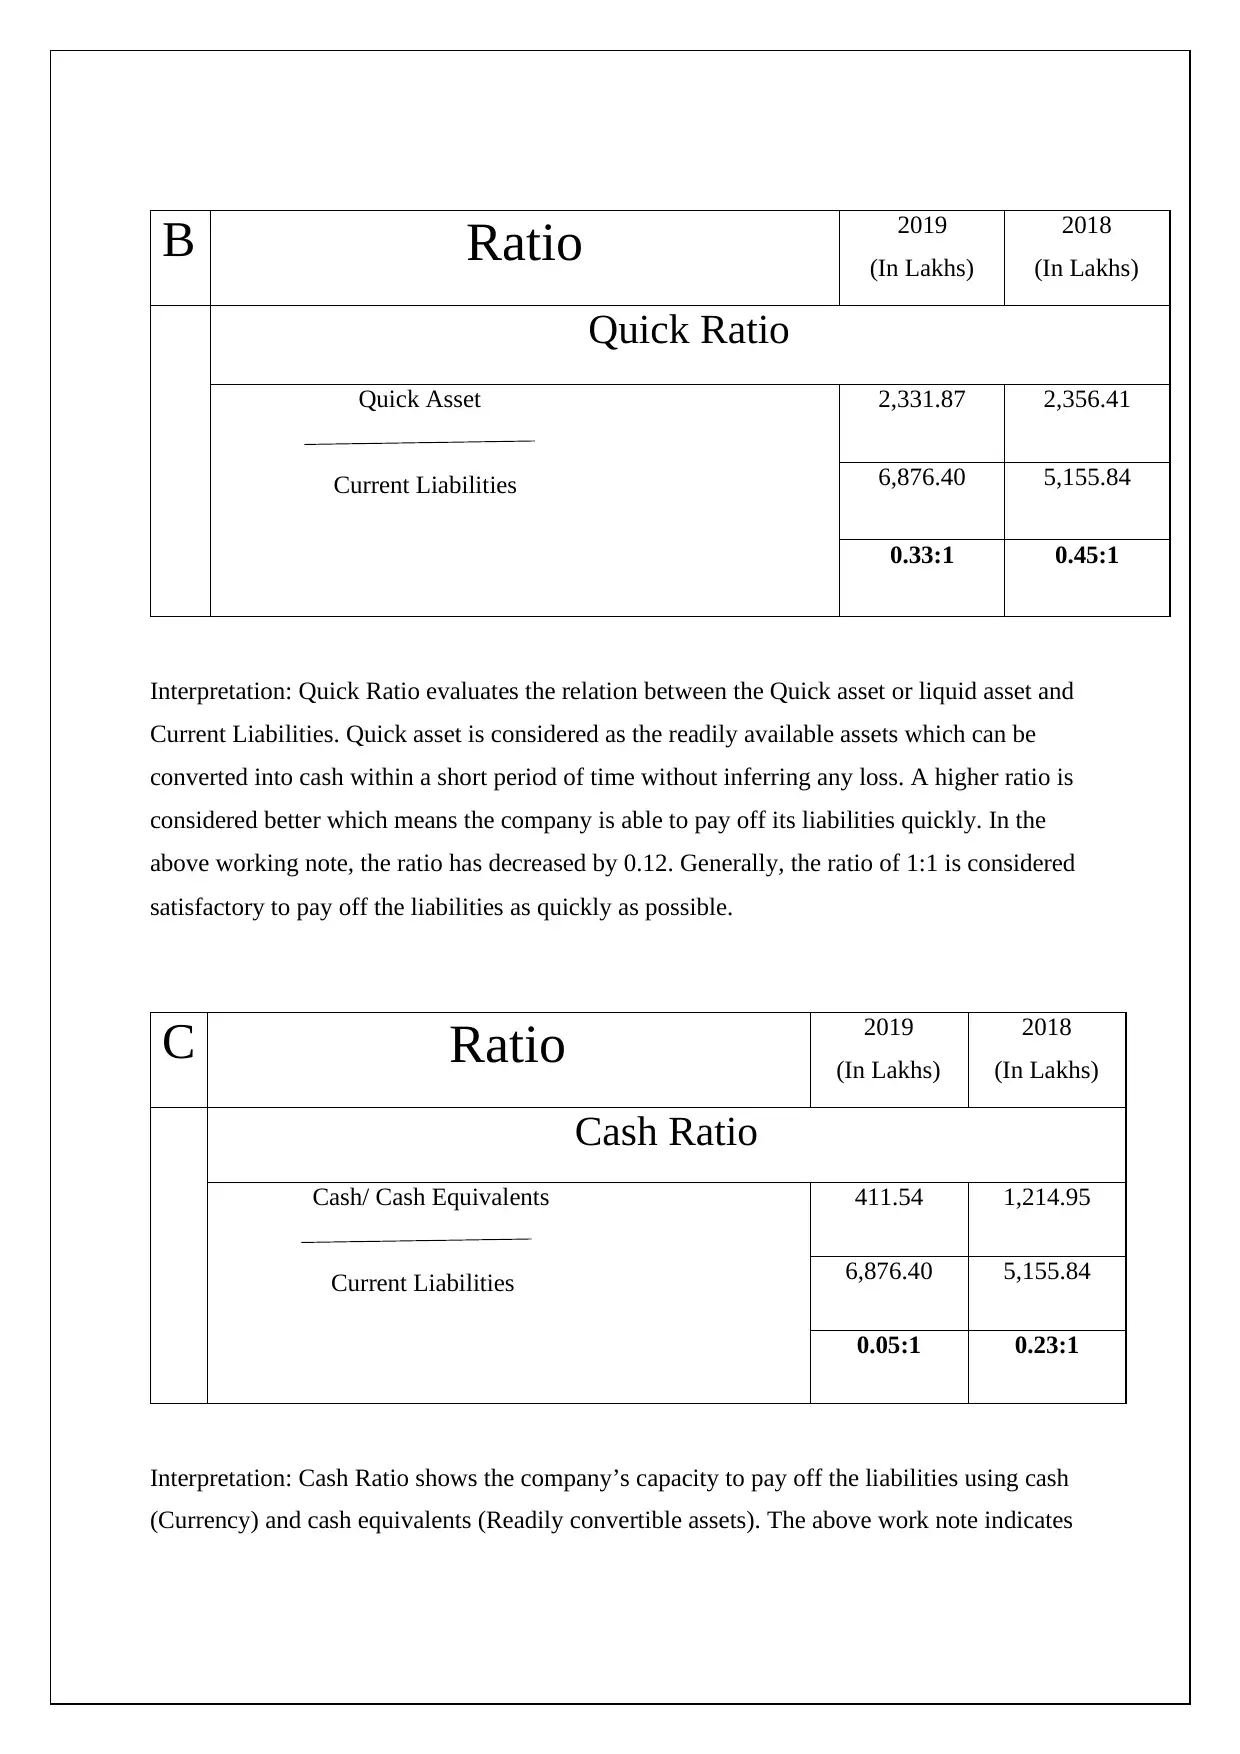
B Ratio 2019
(In Lakhs)
2018
(In Lakhs)
Quick Ratio
Quick Asset
Current Liabilities
2,331.87 2,356.41
6,876.40 5,155.84
0.33:1 0.45:1
Interpretation: Quick Ratio evaluates the relation between the Quick asset or liquid asset and
Current Liabilities. Quick asset is considered as the readily available assets which can be
converted into cash within a short period of time without inferring any loss. A higher ratio is
considered better which means the company is able to pay off its liabilities quickly. In the
above working note, the ratio has decreased by 0.12. Generally, the ratio of 1:1 is considered
satisfactory to pay off the liabilities as quickly as possible.
C Ratio 2019
(In Lakhs)
2018
(In Lakhs)
Cash Ratio
Cash/ Cash Equivalents
Current Liabilities
411.54 1,214.95
6,876.40 5,155.84
0.05:1 0.23:1
Interpretation: Cash Ratio shows the company’s capacity to pay off the liabilities using cash
(Currency) and cash equivalents (Readily convertible assets). The above work note indicates
(In Lakhs)
2018
(In Lakhs)
Quick Ratio
Quick Asset
Current Liabilities
2,331.87 2,356.41
6,876.40 5,155.84
0.33:1 0.45:1
Interpretation: Quick Ratio evaluates the relation between the Quick asset or liquid asset and
Current Liabilities. Quick asset is considered as the readily available assets which can be
converted into cash within a short period of time without inferring any loss. A higher ratio is
considered better which means the company is able to pay off its liabilities quickly. In the
above working note, the ratio has decreased by 0.12. Generally, the ratio of 1:1 is considered
satisfactory to pay off the liabilities as quickly as possible.
C Ratio 2019
(In Lakhs)
2018
(In Lakhs)
Cash Ratio
Cash/ Cash Equivalents
Current Liabilities
411.54 1,214.95
6,876.40 5,155.84
0.05:1 0.23:1
Interpretation: Cash Ratio shows the company’s capacity to pay off the liabilities using cash
(Currency) and cash equivalents (Readily convertible assets). The above work note indicates
⊘ This is a preview!⊘
Do you want full access?
Subscribe today to unlock all pages.
Trusted by 1+ million students worldwide
that the company doesn’t have enough cash or cash equivalents to pay off their liabilities.
Since the acceptable ratio is considered to be 1:1.
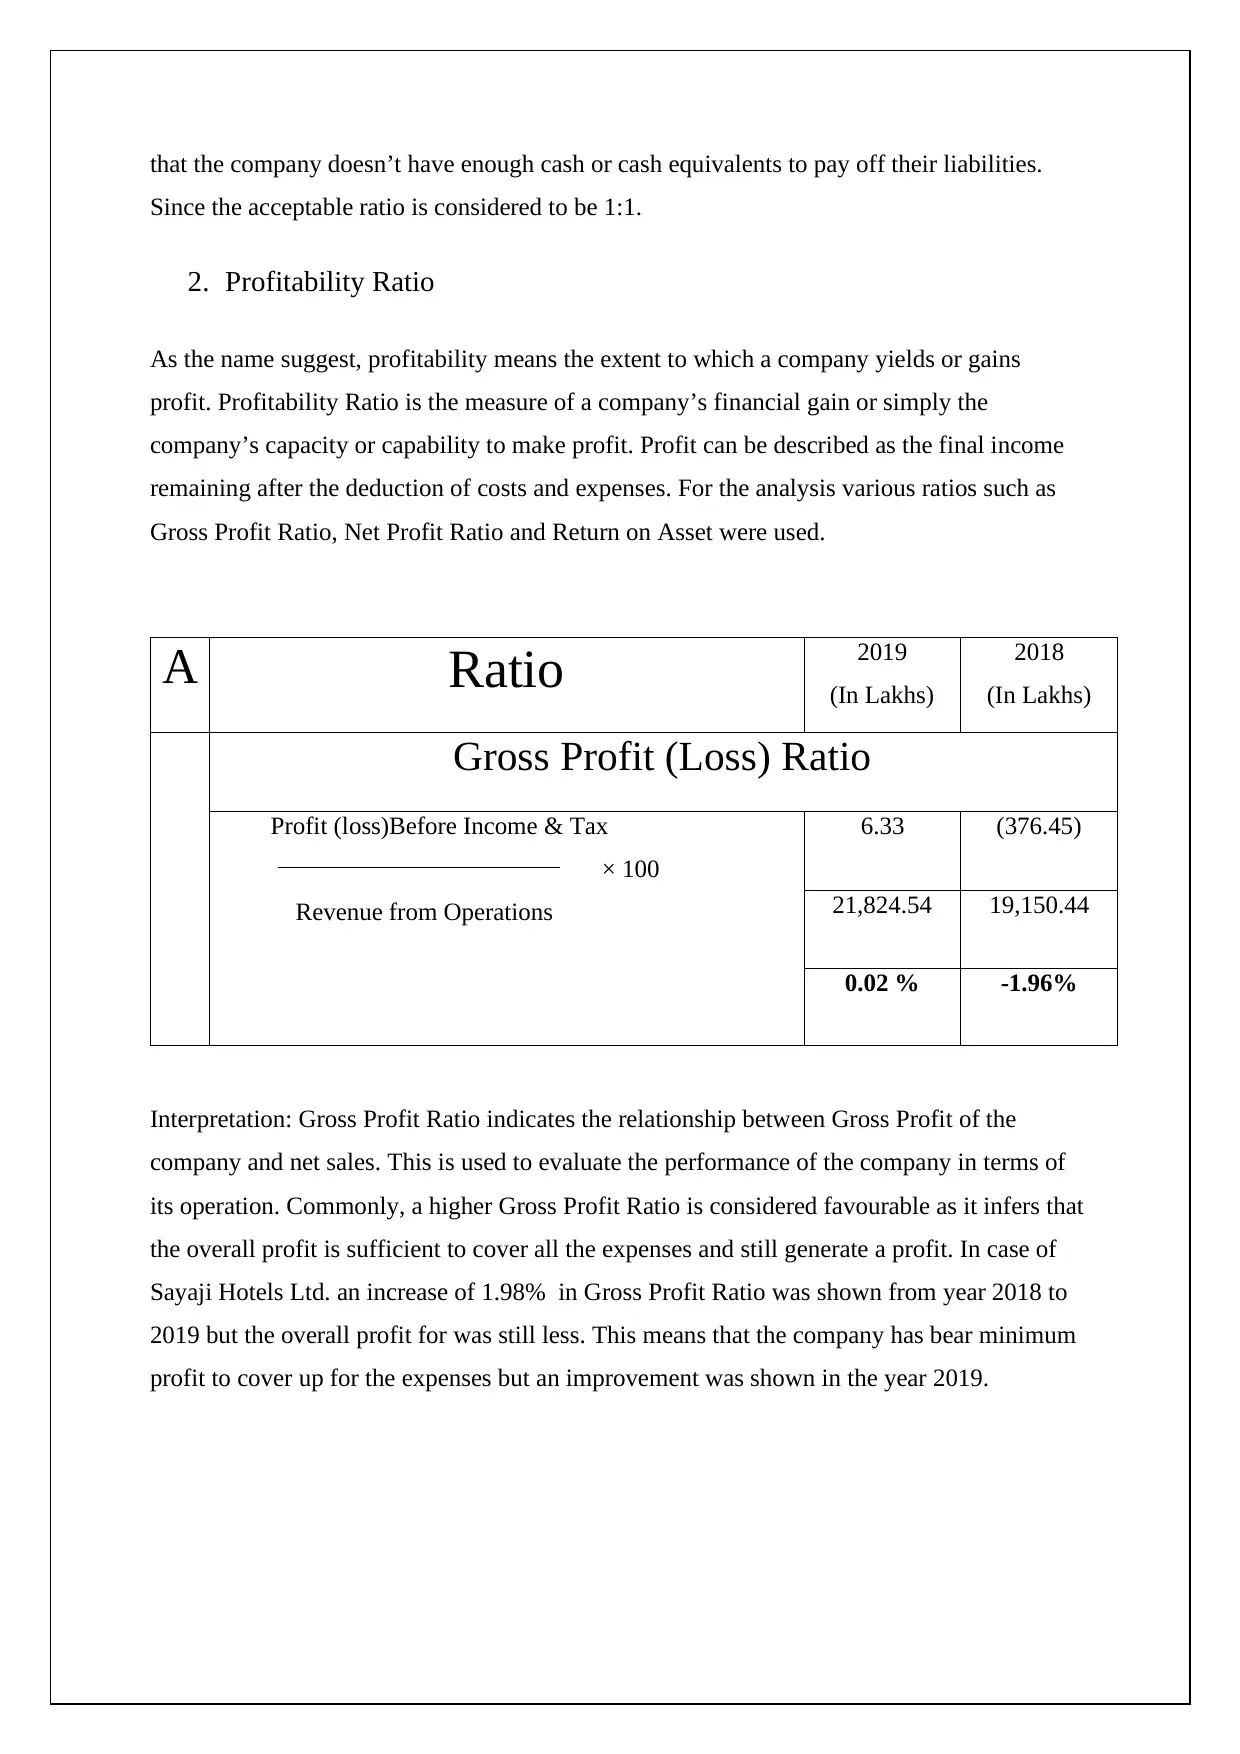
2. Profitability Ratio
As the name suggest, profitability means the extent to which a company yields or gains
profit. Profitability Ratio is the measure of a company’s financial gain or simply the
company’s capacity or capability to make profit. Profit can be described as the final income
remaining after the deduction of costs and expenses. For the analysis various ratios such as
Gross Profit Ratio, Net Profit Ratio and Return on Asset were used.
A Ratio 2019
(In Lakhs)
2018
(In Lakhs)
Gross Profit (Loss) Ratio
Profit (loss)Before Income & Tax
× 100
Revenue from Operations
6.33 (376.45)
21,824.54 19,150.44
0.02 % -1.96%
Interpretation: Gross Profit Ratio indicates the relationship between Gross Profit of the
company and net sales. This is used to evaluate the performance of the company in terms of
its operation. Commonly, a higher Gross Profit Ratio is considered favourable as it infers that
the overall profit is sufficient to cover all the expenses and still generate a profit. In case of
Sayaji Hotels Ltd. an increase of 1.98% in Gross Profit Ratio was shown from year 2018 to
2019 but the overall profit for was still less. This means that the company has bear minimum
profit to cover up for the expenses but an improvement was shown in the year 2019.
Since the acceptable ratio is considered to be 1:1.
2. Profitability Ratio
As the name suggest, profitability means the extent to which a company yields or gains
profit. Profitability Ratio is the measure of a company’s financial gain or simply the
company’s capacity or capability to make profit. Profit can be described as the final income
remaining after the deduction of costs and expenses. For the analysis various ratios such as
Gross Profit Ratio, Net Profit Ratio and Return on Asset were used.
A Ratio 2019
(In Lakhs)
2018
(In Lakhs)
Gross Profit (Loss) Ratio
Profit (loss)Before Income & Tax
× 100
Revenue from Operations
6.33 (376.45)
21,824.54 19,150.44
0.02 % -1.96%
Interpretation: Gross Profit Ratio indicates the relationship between Gross Profit of the
company and net sales. This is used to evaluate the performance of the company in terms of
its operation. Commonly, a higher Gross Profit Ratio is considered favourable as it infers that
the overall profit is sufficient to cover all the expenses and still generate a profit. In case of
Sayaji Hotels Ltd. an increase of 1.98% in Gross Profit Ratio was shown from year 2018 to
2019 but the overall profit for was still less. This means that the company has bear minimum
profit to cover up for the expenses but an improvement was shown in the year 2019.
Paraphrase This Document
Need a fresh take? Get an instant paraphrase of this document with our AI Paraphraser
B Ratio 2019
(In Lakhs)
2018
(In Lakhs)
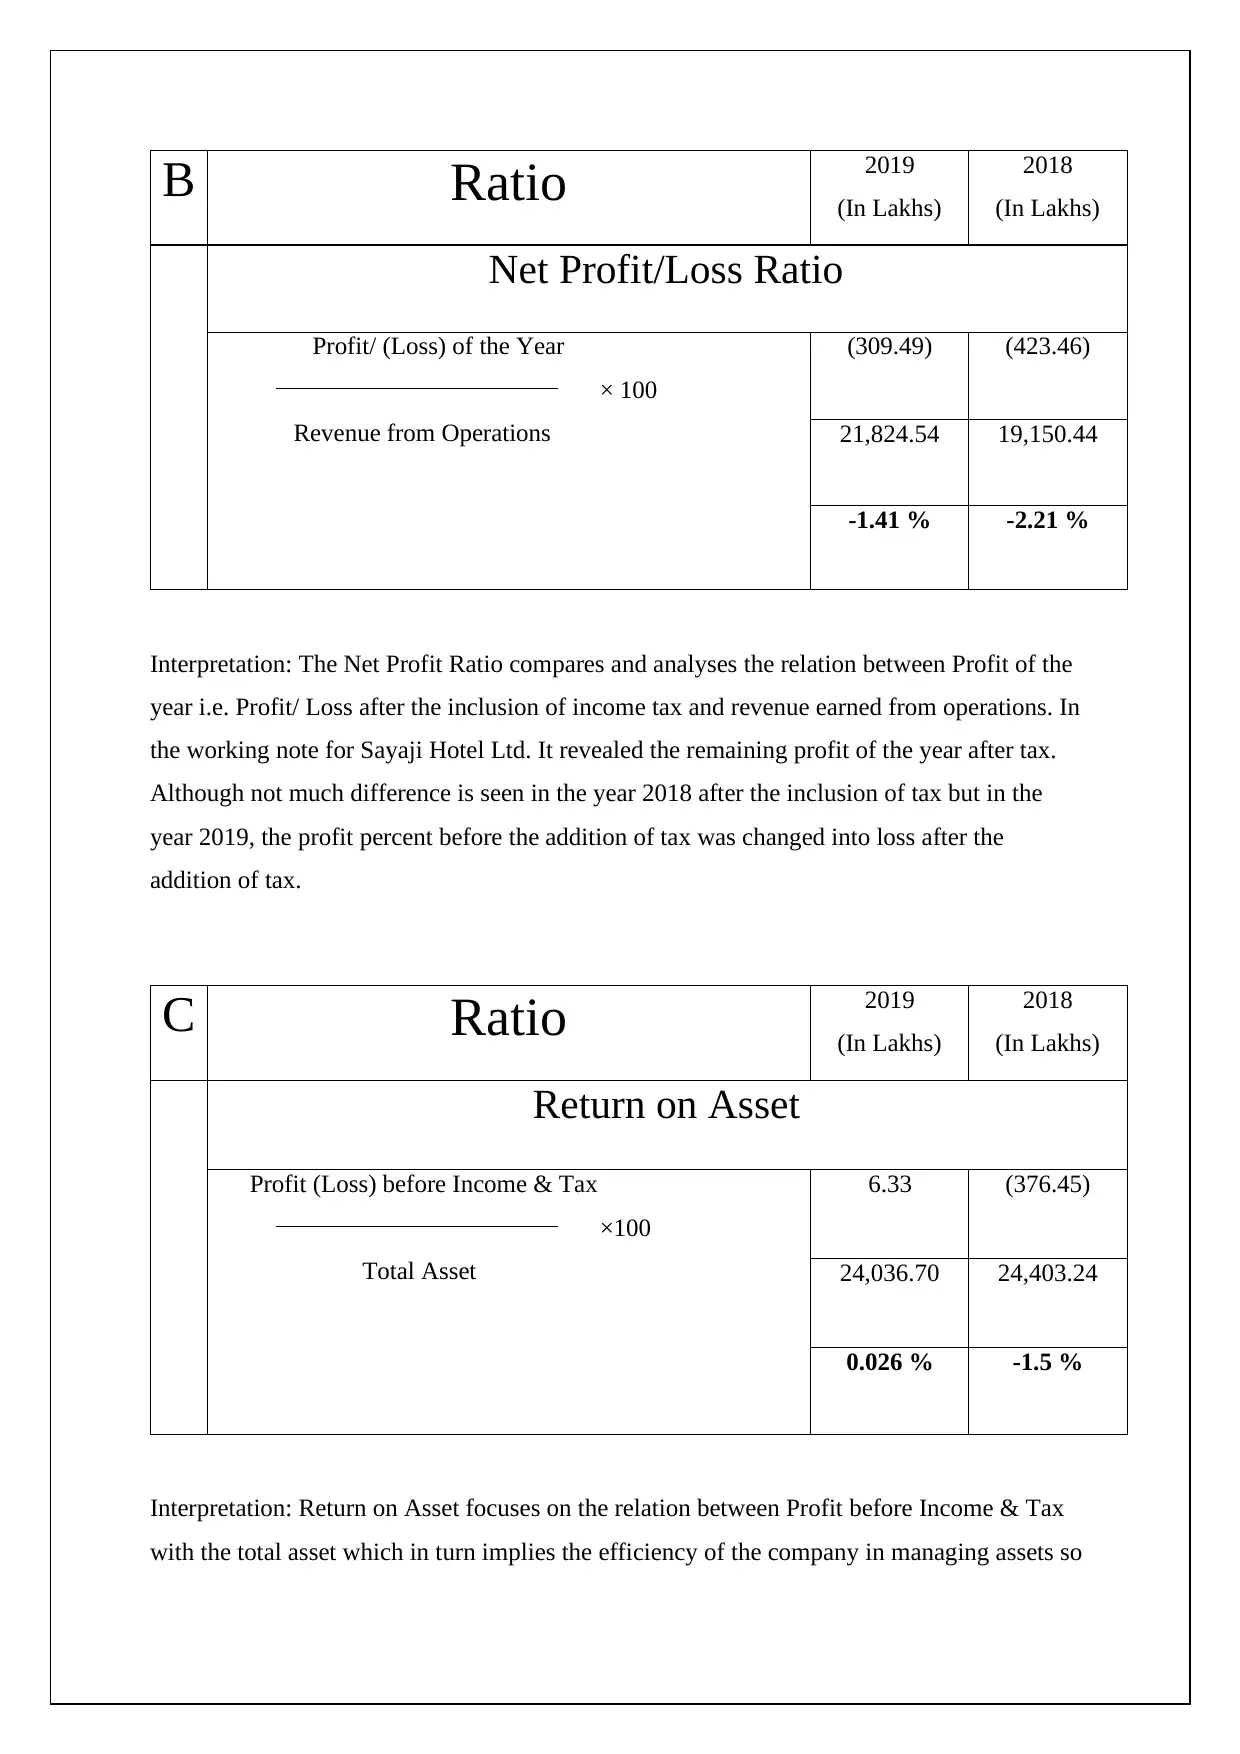
Net Profit/Loss Ratio
Profit/ (Loss) of the Year
× 100
Revenue from Operations
(309.49) (423.46)
21,824.54 19,150.44
-1.41 % -2.21 %
Interpretation: The Net Profit Ratio compares and analyses the relation between Profit of the
year i.e. Profit/ Loss after the inclusion of income tax and revenue earned from operations. In
the working note for Sayaji Hotel Ltd. It revealed the remaining profit of the year after tax.
Although not much difference is seen in the year 2018 after the inclusion of tax but in the
year 2019, the profit percent before the addition of tax was changed into loss after the
addition of tax.
C Ratio 2019
(In Lakhs)
2018
(In Lakhs)
Return on Asset
Profit (Loss) before Income & Tax
×100
Total Asset
6.33 (376.45)
24,036.70 24,403.24
0.026 % -1.5 %
Interpretation: Return on Asset focuses on the relation between Profit before Income & Tax
with the total asset which in turn implies the efficiency of the company in managing assets so
(In Lakhs)
2018
(In Lakhs)
Net Profit/Loss Ratio
Profit/ (Loss) of the Year
× 100
Revenue from Operations
(309.49) (423.46)
21,824.54 19,150.44
-1.41 % -2.21 %
Interpretation: The Net Profit Ratio compares and analyses the relation between Profit of the
year i.e. Profit/ Loss after the inclusion of income tax and revenue earned from operations. In
the working note for Sayaji Hotel Ltd. It revealed the remaining profit of the year after tax.
Although not much difference is seen in the year 2018 after the inclusion of tax but in the
year 2019, the profit percent before the addition of tax was changed into loss after the
addition of tax.
C Ratio 2019
(In Lakhs)
2018
(In Lakhs)
Return on Asset
Profit (Loss) before Income & Tax
×100
Total Asset
6.33 (376.45)
24,036.70 24,403.24
0.026 % -1.5 %
Interpretation: Return on Asset focuses on the relation between Profit before Income & Tax
with the total asset which in turn implies the efficiency of the company in managing assets so
that the company can produce profit. This tells us how well a company can turn the
investment in assets into their financial gain. Higher the percent, effective the asset
management. Unfortunately for Sayaji Hotel Ltd., the Return on Asset was not very
profitable in both years but in 2018 especially it went into loss.
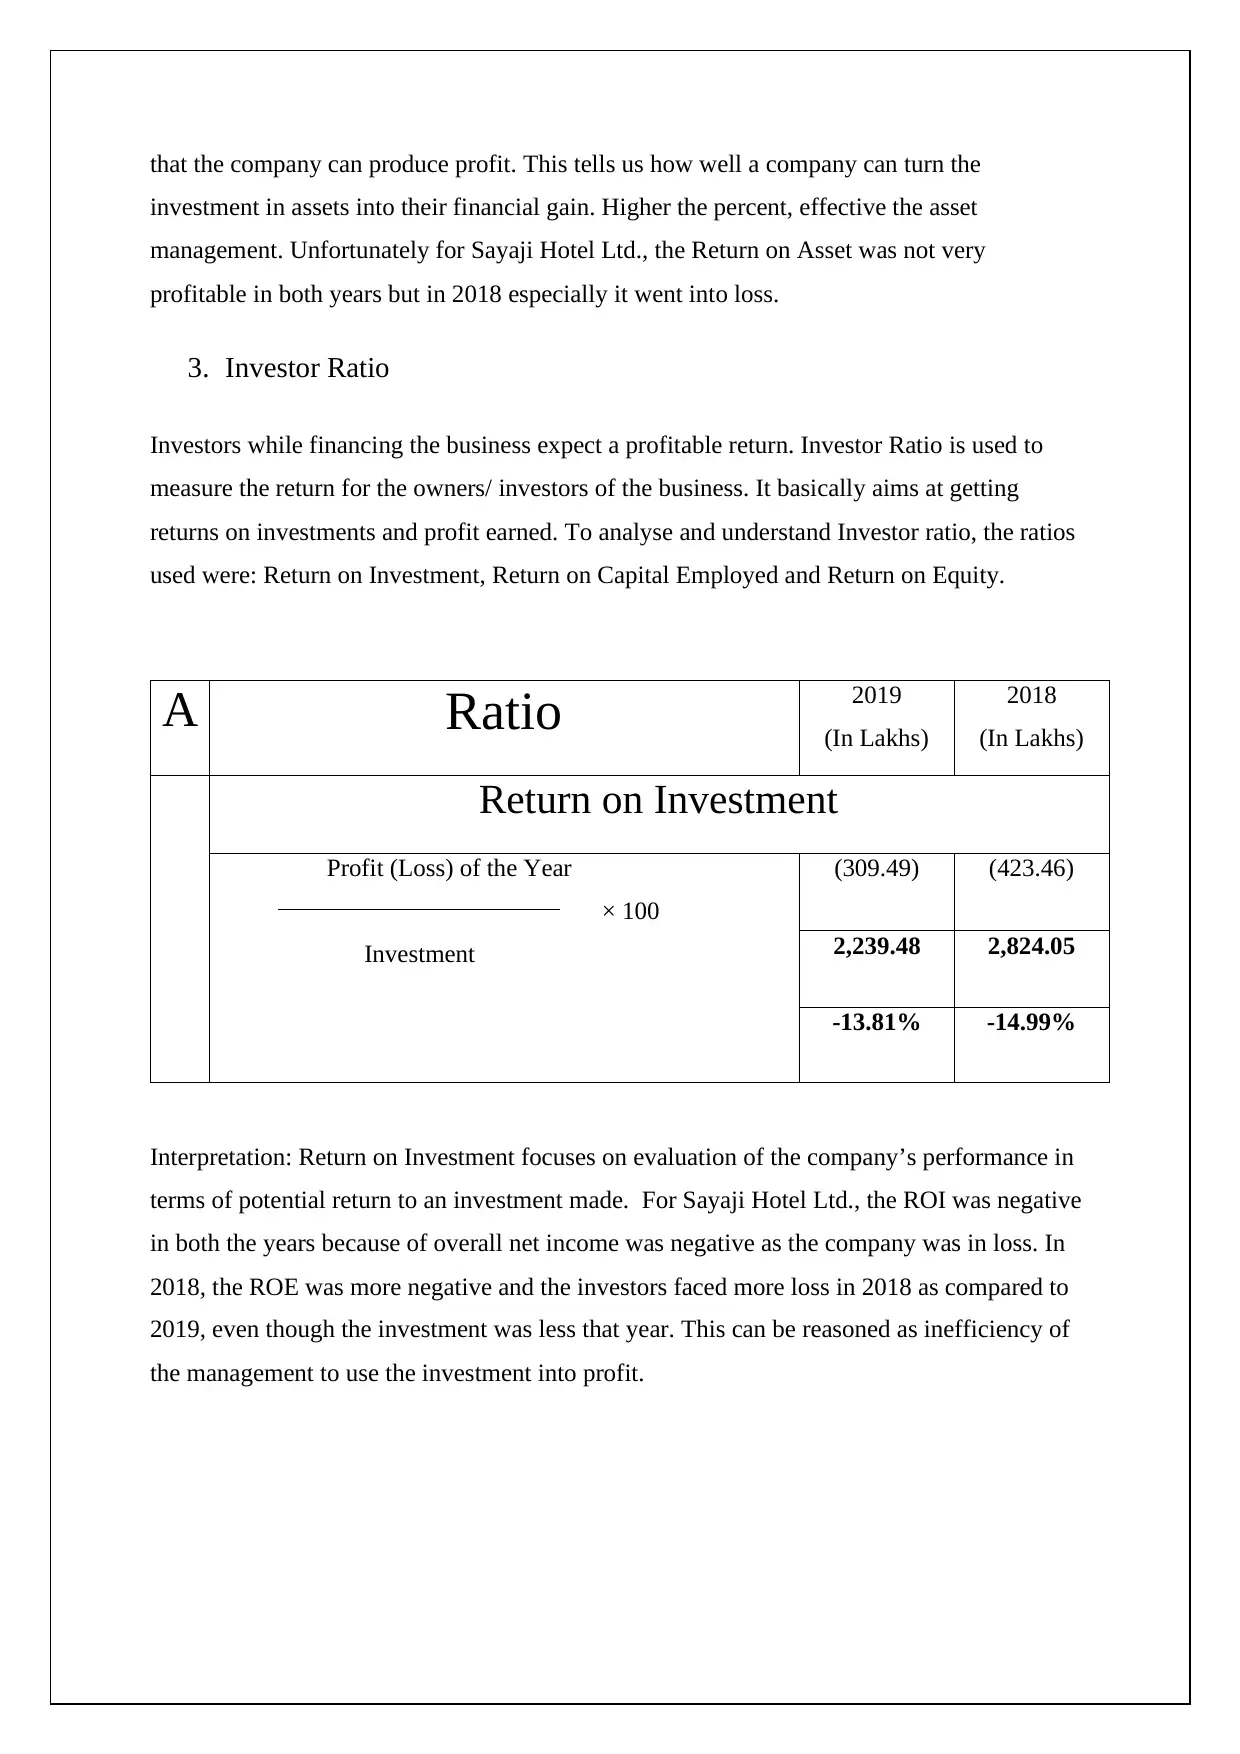
3. Investor Ratio
Investors while financing the business expect a profitable return. Investor Ratio is used to
measure the return for the owners/ investors of the business. It basically aims at getting
returns on investments and profit earned. To analyse and understand Investor ratio, the ratios
used were: Return on Investment, Return on Capital Employed and Return on Equity.
A Ratio 2019
(In Lakhs)
2018
(In Lakhs)
Return on Investment
Profit (Loss) of the Year
× 100
Investment
(309.49) (423.46)
2,239.48 2,824.05
-13.81% -14.99%
Interpretation: Return on Investment focuses on evaluation of the company’s performance in
terms of potential return to an investment made. For Sayaji Hotel Ltd., the ROI was negative
in both the years because of overall net income was negative as the company was in loss. In
2018, the ROE was more negative and the investors faced more loss in 2018 as compared to
2019, even though the investment was less that year. This can be reasoned as inefficiency of
the management to use the investment into profit.
investment in assets into their financial gain. Higher the percent, effective the asset
management. Unfortunately for Sayaji Hotel Ltd., the Return on Asset was not very
profitable in both years but in 2018 especially it went into loss.
3. Investor Ratio
Investors while financing the business expect a profitable return. Investor Ratio is used to
measure the return for the owners/ investors of the business. It basically aims at getting
returns on investments and profit earned. To analyse and understand Investor ratio, the ratios
used were: Return on Investment, Return on Capital Employed and Return on Equity.
A Ratio 2019
(In Lakhs)
2018
(In Lakhs)
Return on Investment
Profit (Loss) of the Year
× 100
Investment
(309.49) (423.46)
2,239.48 2,824.05
-13.81% -14.99%
Interpretation: Return on Investment focuses on evaluation of the company’s performance in
terms of potential return to an investment made. For Sayaji Hotel Ltd., the ROI was negative
in both the years because of overall net income was negative as the company was in loss. In
2018, the ROE was more negative and the investors faced more loss in 2018 as compared to
2019, even though the investment was less that year. This can be reasoned as inefficiency of
the management to use the investment into profit.
⊘ This is a preview!⊘
Do you want full access?
Subscribe today to unlock all pages.
Trusted by 1+ million students worldwide
B Ratio 2019
(In Lakhs)
2018
(In Lakhs)
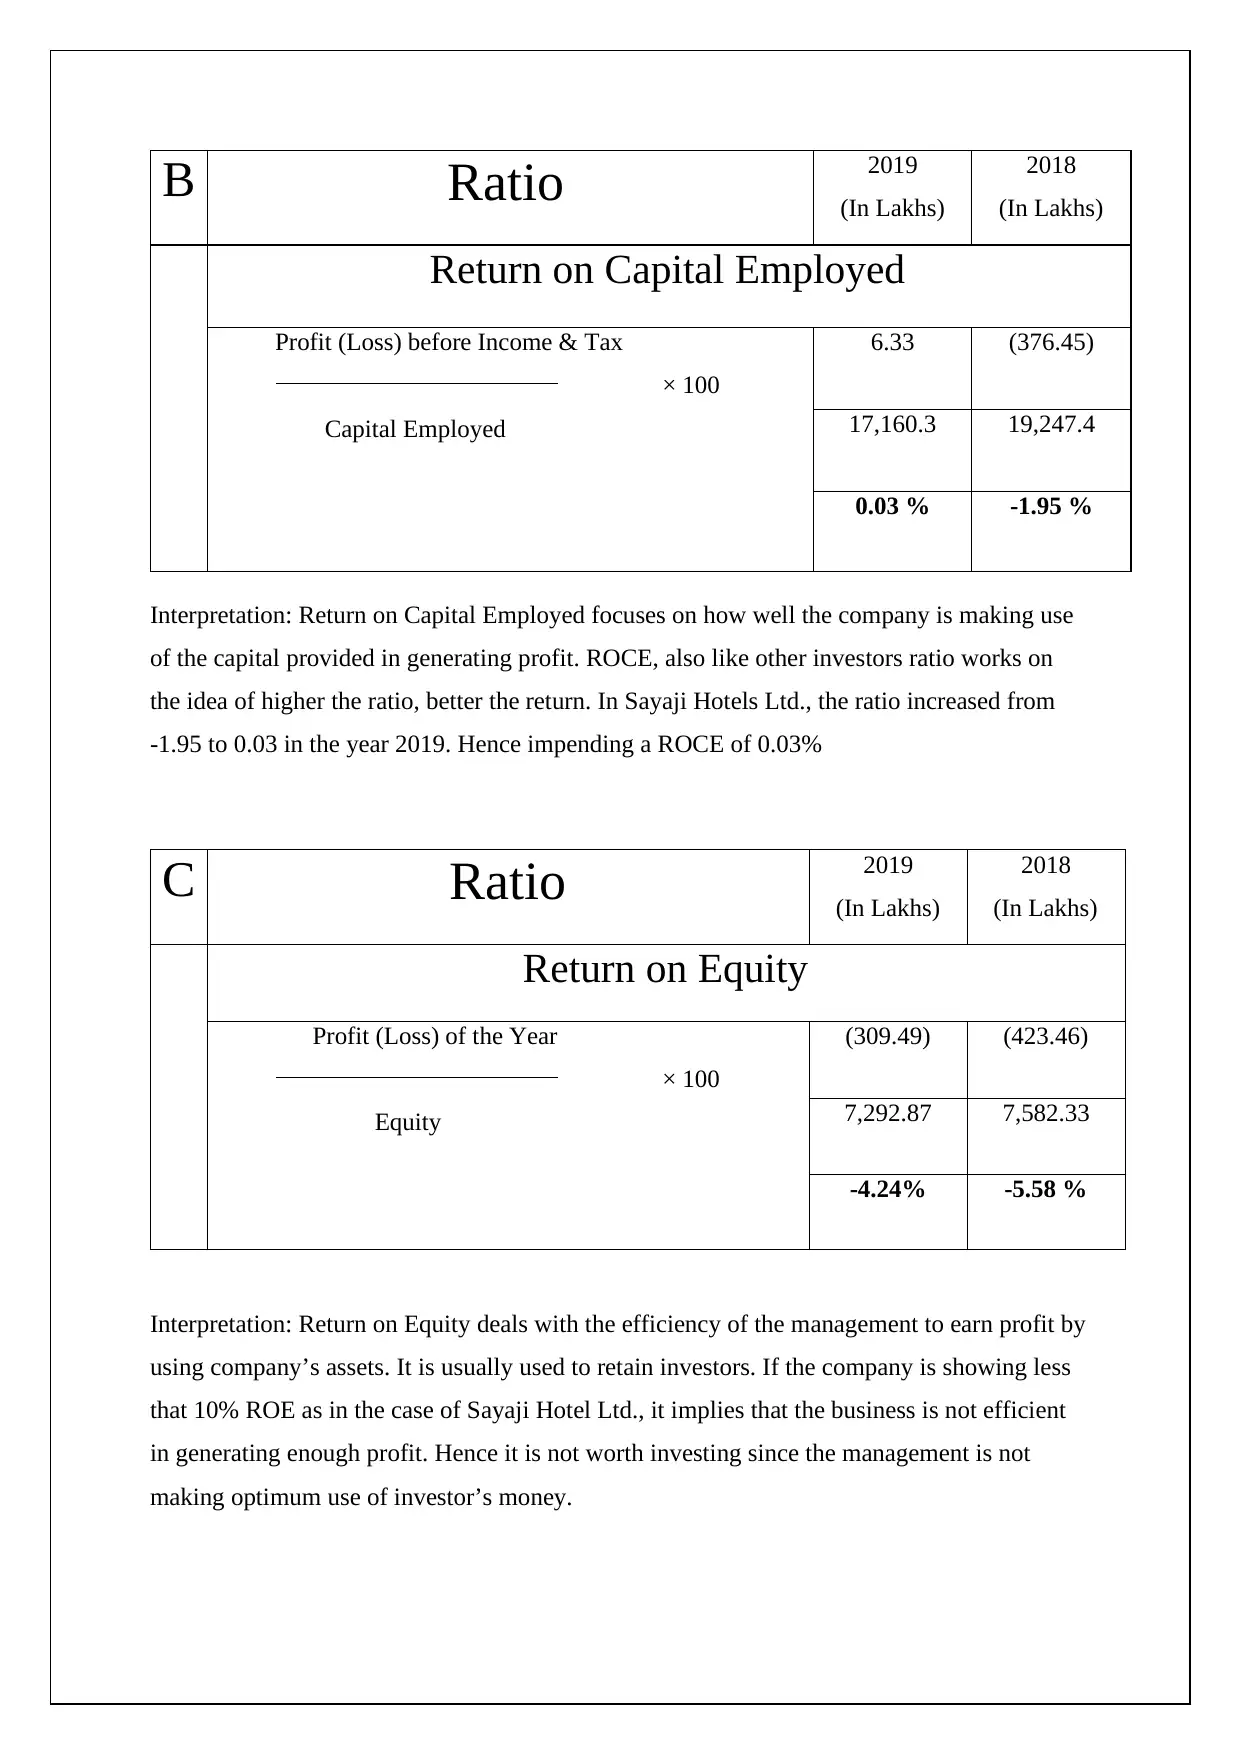
Return on Capital Employed
Profit (Loss) before Income & Tax
× 100
Capital Employed
6.33 (376.45)
17,160.3 19,247.4
0.03 % -1.95 %
Interpretation: Return on Capital Employed focuses on how well the company is making use
of the capital provided in generating profit. ROCE, also like other investors ratio works on
the idea of higher the ratio, better the return. In Sayaji Hotels Ltd., the ratio increased from
-1.95 to 0.03 in the year 2019. Hence impending a ROCE of 0.03%
C Ratio 2019
(In Lakhs)
2018
(In Lakhs)
Return on Equity
Profit (Loss) of the Year
× 100
Equity
(309.49) (423.46)
7,292.87 7,582.33
-4.24% -5.58 %
Interpretation: Return on Equity deals with the efficiency of the management to earn profit by
using company’s assets. It is usually used to retain investors. If the company is showing less
that 10% ROE as in the case of Sayaji Hotel Ltd., it implies that the business is not efficient
in generating enough profit. Hence it is not worth investing since the management is not
making optimum use of investor’s money.
(In Lakhs)
2018
(In Lakhs)
Return on Capital Employed
Profit (Loss) before Income & Tax
× 100
Capital Employed
6.33 (376.45)
17,160.3 19,247.4
0.03 % -1.95 %
Interpretation: Return on Capital Employed focuses on how well the company is making use
of the capital provided in generating profit. ROCE, also like other investors ratio works on
the idea of higher the ratio, better the return. In Sayaji Hotels Ltd., the ratio increased from
-1.95 to 0.03 in the year 2019. Hence impending a ROCE of 0.03%
C Ratio 2019
(In Lakhs)
2018
(In Lakhs)
Return on Equity
Profit (Loss) of the Year
× 100
Equity
(309.49) (423.46)
7,292.87 7,582.33
-4.24% -5.58 %
Interpretation: Return on Equity deals with the efficiency of the management to earn profit by
using company’s assets. It is usually used to retain investors. If the company is showing less
that 10% ROE as in the case of Sayaji Hotel Ltd., it implies that the business is not efficient
in generating enough profit. Hence it is not worth investing since the management is not
making optimum use of investor’s money.
Paraphrase This Document
Need a fresh take? Get an instant paraphrase of this document with our AI Paraphraser
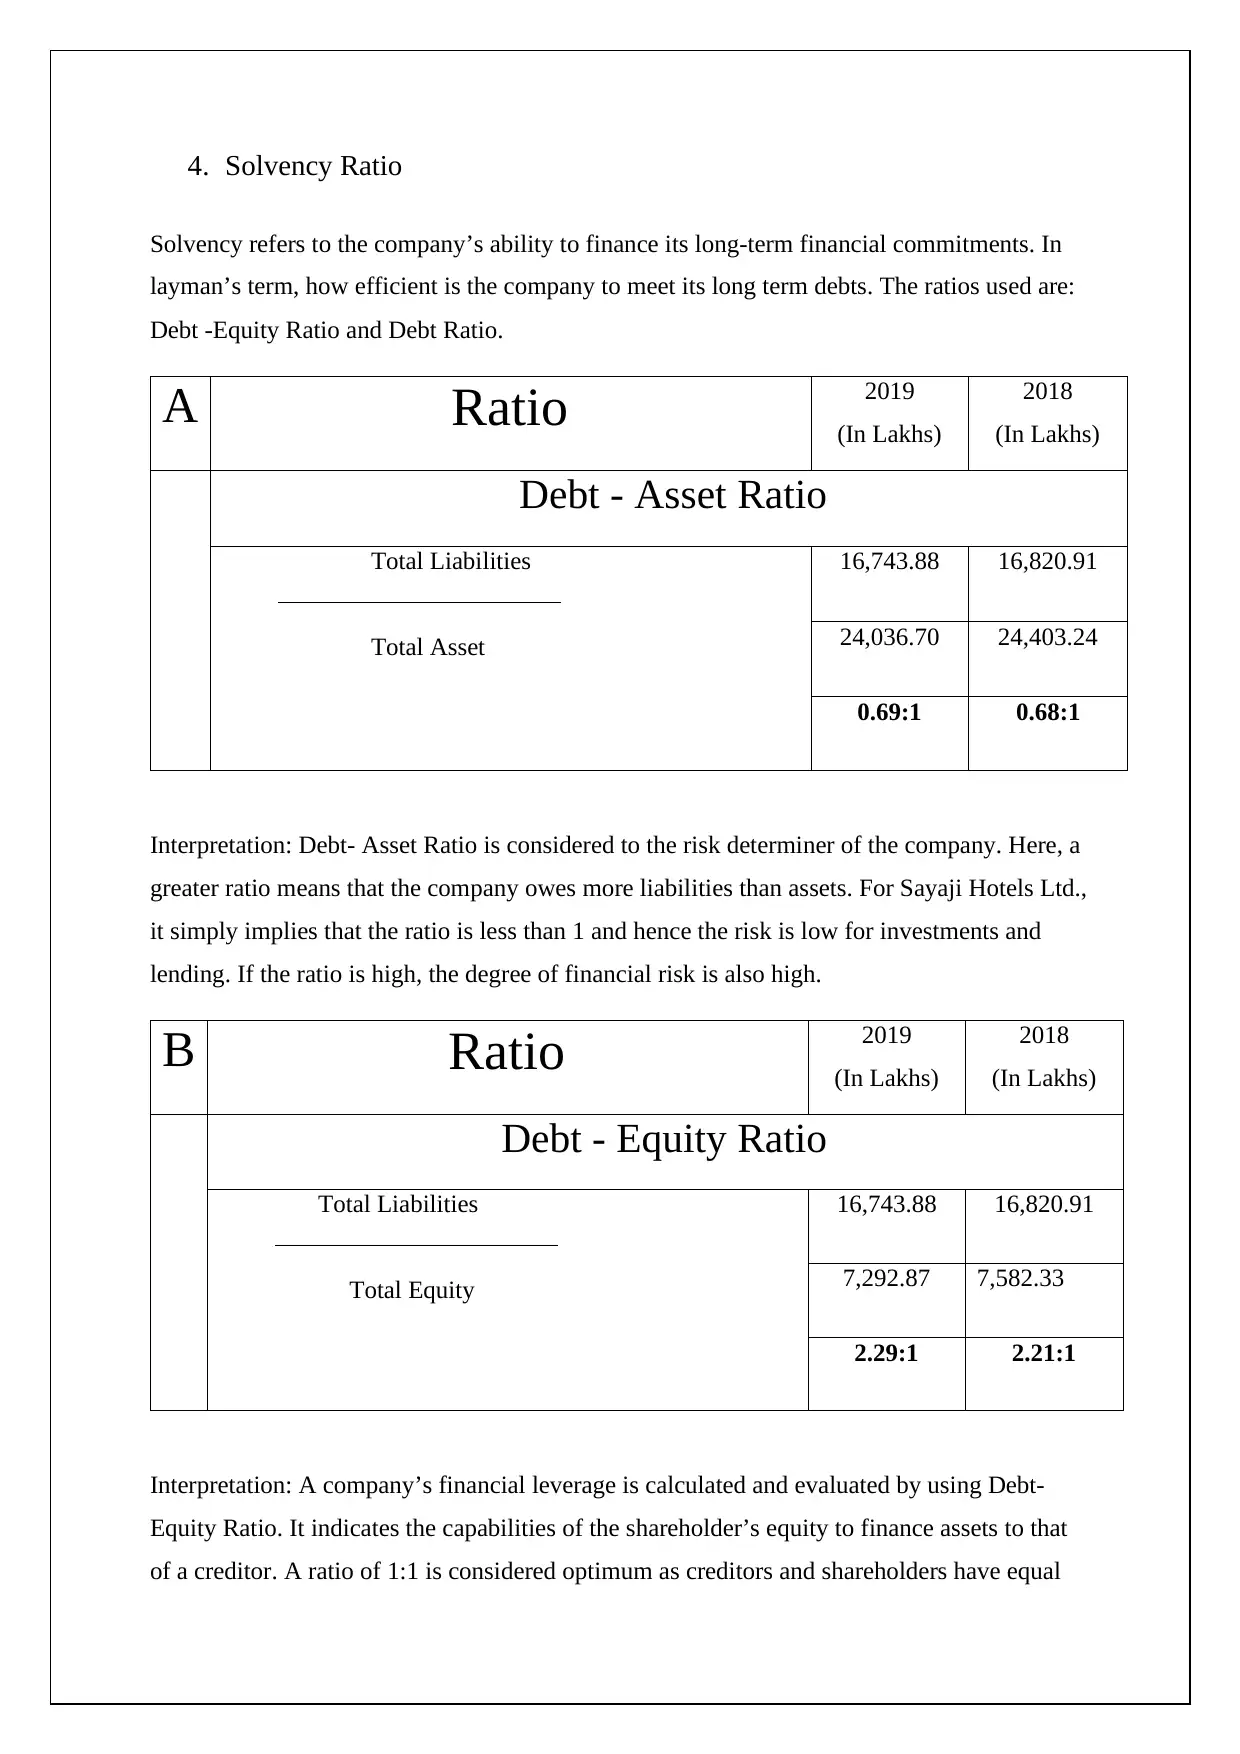
4. Solvency Ratio
Solvency refers to the company’s ability to finance its long-term financial commitments. In
layman’s term, how efficient is the company to meet its long term debts. The ratios used are:
Debt -Equity Ratio and Debt Ratio.
A Ratio 2019
(In Lakhs)
2018
(In Lakhs)
Debt - Asset Ratio
Total Liabilities
Total Asset
16,743.88 16,820.91
24,036.70 24,403.24
0.69:1 0.68:1
Interpretation: Debt- Asset Ratio is considered to the risk determiner of the company. Here, a
greater ratio means that the company owes more liabilities than assets. For Sayaji Hotels Ltd.,
it simply implies that the ratio is less than 1 and hence the risk is low for investments and
lending. If the ratio is high, the degree of financial risk is also high.
B Ratio 2019
(In Lakhs)
2018
(In Lakhs)
Debt - Equity Ratio
Total Liabilities
Total Equity
16,743.88 16,820.91
7,292.87 7,582.33
2.29:1 2.21:1
Interpretation: A company’s financial leverage is calculated and evaluated by using Debt-
Equity Ratio. It indicates the capabilities of the shareholder’s equity to finance assets to that
of a creditor. A ratio of 1:1 is considered optimum as creditors and shareholders have equal
contribution. If the ratio is more than one that infers that the company is financed by creditors
more and that could be risky. In Sayaji Hotels Ltd. the ratio is high and hence this in turn will
not attract lending capital and shareholders.
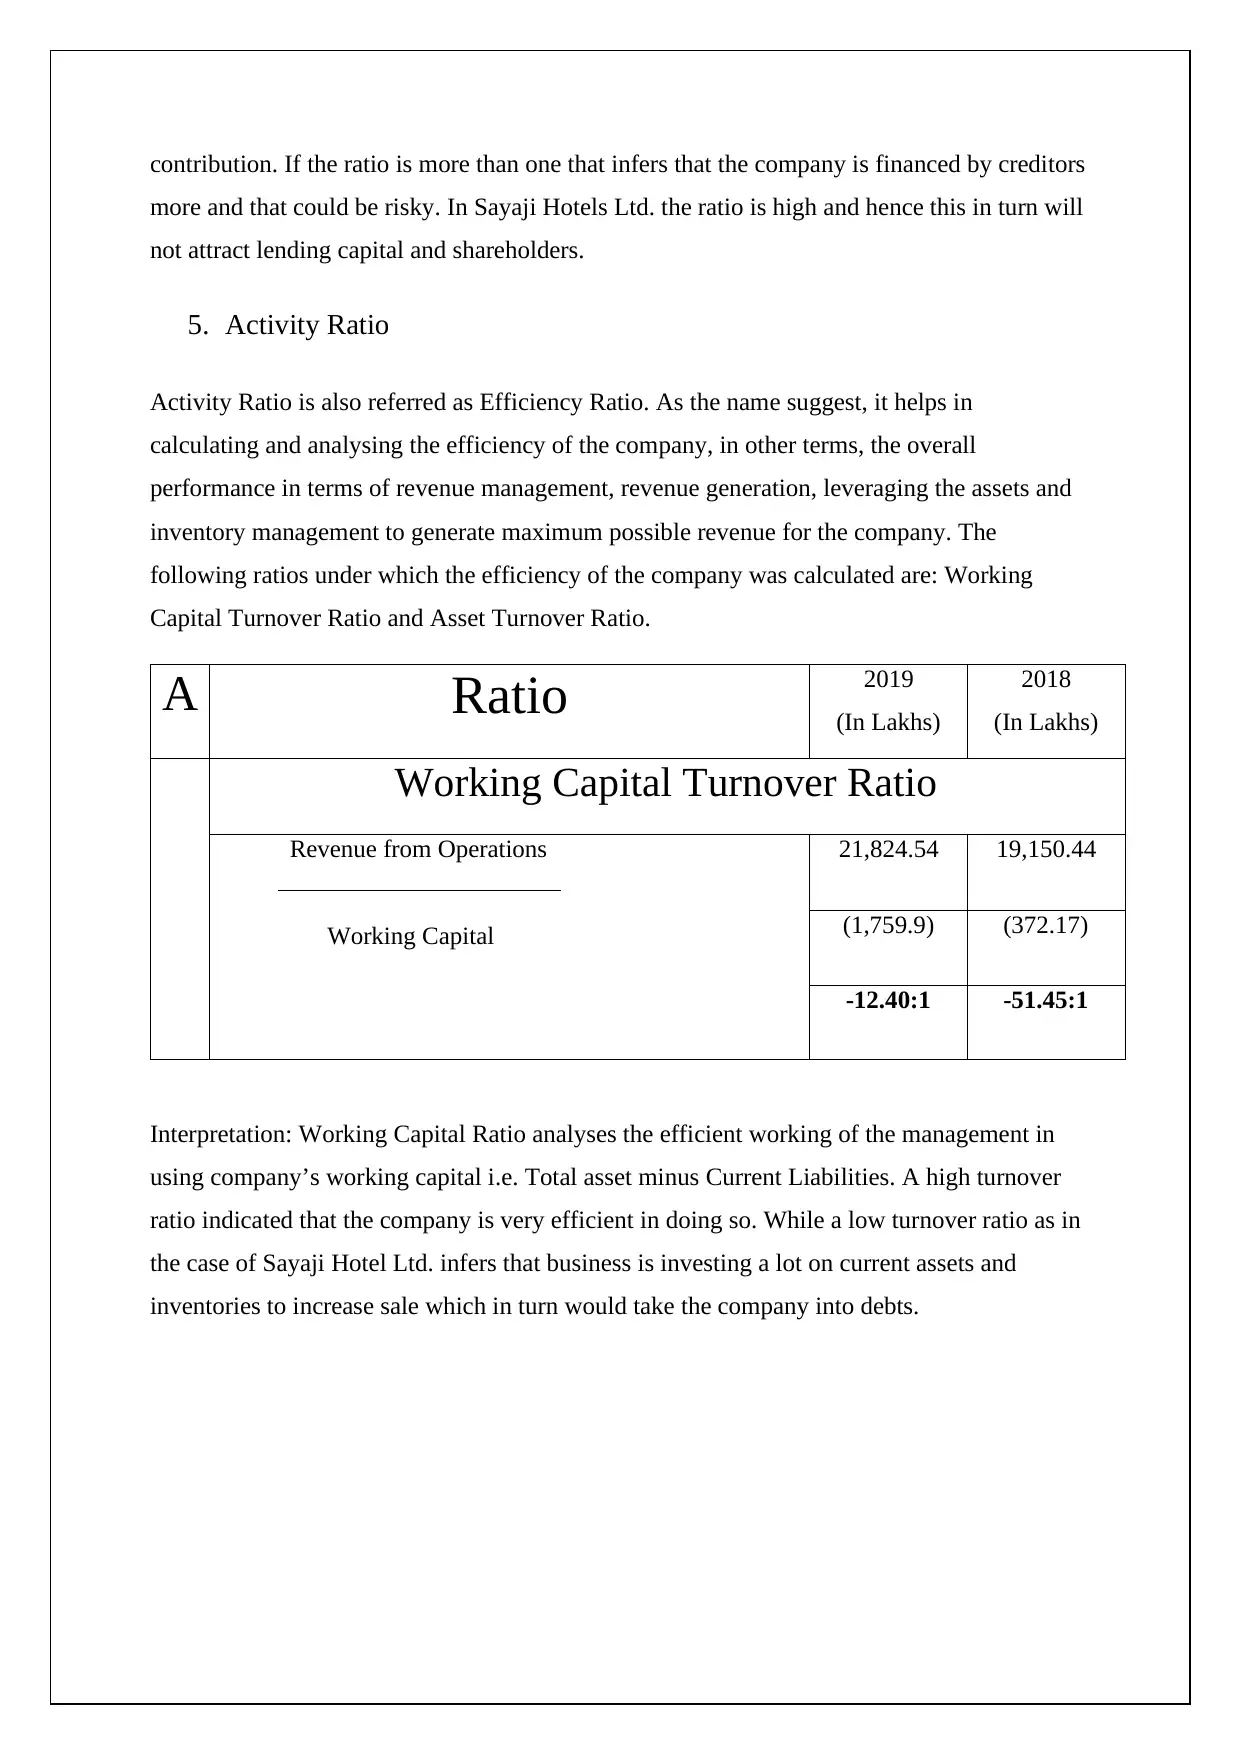
5. Activity Ratio
Activity Ratio is also referred as Efficiency Ratio. As the name suggest, it helps in
calculating and analysing the efficiency of the company, in other terms, the overall
performance in terms of revenue management, revenue generation, leveraging the assets and
inventory management to generate maximum possible revenue for the company. The
following ratios under which the efficiency of the company was calculated are: Working
Capital Turnover Ratio and Asset Turnover Ratio.
A Ratio 2019
(In Lakhs)
2018
(In Lakhs)
Working Capital Turnover Ratio
Revenue from Operations
Working Capital
21,824.54 19,150.44
(1,759.9) (372.17)
-12.40:1 -51.45:1
Interpretation: Working Capital Ratio analyses the efficient working of the management in
using company’s working capital i.e. Total asset minus Current Liabilities. A high turnover
ratio indicated that the company is very efficient in doing so. While a low turnover ratio as in
the case of Sayaji Hotel Ltd. infers that business is investing a lot on current assets and
inventories to increase sale which in turn would take the company into debts.
more and that could be risky. In Sayaji Hotels Ltd. the ratio is high and hence this in turn will
not attract lending capital and shareholders.
5. Activity Ratio
Activity Ratio is also referred as Efficiency Ratio. As the name suggest, it helps in
calculating and analysing the efficiency of the company, in other terms, the overall
performance in terms of revenue management, revenue generation, leveraging the assets and
inventory management to generate maximum possible revenue for the company. The
following ratios under which the efficiency of the company was calculated are: Working
Capital Turnover Ratio and Asset Turnover Ratio.
A Ratio 2019
(In Lakhs)
2018
(In Lakhs)
Working Capital Turnover Ratio
Revenue from Operations
Working Capital
21,824.54 19,150.44
(1,759.9) (372.17)
-12.40:1 -51.45:1
Interpretation: Working Capital Ratio analyses the efficient working of the management in
using company’s working capital i.e. Total asset minus Current Liabilities. A high turnover
ratio indicated that the company is very efficient in doing so. While a low turnover ratio as in
the case of Sayaji Hotel Ltd. infers that business is investing a lot on current assets and
inventories to increase sale which in turn would take the company into debts.
⊘ This is a preview!⊘
Do you want full access?
Subscribe today to unlock all pages.
Trusted by 1+ million students worldwide
B Ratio 2019
(In Lakhs)
2018
(In Lakhs)
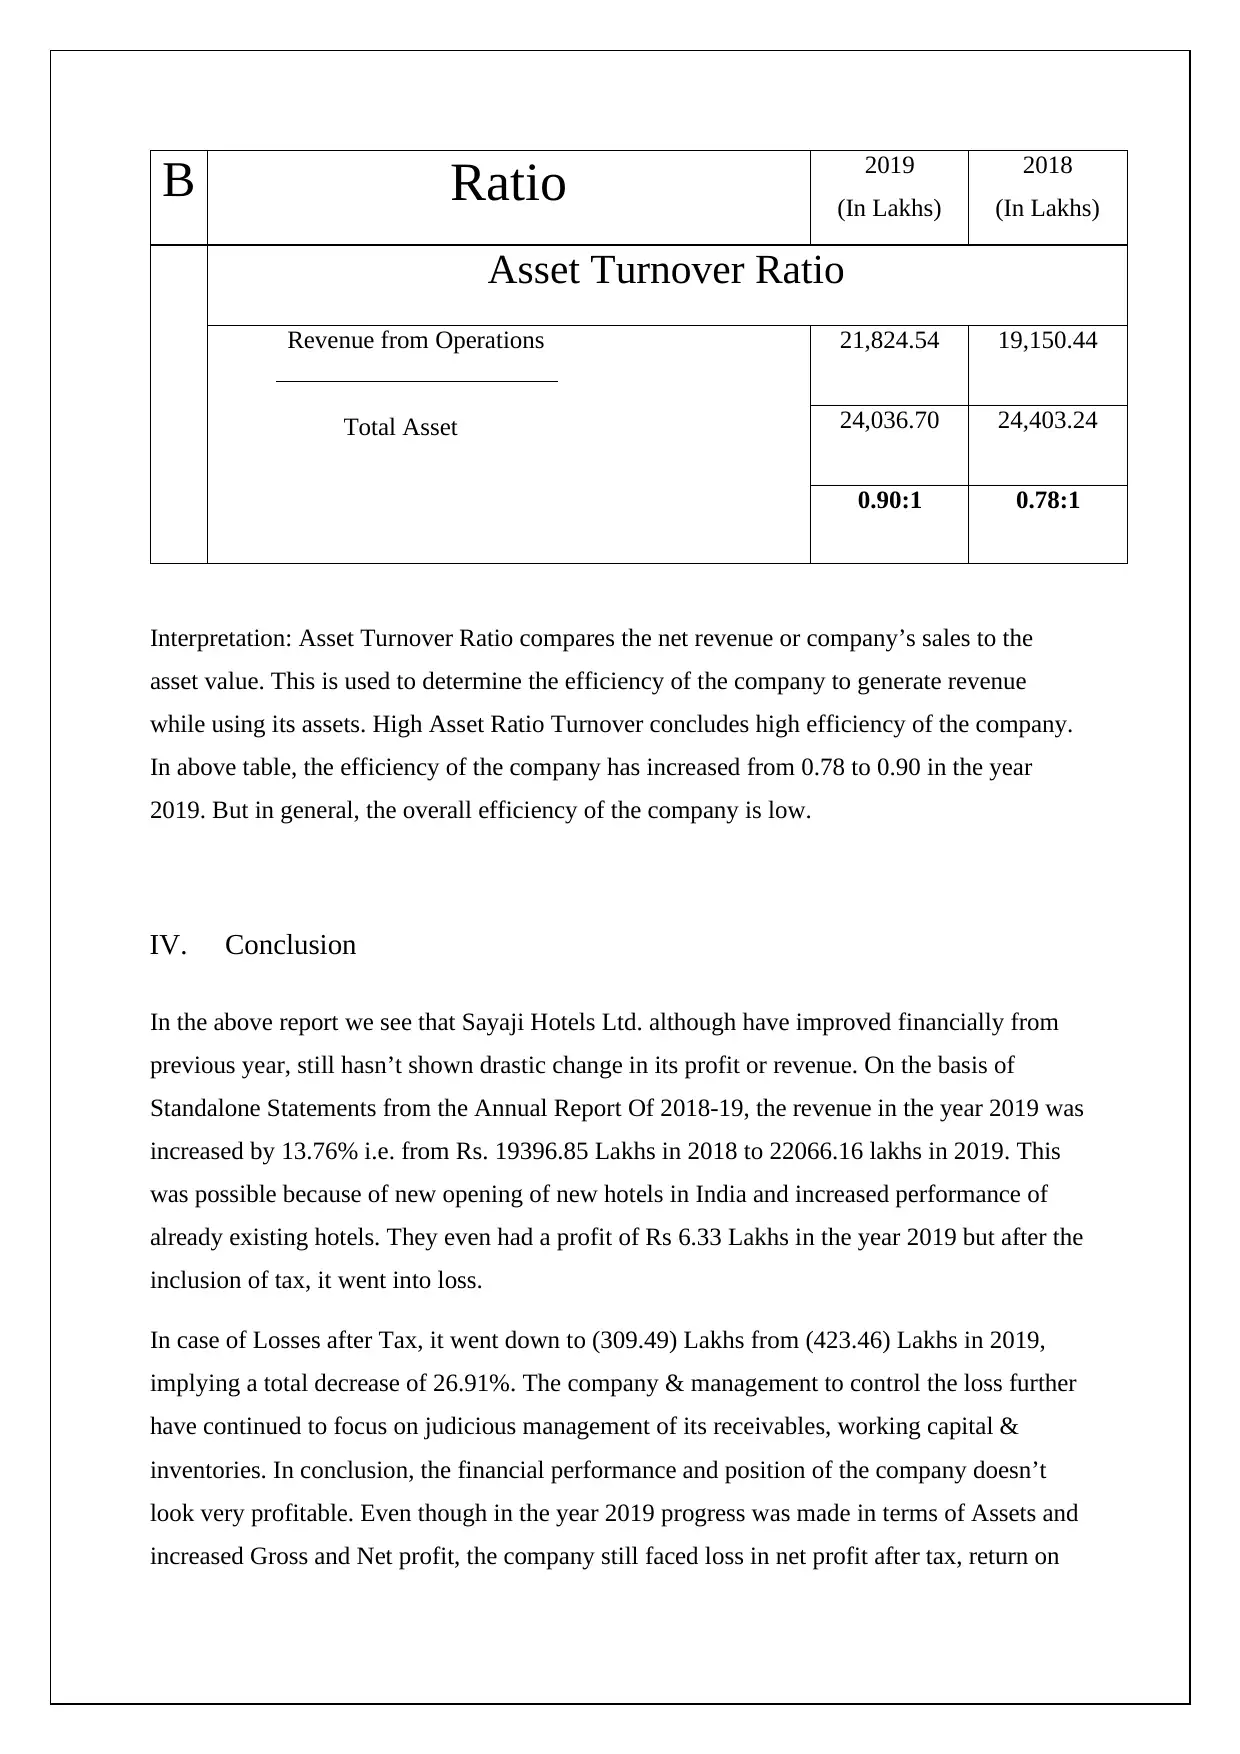
Asset Turnover Ratio
Revenue from Operations
Total Asset
21,824.54 19,150.44
24,036.70 24,403.24
0.90:1 0.78:1
Interpretation: Asset Turnover Ratio compares the net revenue or company’s sales to the
asset value. This is used to determine the efficiency of the company to generate revenue
while using its assets. High Asset Ratio Turnover concludes high efficiency of the company.
In above table, the efficiency of the company has increased from 0.78 to 0.90 in the year
2019. But in general, the overall efficiency of the company is low.
IV. Conclusion
In the above report we see that Sayaji Hotels Ltd. although have improved financially from
previous year, still hasn’t shown drastic change in its profit or revenue. On the basis of
Standalone Statements from the Annual Report Of 2018-19, the revenue in the year 2019 was
increased by 13.76% i.e. from Rs. 19396.85 Lakhs in 2018 to 22066.16 lakhs in 2019. This
was possible because of new opening of new hotels in India and increased performance of
already existing hotels. They even had a profit of Rs 6.33 Lakhs in the year 2019 but after the
inclusion of tax, it went into loss.
In case of Losses after Tax, it went down to (309.49) Lakhs from (423.46) Lakhs in 2019,
implying a total decrease of 26.91%. The company & management to control the loss further
have continued to focus on judicious management of its receivables, working capital &
inventories. In conclusion, the financial performance and position of the company doesn’t
look very profitable. Even though in the year 2019 progress was made in terms of Assets and
increased Gross and Net profit, the company still faced loss in net profit after tax, return on
(In Lakhs)
2018
(In Lakhs)
Asset Turnover Ratio
Revenue from Operations
Total Asset
21,824.54 19,150.44
24,036.70 24,403.24
0.90:1 0.78:1
Interpretation: Asset Turnover Ratio compares the net revenue or company’s sales to the
asset value. This is used to determine the efficiency of the company to generate revenue
while using its assets. High Asset Ratio Turnover concludes high efficiency of the company.
In above table, the efficiency of the company has increased from 0.78 to 0.90 in the year
2019. But in general, the overall efficiency of the company is low.
IV. Conclusion
In the above report we see that Sayaji Hotels Ltd. although have improved financially from
previous year, still hasn’t shown drastic change in its profit or revenue. On the basis of
Standalone Statements from the Annual Report Of 2018-19, the revenue in the year 2019 was
increased by 13.76% i.e. from Rs. 19396.85 Lakhs in 2018 to 22066.16 lakhs in 2019. This
was possible because of new opening of new hotels in India and increased performance of
already existing hotels. They even had a profit of Rs 6.33 Lakhs in the year 2019 but after the
inclusion of tax, it went into loss.
In case of Losses after Tax, it went down to (309.49) Lakhs from (423.46) Lakhs in 2019,
implying a total decrease of 26.91%. The company & management to control the loss further
have continued to focus on judicious management of its receivables, working capital &
inventories. In conclusion, the financial performance and position of the company doesn’t
look very profitable. Even though in the year 2019 progress was made in terms of Assets and
increased Gross and Net profit, the company still faced loss in net profit after tax, return on
Paraphrase This Document
Need a fresh take? Get an instant paraphrase of this document with our AI Paraphraser
capital employed and equity. Also the company didn’t have enough assets to cover up for
their debt. As an investor, financing or investing in Sayaji Hotels Ltd. would be risky
granting that they have shown improvement in the feasibility. Even after showing progress,
the company still lacks efficient managerial responsibility in terms of converting investment
into profitable revenue and which in turn does not give feasible return to the investors.
V. Bibliography
Jagels, M. G., & Coltman, M. M. (2004). HOSPITALITY MANAGEMENT ACCOUNTING
(8th ed.). New Jersey: John Wiley & Sons.
Schmidgall, R. (1990). Hospitality Industry Managerial Accounting. Michigan: American
Hotel & Motel Association.
Hales, J.A. (2011). Accounting and Financial Analysis in the Hospitality Industry. New
Delhi: Pearson Education, Inc.
Peavler, R. (2009, July 29). Profitability Ratio Analysis. Retrieved from The Balance Small
Business website: https://www.thebalancesmb.com/profitability-ratio-analysis393185
Atkinson, A. A. (2007). Management accounting. Upper Saddle River, N.J.: Pearson/Prentice
Hall.
DeFranco, A., & Lattin, T. (2009). Hospitality financial management. Hoboken, N.J.: Wiley.
Brown, J. (2001). Management Accounting for Hospitality and Tourism. International
Journal Of Hospitality Management, 20(1), 101-102. doi: 10.1016/s0278-4319(00)00029-3
Sharan, V. (2009). Fundamentals of Financial Management. 2nd ed. New Delhi: Pearson
Education, Inc
⊘ This is a preview!⊘
Do you want full access?
Subscribe today to unlock all pages.
Trusted by 1+ million students worldwide
1 out of 12
Related Documents


Your All-in-One AI-Powered Toolkit for Academic Success.
+13062052269
info@desklib.com
Available 24*7 on WhatsApp / Email
![[object Object]](/_next/static/media/star-bottom.7253800d.svg)
Unlock your academic potential
Copyright © 2020–2026 A2Z Services. All Rights Reserved. Developed and managed by ZUCOL.