SC5001 Measuring and Interpreting Crime 2021-22: Detailed Analysis
VerifiedAdded on  2023/06/14
|10
|1440
|196
Homework Assignment
AI Summary
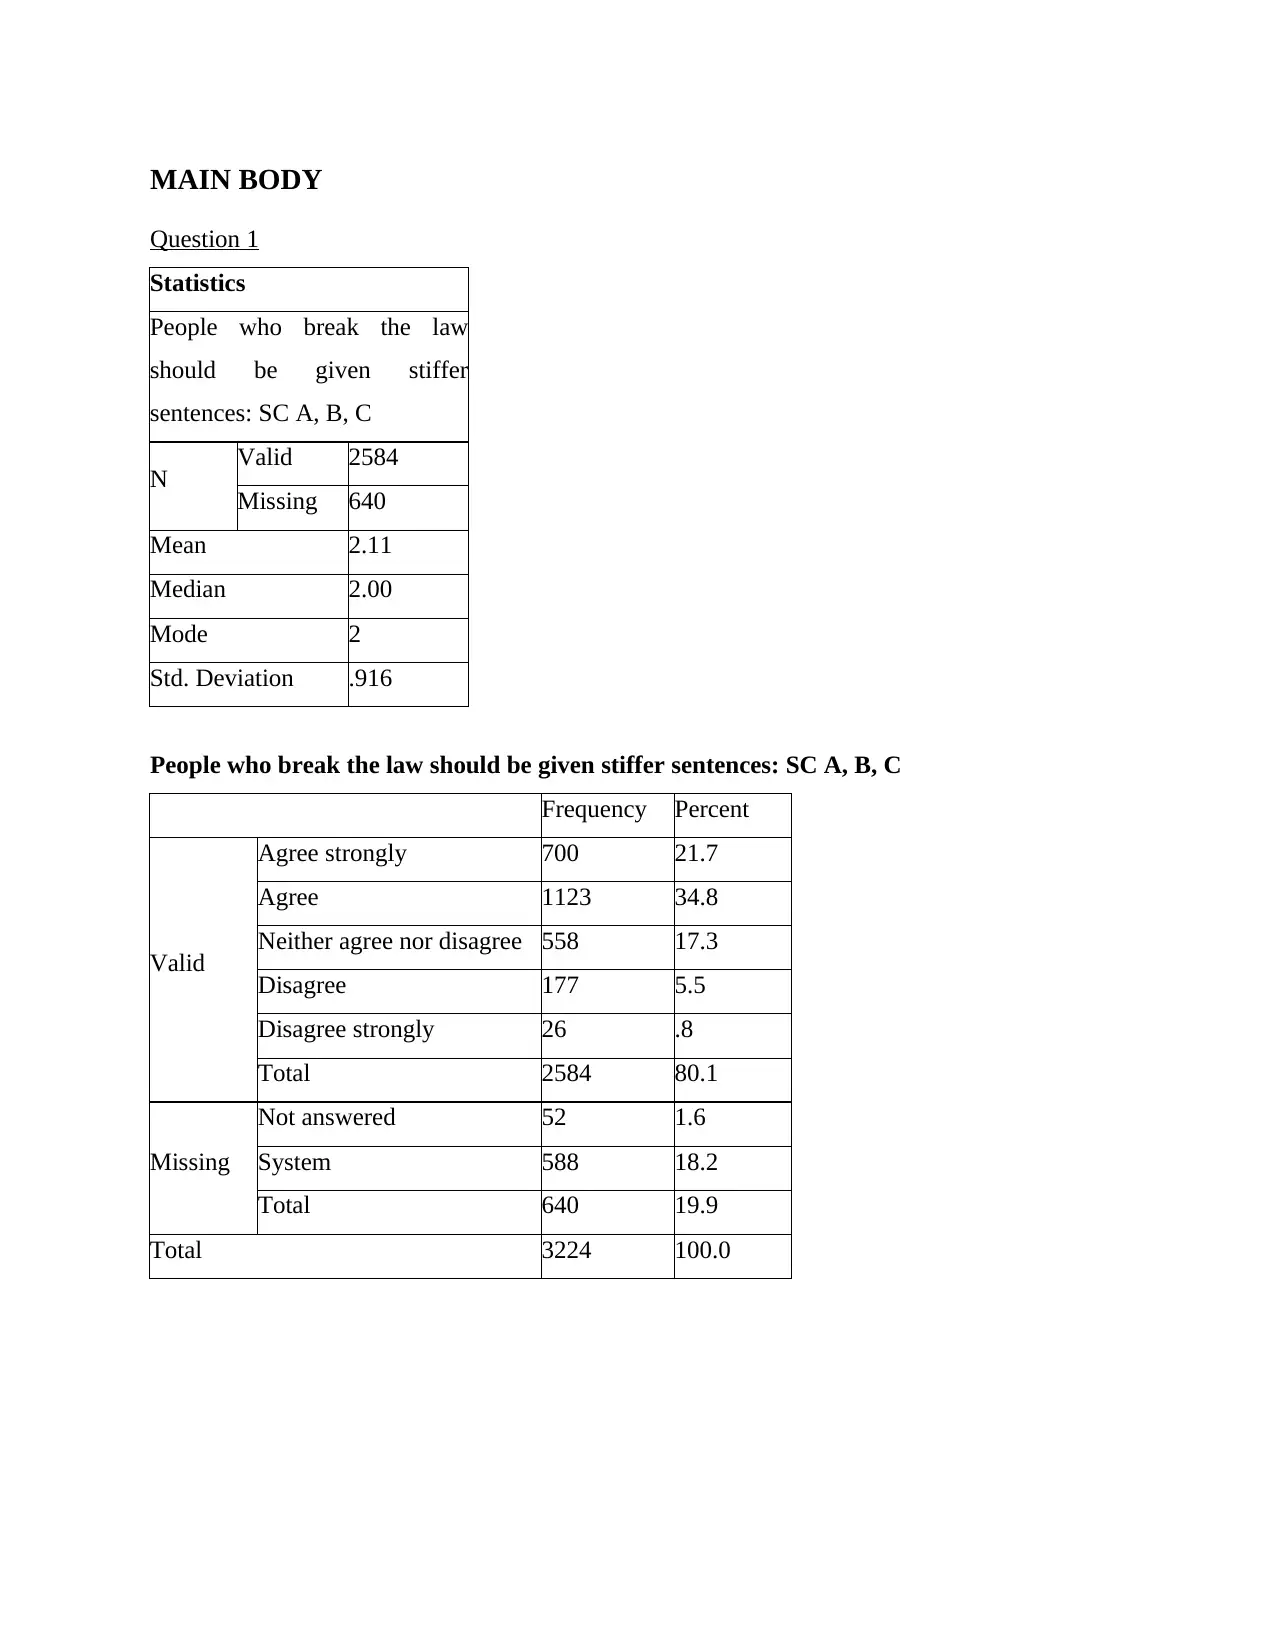
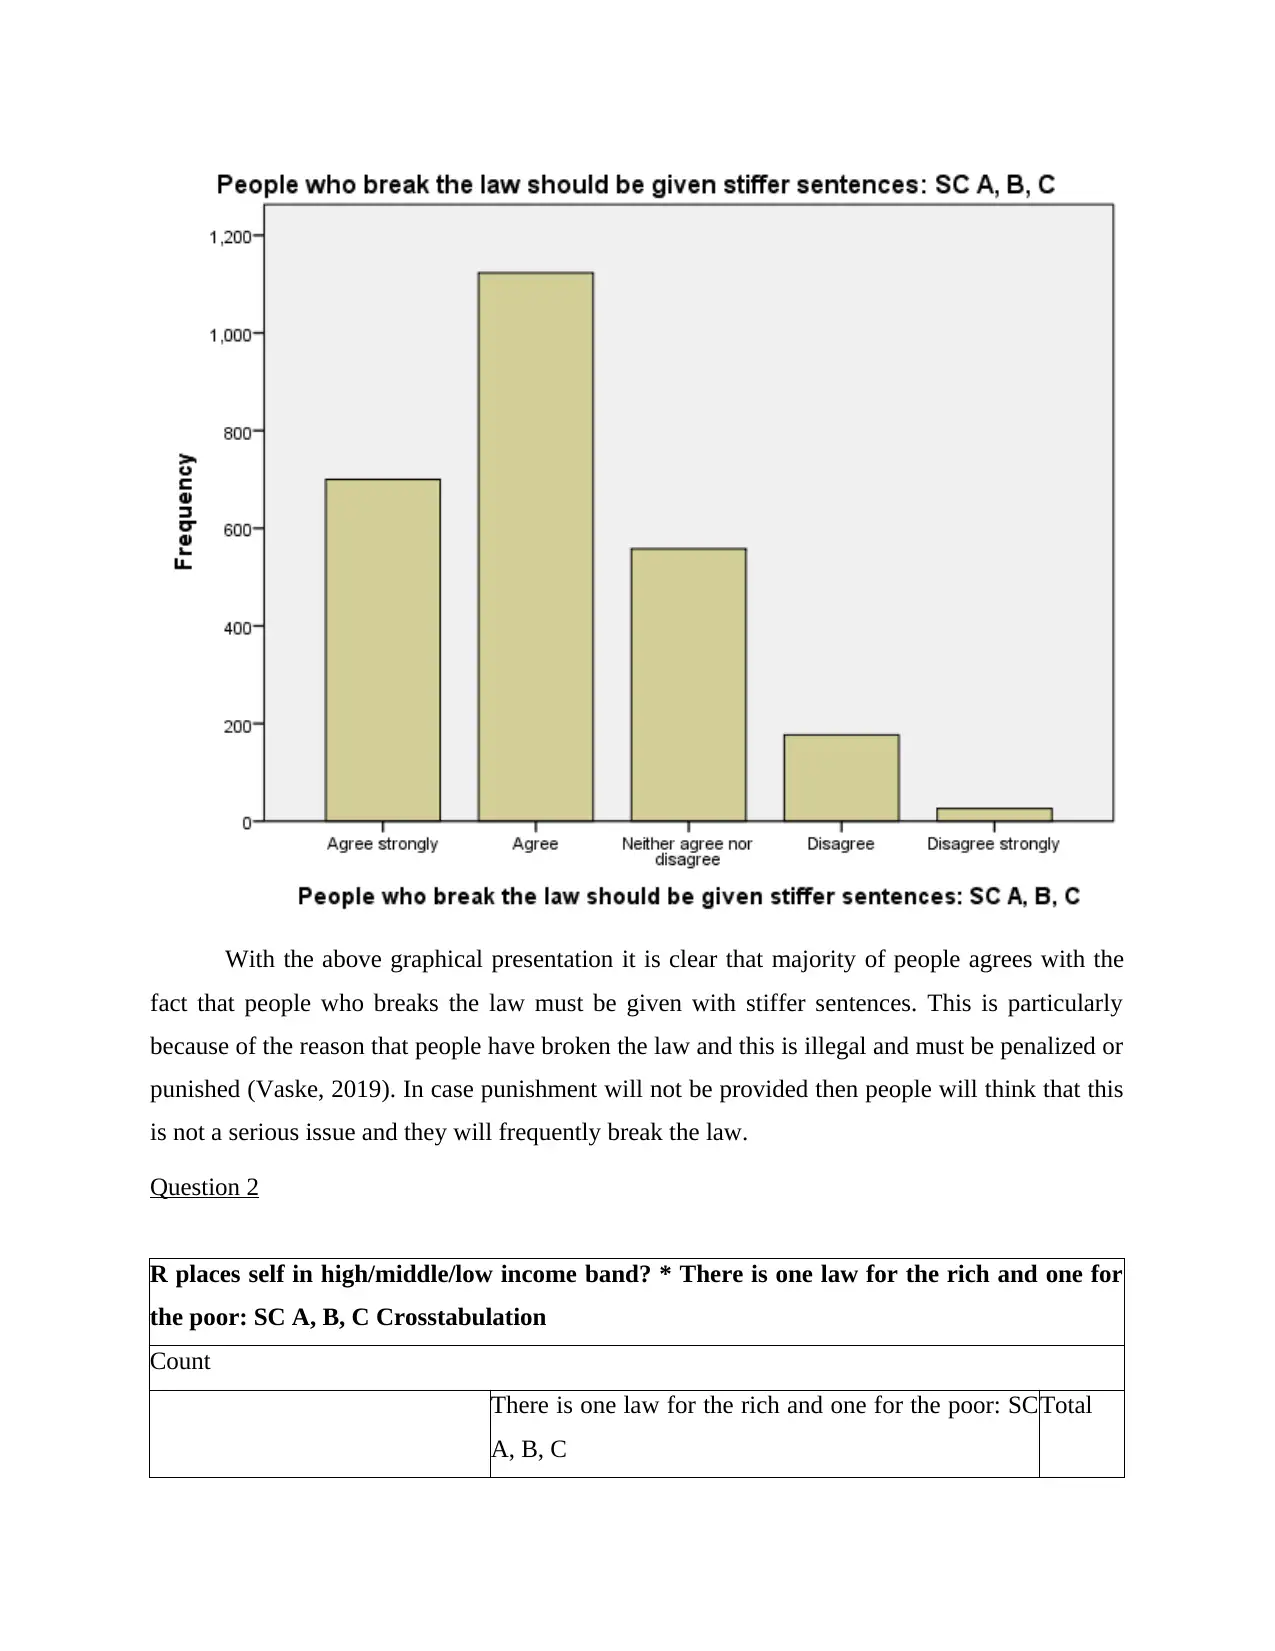
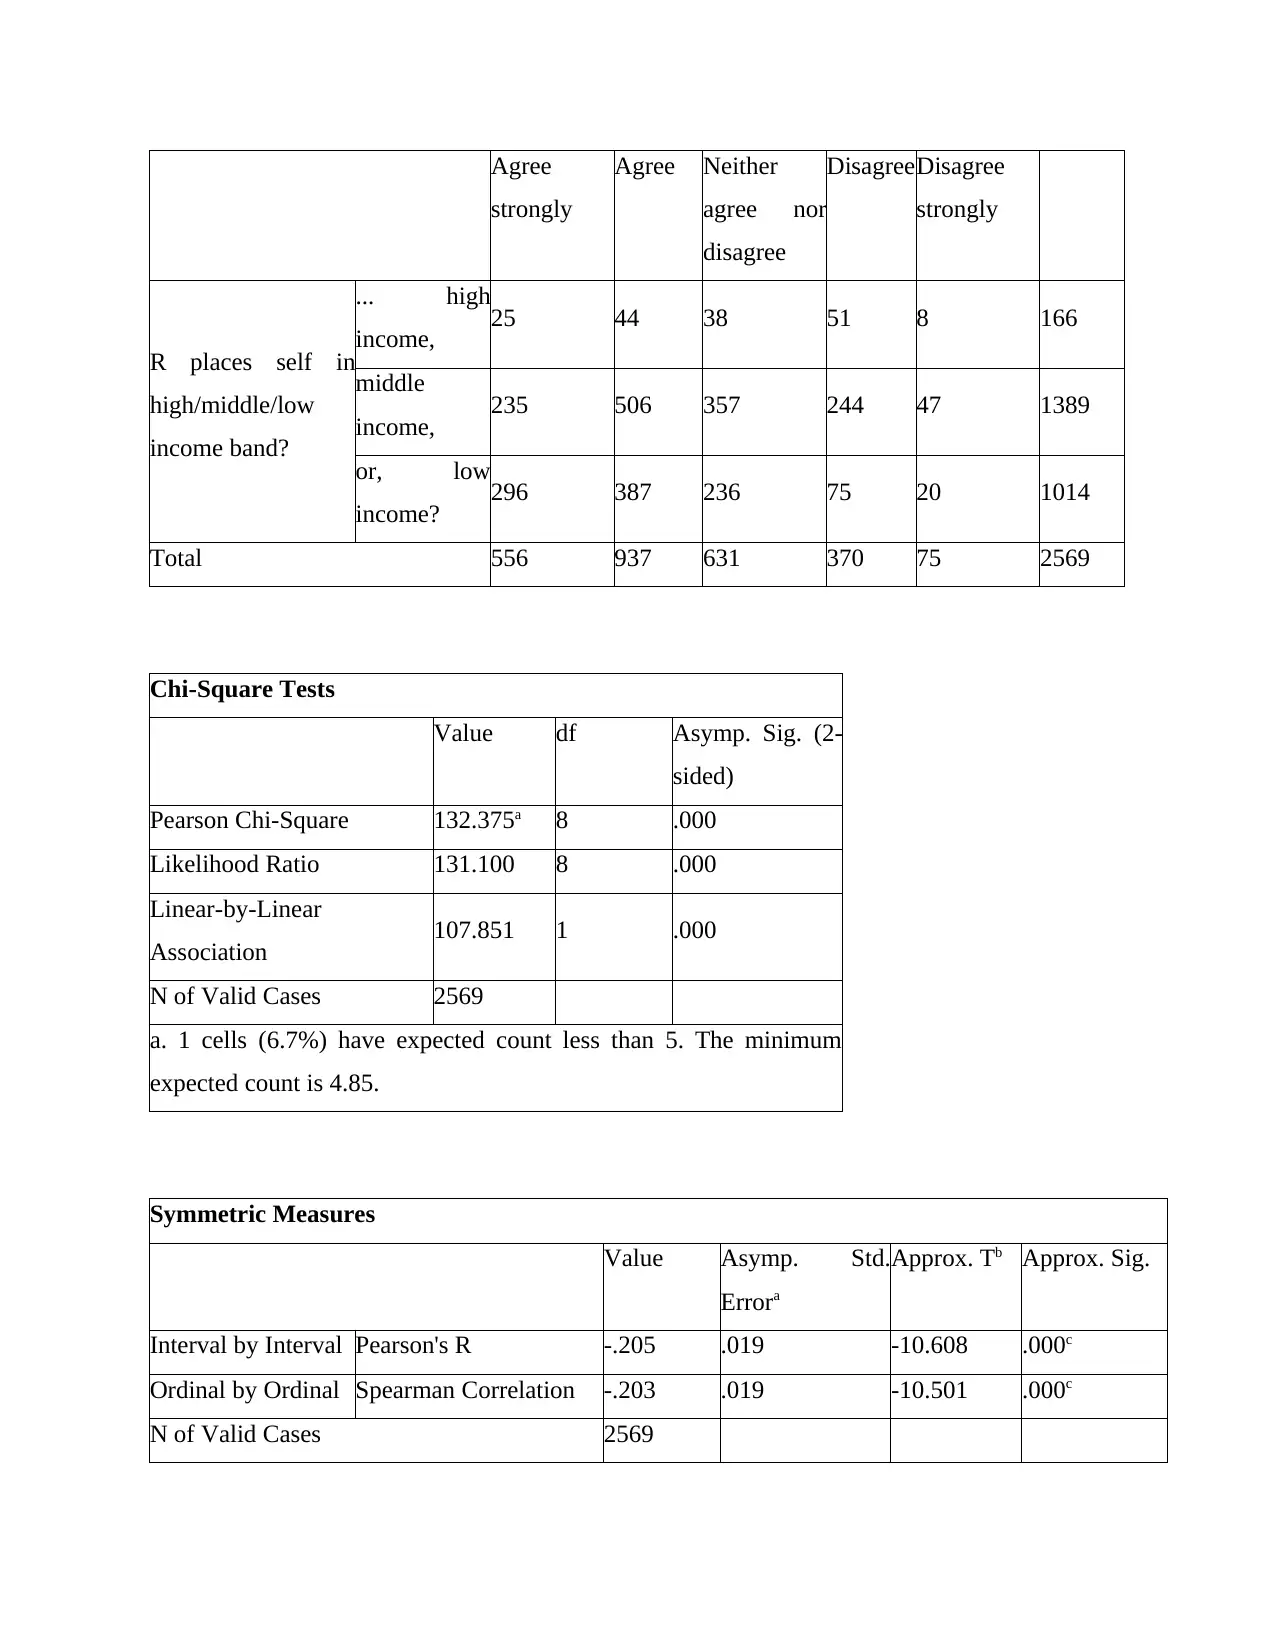
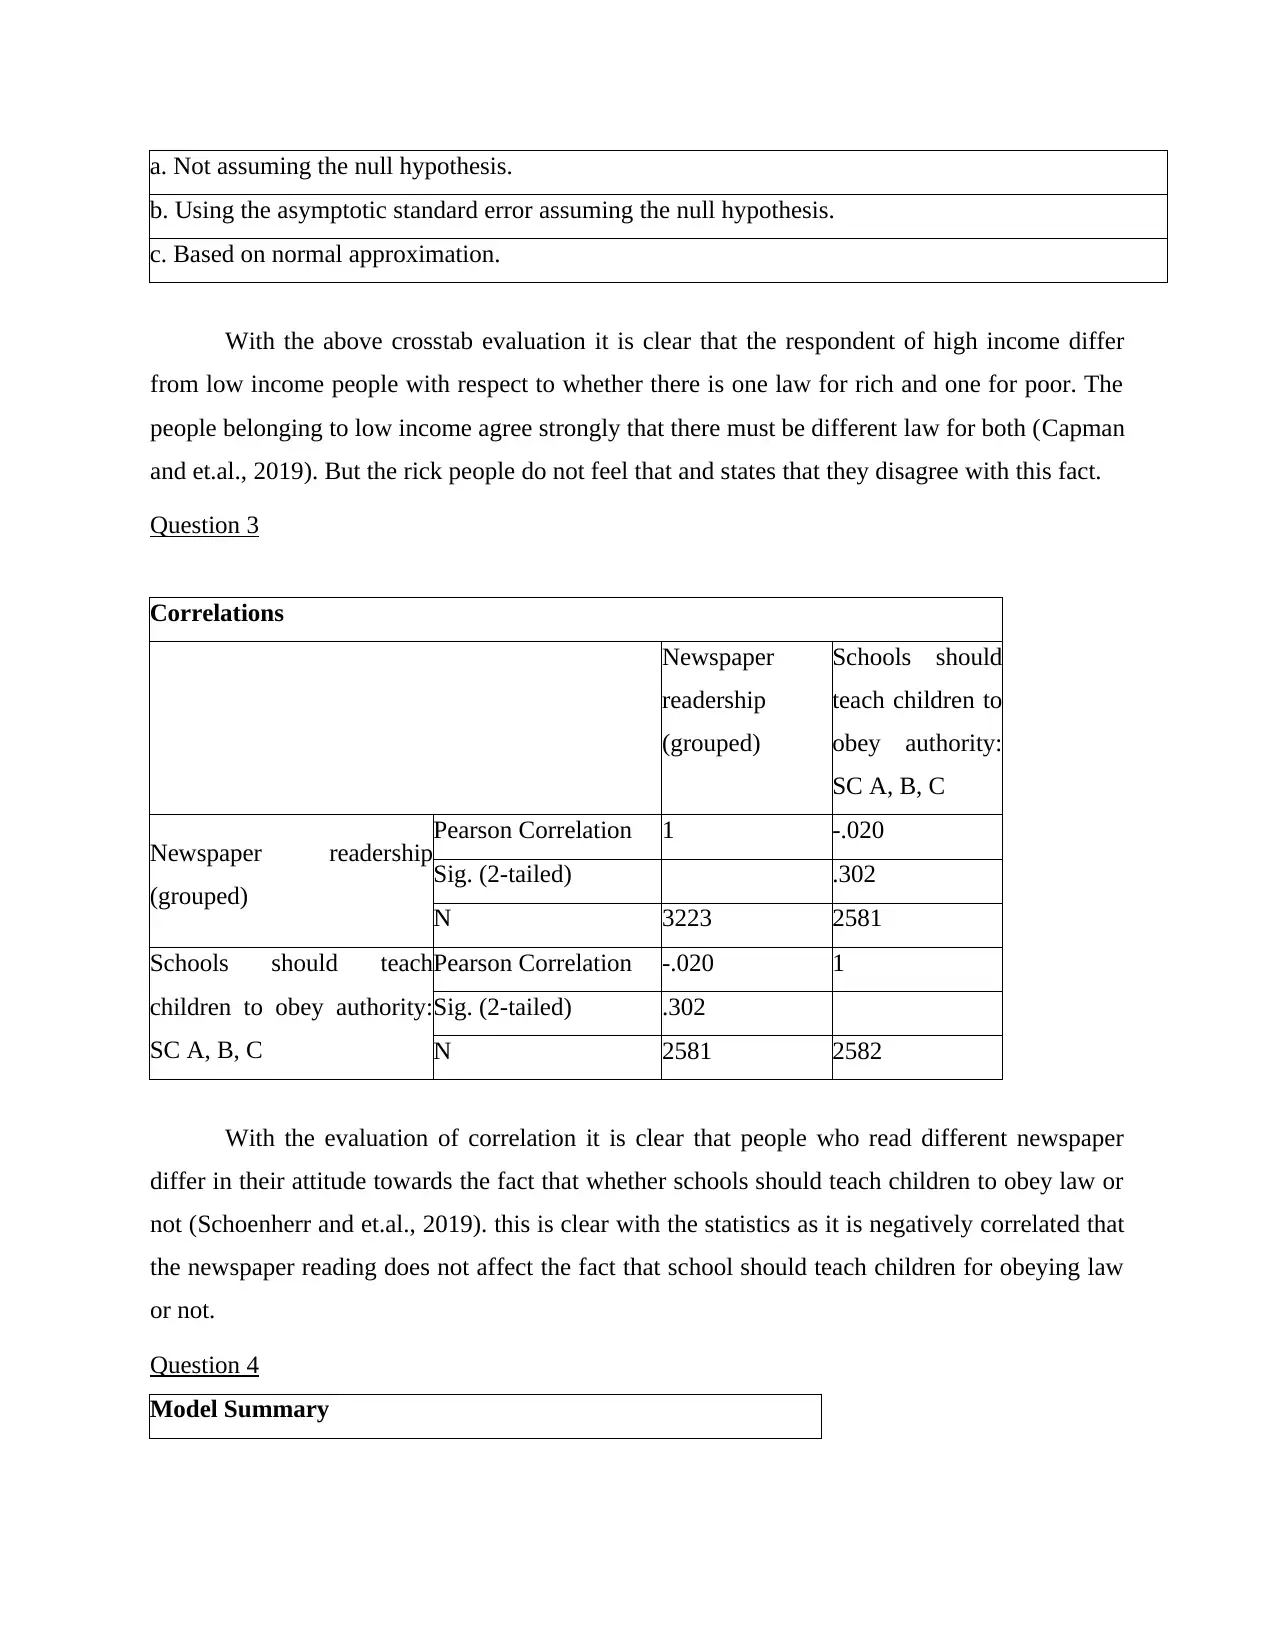
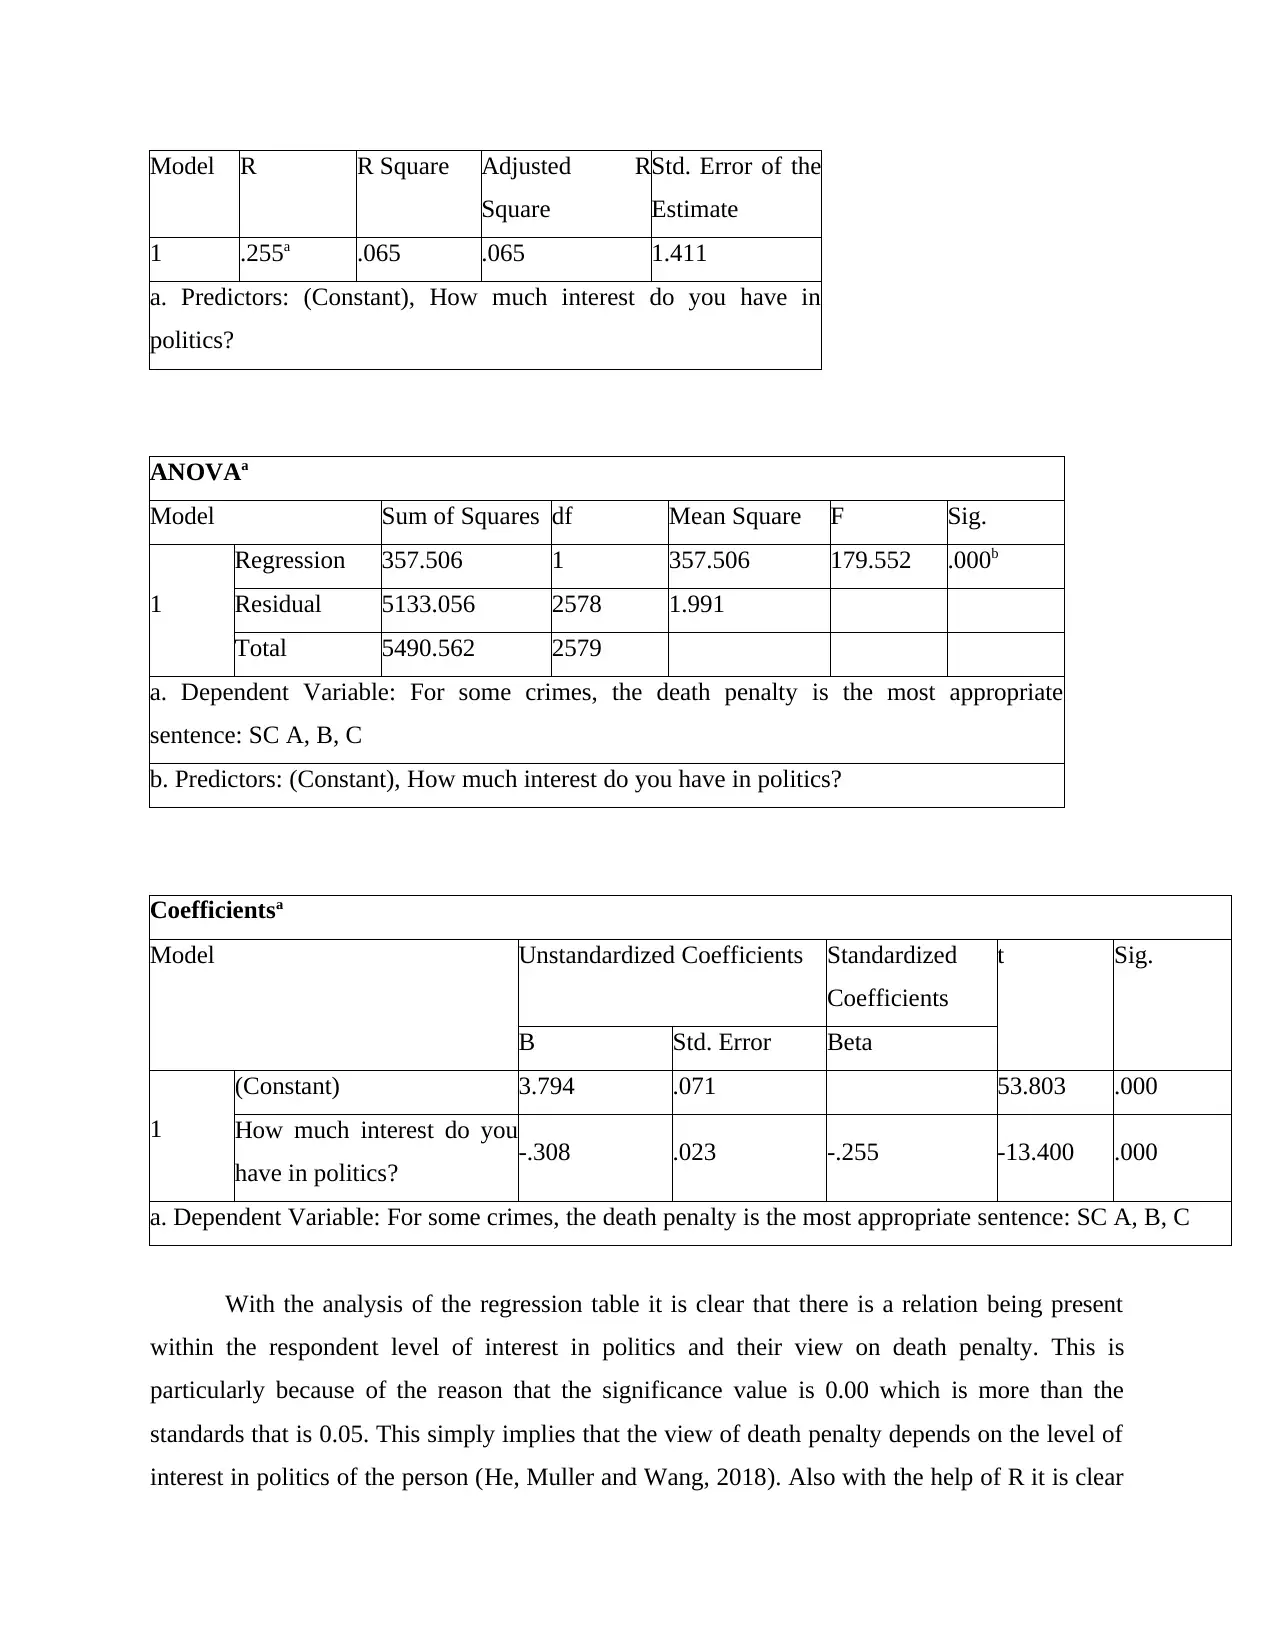
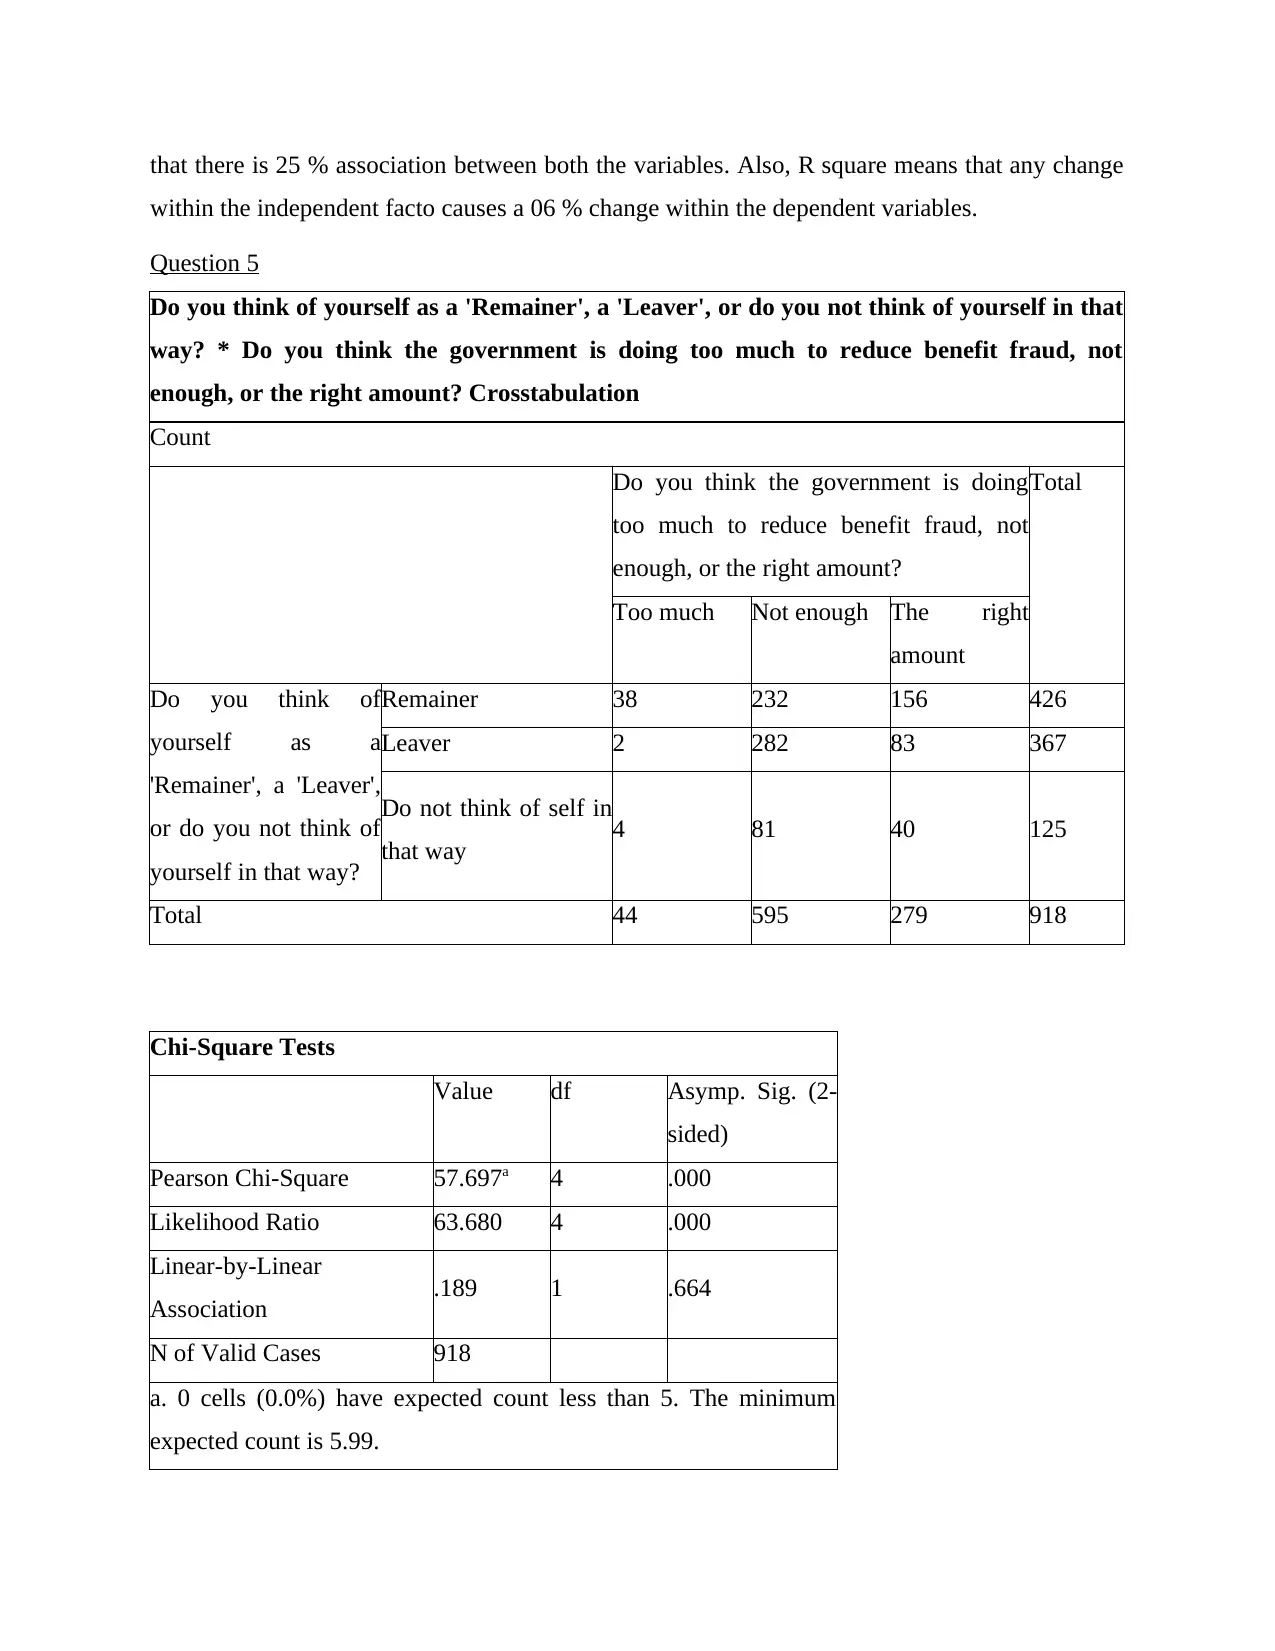
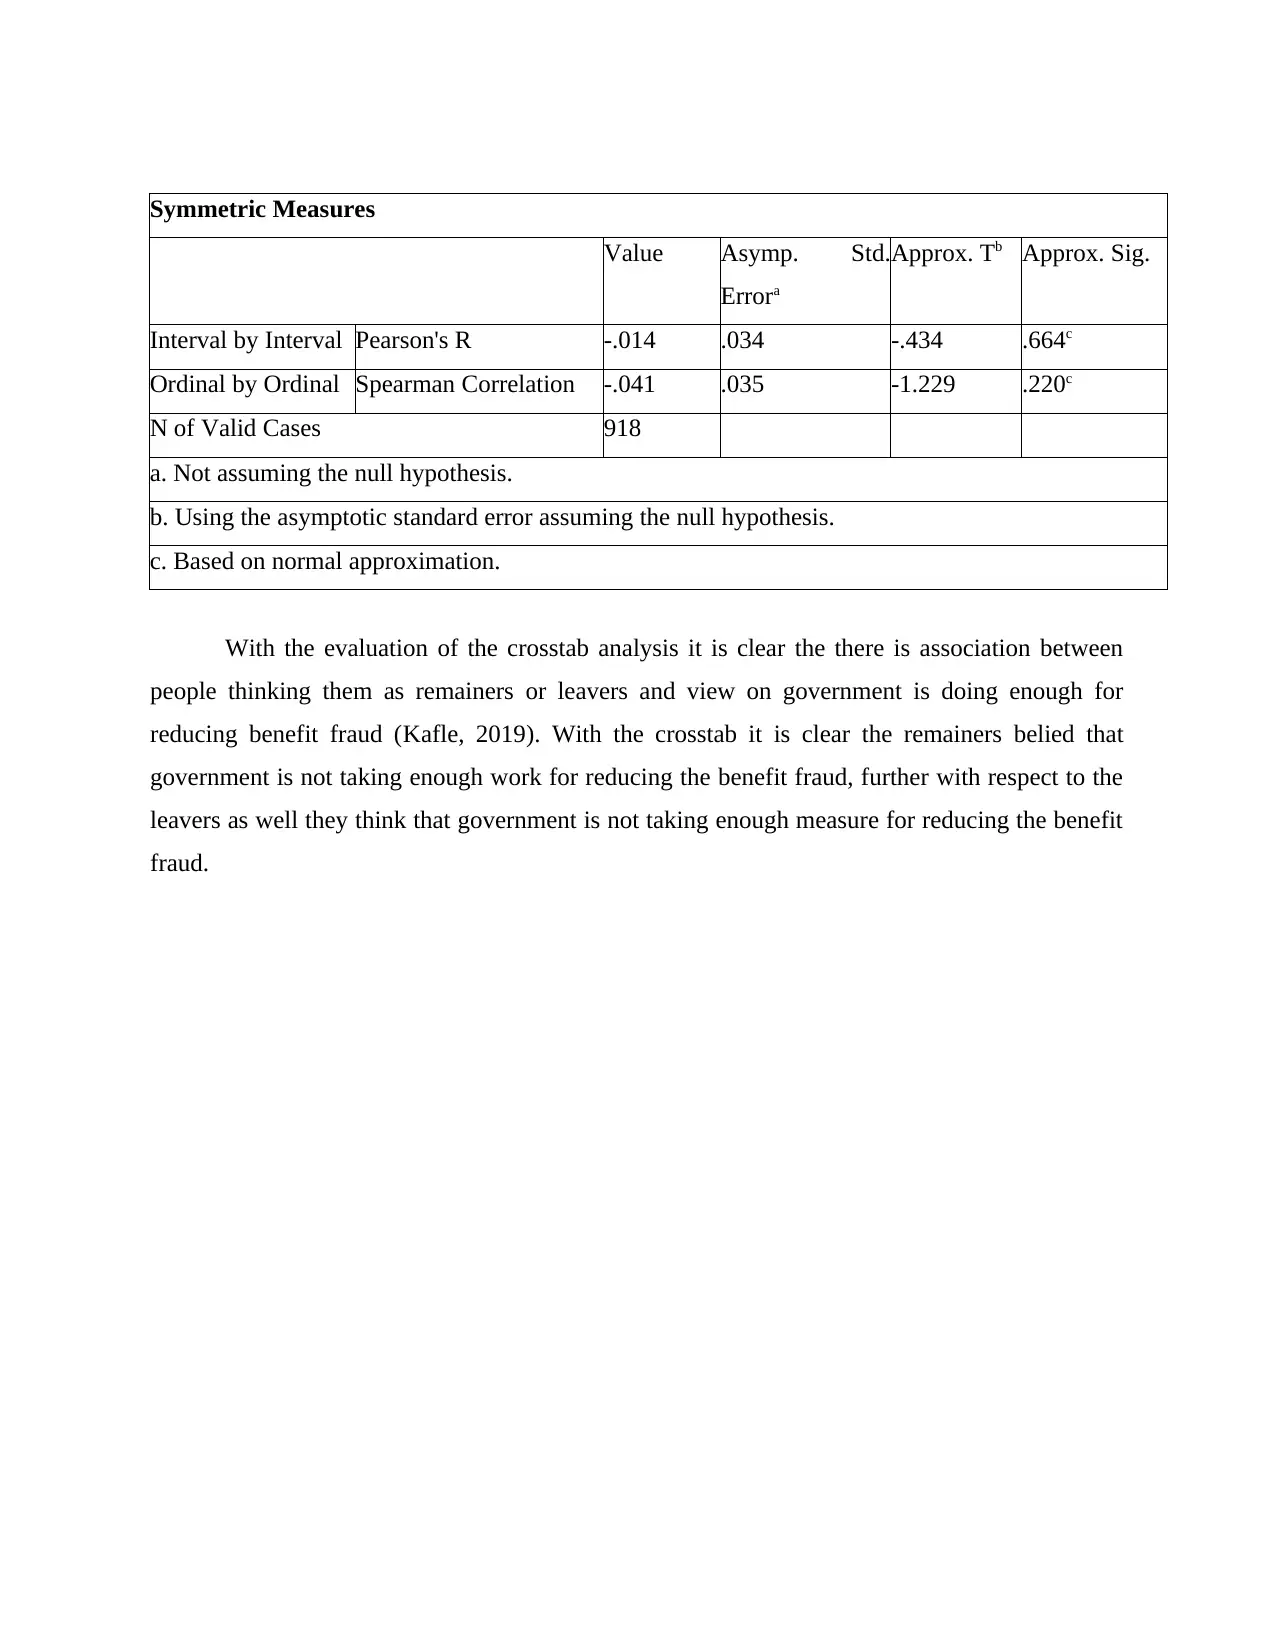
This assignment provides a detailed statistical analysis of crime-related data, addressing five key questions using SPSS. It interprets graphical presentations to show public opinion on stricter sentences for lawbreakers, analyzes cross-tabulations to compare views of high and low-income individuals on legal equality, and evaluates correlations to determine the influence of newspaper readership on attitudes toward schools teaching obedience to authority. Regression analysis explores the relationship between interest in politics and views on the death penalty, while another cross-tabulation examines the association between identifying as a 'Remainer' or 'Leaver' and opinions on the government's efforts to reduce benefit fraud. The analysis uses statistical measures such as mean, median, mode, standard deviation, chi-square tests, Pearson's R, and R-square to draw conclusions and support interpretations, referencing academic sources to contextualize the findings. Desklib offers more resources for students, including similar solved assignments and past papers.

SC5001 Measuring and
Interpreting Crime 2021 22
Paraphrase This Document
Need a fresh take? Get an instant paraphrase of this document with our AI Paraphraser

TABLE OF CONTENTS
MAIN BODY...................................................................................................................................3
Question 1...................................................................................................................................3
Question 2...................................................................................................................................4
Question 3...................................................................................................................................6
Question 4...................................................................................................................................6
Question 5...................................................................................................................................8
REFERENCES..............................................................................................................................10

MAIN BODY
Question 1
Statistics
People who break the law
should be given stiffer
sentences: SC A, B, C
N Valid 2584
Missing 640
Mean 2.11
Median 2.00
Mode 2
Std. Deviation .916
People who break the law should be given stiffer sentences: SC A, B, C
Frequency Percent
Valid
Agree strongly 700 21.7
Agree 1123 34.8
Neither agree nor disagree 558 17.3
Disagree 177 5.5
Disagree strongly 26 .8
Total 2584 80.1
Missing
Not answered 52 1.6
System 588 18.2
Total 640 19.9
Total 3224 100.0
⊘ This is a preview!⊘
Do you want full access?
Subscribe today to unlock all pages.

Trusted by 1+ million students worldwide

With the above graphical presentation it is clear that majority of people agrees with the
fact that people who breaks the law must be given with stiffer sentences. This is particularly
because of the reason that people have broken the law and this is illegal and must be penalized or
punished (Vaske, 2019). In case punishment will not be provided then people will think that this
is not a serious issue and they will frequently break the law.
Question 2
R places self in high/middle/low income band? * There is one law for the rich and one for
the poor: SC A, B, C Crosstabulation
Count
There is one law for the rich and one for the poor: SC
A, B, C
Total
Paraphrase This Document
Need a fresh take? Get an instant paraphrase of this document with our AI Paraphraser

Agree
strongly
Agree Neither
agree nor
disagree
DisagreeDisagree
strongly
R places self in
high/middle/low
income band?
... high
income, 25 44 38 51 8 166
middle
income, 235 506 357 244 47 1389
or, low
income? 296 387 236 75 20 1014
Total 556 937 631 370 75 2569
Chi-Square Tests
Value df Asymp. Sig. (2-
sided)
Pearson Chi-Square 132.375a 8 .000
Likelihood Ratio 131.100 8 .000
Linear-by-Linear
Association 107.851 1 .000
N of Valid Cases 2569
a. 1 cells (6.7%) have expected count less than 5. The minimum
expected count is 4.85.
Symmetric Measures
Value Asymp. Std.
Errora
Approx. Tb Approx. Sig.
Interval by Interval Pearson's R -.205 .019 -10.608 .000c
Ordinal by Ordinal Spearman Correlation -.203 .019 -10.501 .000c
N of Valid Cases 2569
strongly
Agree Neither
agree nor
disagree
DisagreeDisagree
strongly
R places self in
high/middle/low
income band?
... high
income, 25 44 38 51 8 166
middle
income, 235 506 357 244 47 1389
or, low
income? 296 387 236 75 20 1014
Total 556 937 631 370 75 2569
Chi-Square Tests
Value df Asymp. Sig. (2-
sided)
Pearson Chi-Square 132.375a 8 .000
Likelihood Ratio 131.100 8 .000
Linear-by-Linear
Association 107.851 1 .000
N of Valid Cases 2569
a. 1 cells (6.7%) have expected count less than 5. The minimum
expected count is 4.85.
Symmetric Measures
Value Asymp. Std.
Errora
Approx. Tb Approx. Sig.
Interval by Interval Pearson's R -.205 .019 -10.608 .000c
Ordinal by Ordinal Spearman Correlation -.203 .019 -10.501 .000c
N of Valid Cases 2569

a. Not assuming the null hypothesis.
b. Using the asymptotic standard error assuming the null hypothesis.
c. Based on normal approximation.
With the above crosstab evaluation it is clear that the respondent of high income differ
from low income people with respect to whether there is one law for rich and one for poor. The
people belonging to low income agree strongly that there must be different law for both (Capman
and et.al., 2019). But the rick people do not feel that and states that they disagree with this fact.
Question 3
Correlations
Newspaper
readership
(grouped)
Schools should
teach children to
obey authority:
SC A, B, C
Newspaper readership
(grouped)
Pearson Correlation 1 -.020
Sig. (2-tailed) .302
N 3223 2581
Schools should teach
children to obey authority:
SC A, B, C
Pearson Correlation -.020 1
Sig. (2-tailed) .302
N 2581 2582
With the evaluation of correlation it is clear that people who read different newspaper
differ in their attitude towards the fact that whether schools should teach children to obey law or
not (Schoenherr and et.al., 2019). this is clear with the statistics as it is negatively correlated that
the newspaper reading does not affect the fact that school should teach children for obeying law
or not.
Question 4
Model Summary
⊘ This is a preview!⊘
Do you want full access?
Subscribe today to unlock all pages.

Trusted by 1+ million students worldwide

Model R R Square Adjusted R
Square
Std. Error of the
Estimate
1 .255a .065 .065 1.411
a. Predictors: (Constant), How much interest do you have in
politics?
ANOVAa
Model Sum of Squares df Mean Square F Sig.
1
Regression 357.506 1 357.506 179.552 .000b
Residual 5133.056 2578 1.991
Total 5490.562 2579
a. Dependent Variable: For some crimes, the death penalty is the most appropriate
sentence: SC A, B, C
b. Predictors: (Constant), How much interest do you have in politics?
Coefficientsa
Model Unstandardized Coefficients Standardized
Coefficients
t Sig.
B Std. Error Beta
1
(Constant) 3.794 .071 53.803 .000
How much interest do you
have in politics? -.308 .023 -.255 -13.400 .000
a. Dependent Variable: For some crimes, the death penalty is the most appropriate sentence: SC A, B, C
With the analysis of the regression table it is clear that there is a relation being present
within the respondent level of interest in politics and their view on death penalty. This is
particularly because of the reason that the significance value is 0.00 which is more than the
standards that is 0.05. This simply implies that the view of death penalty depends on the level of
interest in politics of the person (He, Muller and Wang, 2018). Also with the help of R it is clear
Paraphrase This Document
Need a fresh take? Get an instant paraphrase of this document with our AI Paraphraser

that there is 25 % association between both the variables. Also, R square means that any change
within the independent facto causes a 06 % change within the dependent variables.
Question 5
Do you think of yourself as a 'Remainer', a 'Leaver', or do you not think of yourself in that
way? * Do you think the government is doing too much to reduce benefit fraud, not
enough, or the right amount? Crosstabulation
Count
Do you think the government is doing
too much to reduce benefit fraud, not
enough, or the right amount?
Total
Too much Not enough The right
amount
Do you think of
yourself as a
'Remainer', a 'Leaver',
or do you not think of
yourself in that way?
Remainer 38 232 156 426
Leaver 2 282 83 367
Do not think of self in
that way 4 81 40 125
Total 44 595 279 918
Chi-Square Tests
Value df Asymp. Sig. (2-
sided)
Pearson Chi-Square 57.697a 4 .000
Likelihood Ratio 63.680 4 .000
Linear-by-Linear
Association .189 1 .664
N of Valid Cases 918
a. 0 cells (0.0%) have expected count less than 5. The minimum
expected count is 5.99.

Symmetric Measures
Value Asymp. Std.
Errora
Approx. Tb Approx. Sig.
Interval by Interval Pearson's R -.014 .034 -.434 .664c
Ordinal by Ordinal Spearman Correlation -.041 .035 -1.229 .220c
N of Valid Cases 918
a. Not assuming the null hypothesis.
b. Using the asymptotic standard error assuming the null hypothesis.
c. Based on normal approximation.
With the evaluation of the crosstab analysis it is clear the there is association between
people thinking them as remainers or leavers and view on government is doing enough for
reducing benefit fraud (Kafle, 2019). With the crosstab it is clear the remainers belied that
government is not taking enough work for reducing the benefit fraud, further with respect to the
leavers as well they think that government is not taking enough measure for reducing the benefit
fraud.
⊘ This is a preview!⊘
Do you want full access?
Subscribe today to unlock all pages.

Trusted by 1+ million students worldwide

REFERENCES
Books and Journals
Capman, N. S. S., and et.al., 2019. Comparison of multiple and logistic regression analyses of
relativistic electron flux enhancement at geosynchronous orbit following storms. Journal
of Geophysical Research: Space Physics. 124(12). pp.10246-10256.
He, G., Muller, H. G. and Wang, J. L., 2018. Extending correlation and regression from
multivariate to functional data. In Asymptotics in statistics and probability (pp. 197-210).
De Gruyter.
Kafle, S. C., 2019. Correlation and Regression Analysis Using SPSS. Management, Technology
& Social Sciences, p.126.
Schoenherr, D., and et.al., 2019. Identification of movement synchrony: Validation of windowed
cross-lagged correlation and-regression with peak-picking algorithm. PloS one. 14(2).
p.e0211494.
Vaske, J. J., 2019. Survey research and analysis. Sagamore-Venture. 1807 North Federal Drive,
Urbana, IL 61801.
1 out of 10
Your All-in-One AI-Powered Toolkit for Academic Success.
 +13062052269
info@desklib.com
Available 24*7 on WhatsApp / Email
Unlock your academic potential
Copyright © 2020–2025 A2Z Services. All Rights Reserved. Developed and managed by ZUCOL.