Comprehensive 5E Lesson Plan: Weather in Science for Year 2
VerifiedAdded on 2021/04/21
|13
|2238
|106
Homework Assignment
AI Summary
This assignment is a 5E lesson plan designed for Year 2 science students, focusing on the topic of weather. It introduces the concept of weather, its formation, and the factors influencing it. The plan outlines five sequential learning experiences over a week, including activities on seasons and weather, tools for recording weather, using graphs to represent weather information, and exploring different types of clouds. The lesson plan incorporates key vocabulary, learning intentions, starter tasks, main lesson activities, extension challenges, and plenary sessions. It also details assessment methods, differentiation strategies, and teacher/student resources, aiming to enhance students' understanding of weather phenomena, including seasons, temperature, rainfall, and cloud formations. The plan emphasizes engagement, exploration, and evaluation to facilitate a comprehensive learning experience. The student's work also highlights the challenges encountered by learners such as differentiating between wind vane and wind sock and how the challenges were mitigated.
Name: ______________________________ Class _______________
5E Planner for Learning in Science and Maths
Introduction: Context for learning:
Weather
For a weather to occur there must be presence of the atmosphere, which comprises of gasses, for
example oxygen that we breathe in that will surround the earth.
Therefore weather will be defined as the state of the atmosphere at every period of time.
Factors that result to formation of weather.
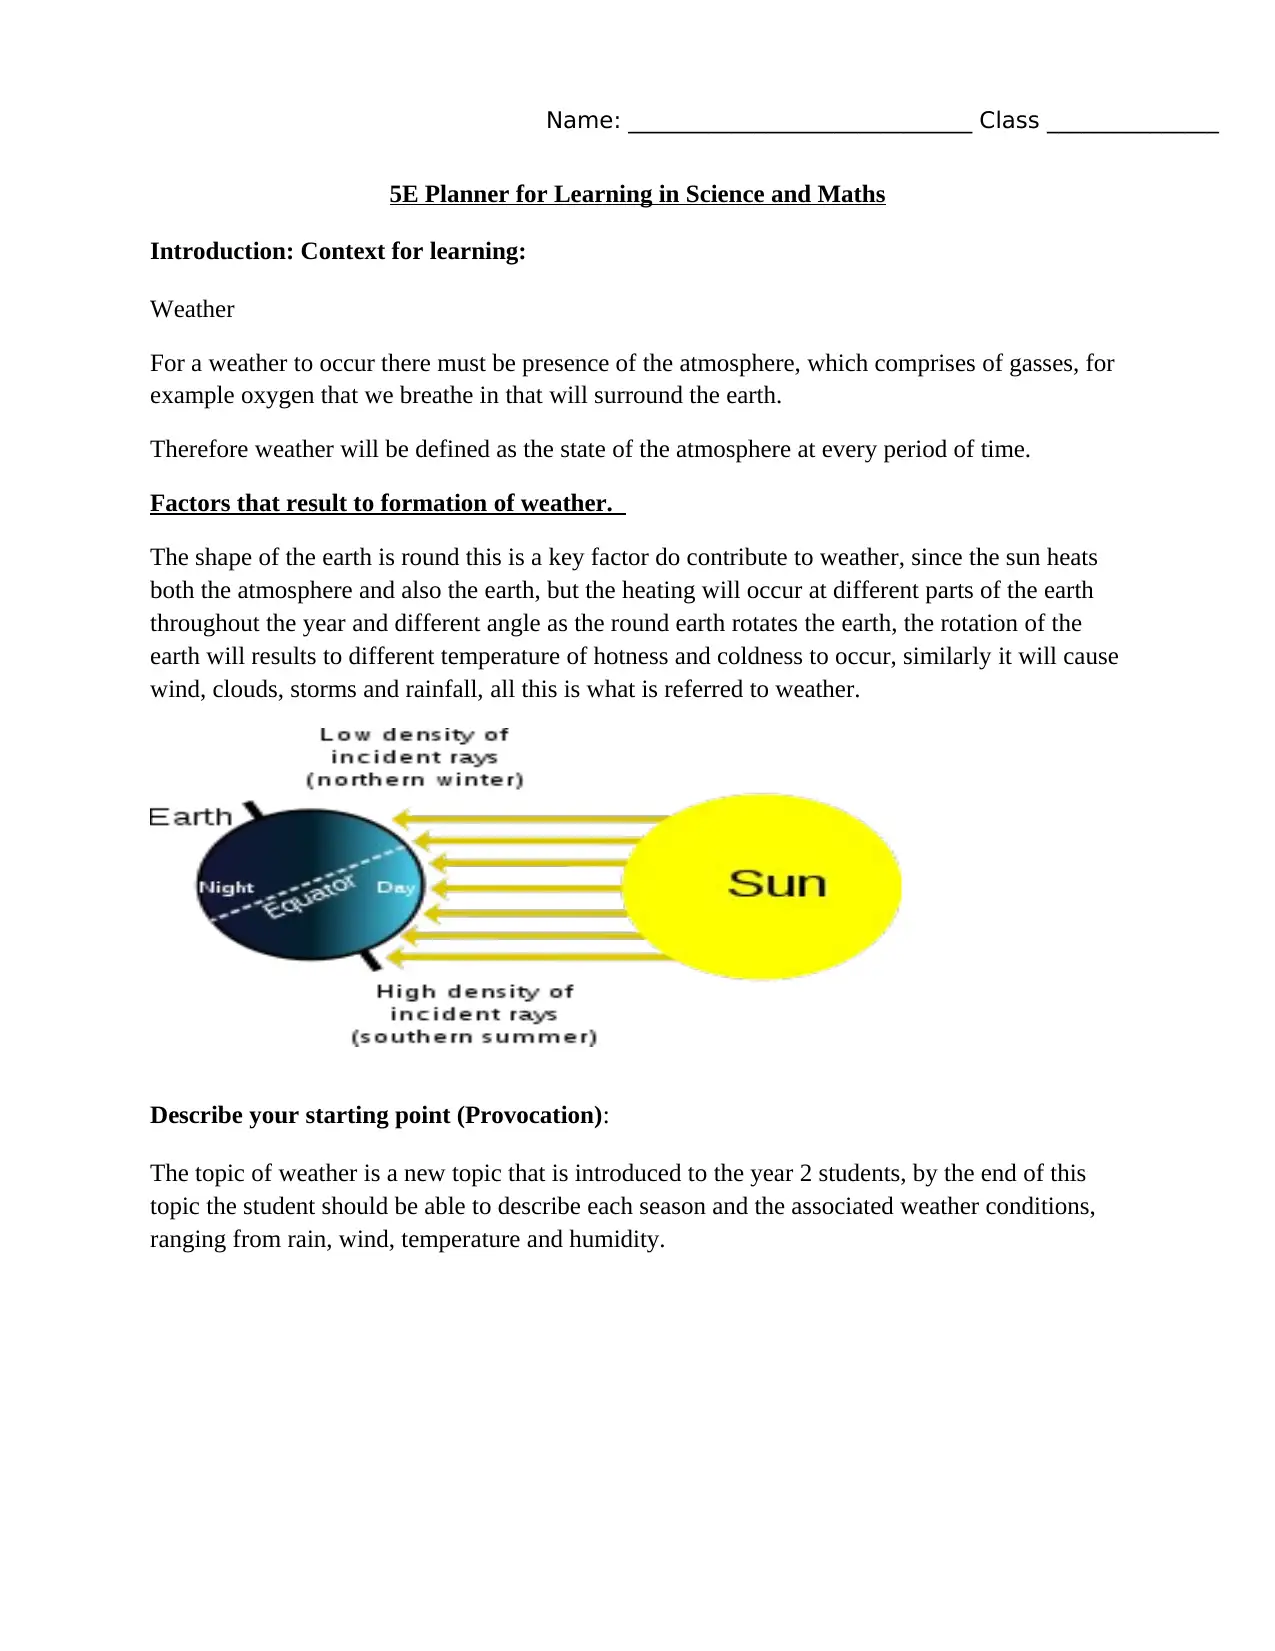
The shape of the earth is round this is a key factor do contribute to weather, since the sun heats
both the atmosphere and also the earth, but the heating will occur at different parts of the earth
throughout the year and different angle as the round earth rotates the earth, the rotation of the
earth will results to different temperature of hotness and coldness to occur, similarly it will cause
wind, clouds, storms and rainfall, all this is what is referred to weather.
Describe your starting point (Provocation):
The topic of weather is a new topic that is introduced to the year 2 students, by the end of this
topic the student should be able to describe each season and the associated weather conditions,
ranging from rain, wind, temperature and humidity.
5E Planner for Learning in Science and Maths
Introduction: Context for learning:
Weather
For a weather to occur there must be presence of the atmosphere, which comprises of gasses, for
example oxygen that we breathe in that will surround the earth.
Therefore weather will be defined as the state of the atmosphere at every period of time.
Factors that result to formation of weather.
The shape of the earth is round this is a key factor do contribute to weather, since the sun heats
both the atmosphere and also the earth, but the heating will occur at different parts of the earth
throughout the year and different angle as the round earth rotates the earth, the rotation of the
earth will results to different temperature of hotness and coldness to occur, similarly it will cause
wind, clouds, storms and rainfall, all this is what is referred to weather.
Describe your starting point (Provocation):
The topic of weather is a new topic that is introduced to the year 2 students, by the end of this
topic the student should be able to describe each season and the associated weather conditions,
ranging from rain, wind, temperature and humidity.
Paraphrase This Document
Need a fresh take? Get an instant paraphrase of this document with our AI Paraphraser
How will the children engage with this learning? Provide here an outline of five sequential
learning experiences (approx. one week or 300 minutes) of maths/science learning.
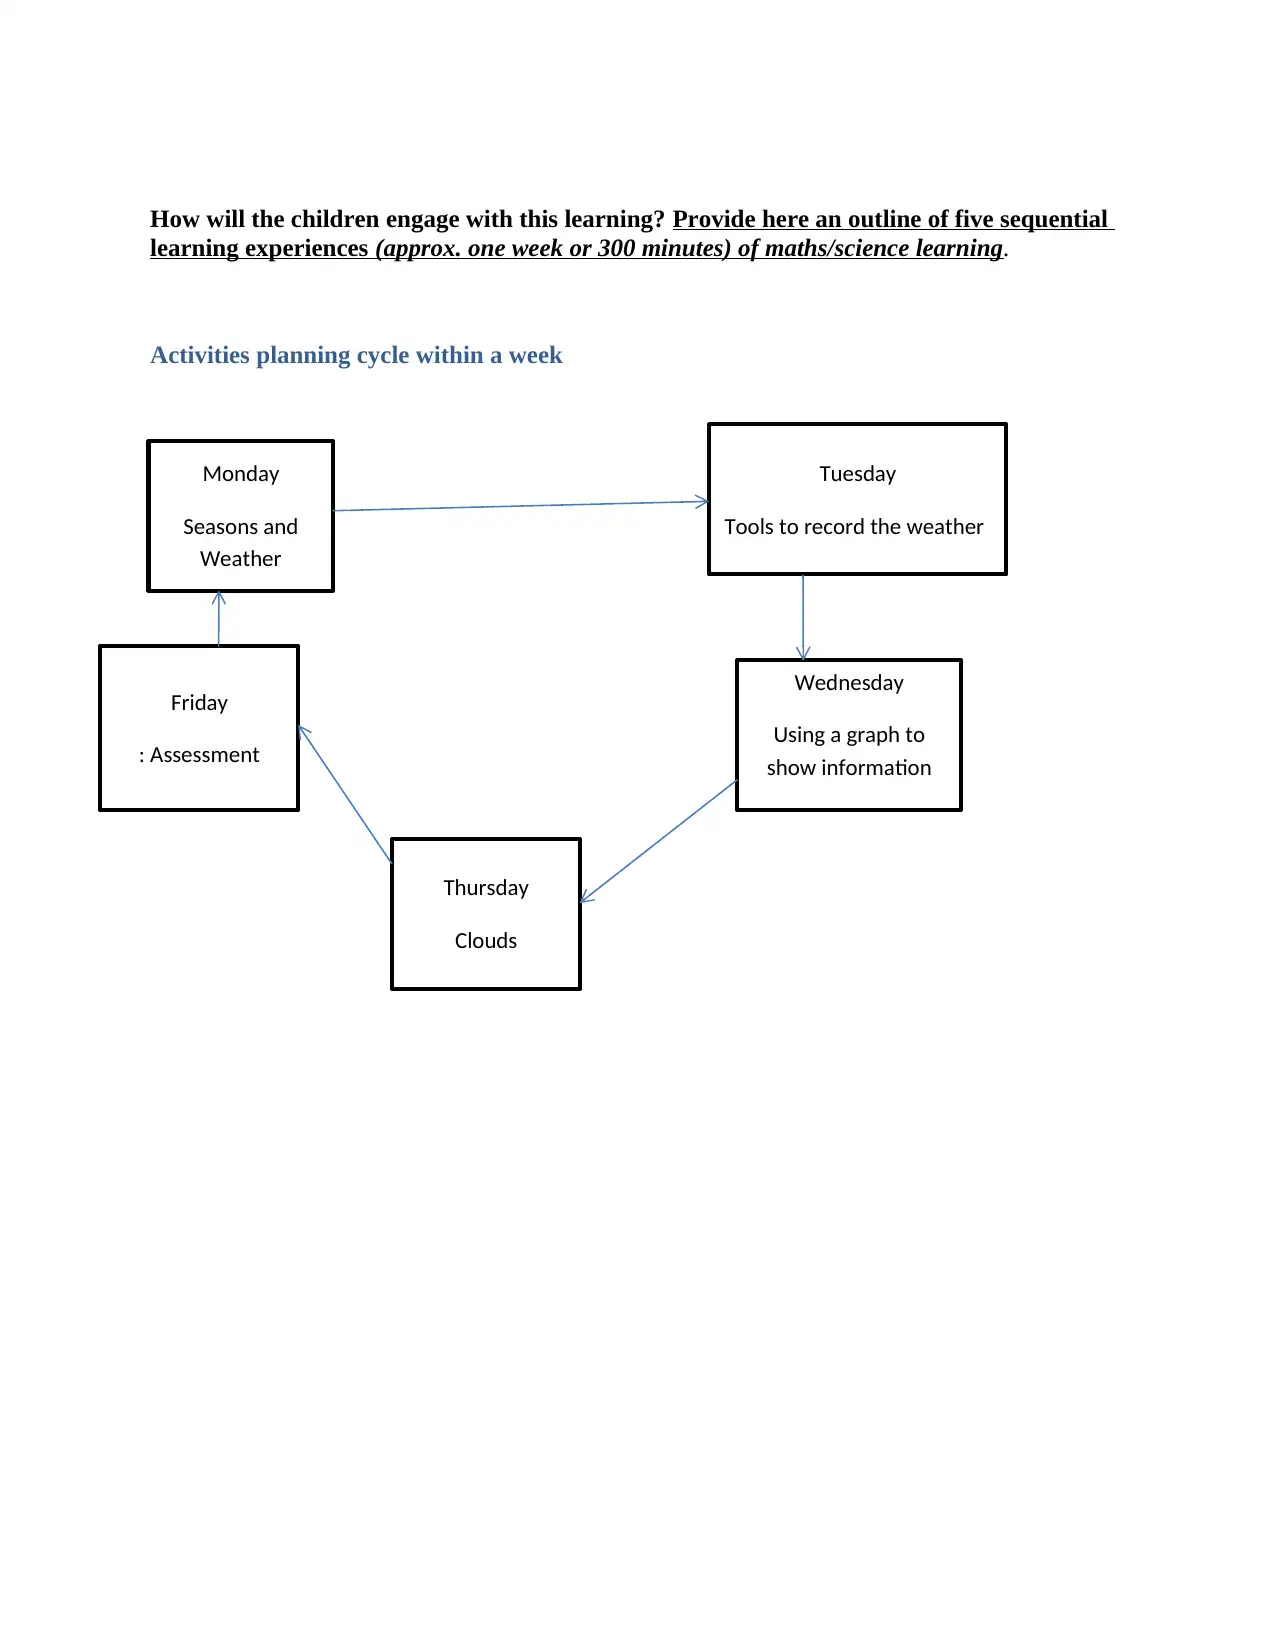
Activities planning cycle within a week
Monday
Seasons and
Weather
Friday
: Assessment
Wednesday
Using a graph to
show information
Tuesday
Tools to record the weather
Thursday
Clouds
learning experiences (approx. one week or 300 minutes) of maths/science learning.
Activities planning cycle within a week
Monday
Seasons and
Weather
Friday
: Assessment
Wednesday
Using a graph to
show information
Tuesday
Tools to record the weather
Thursday
Clouds
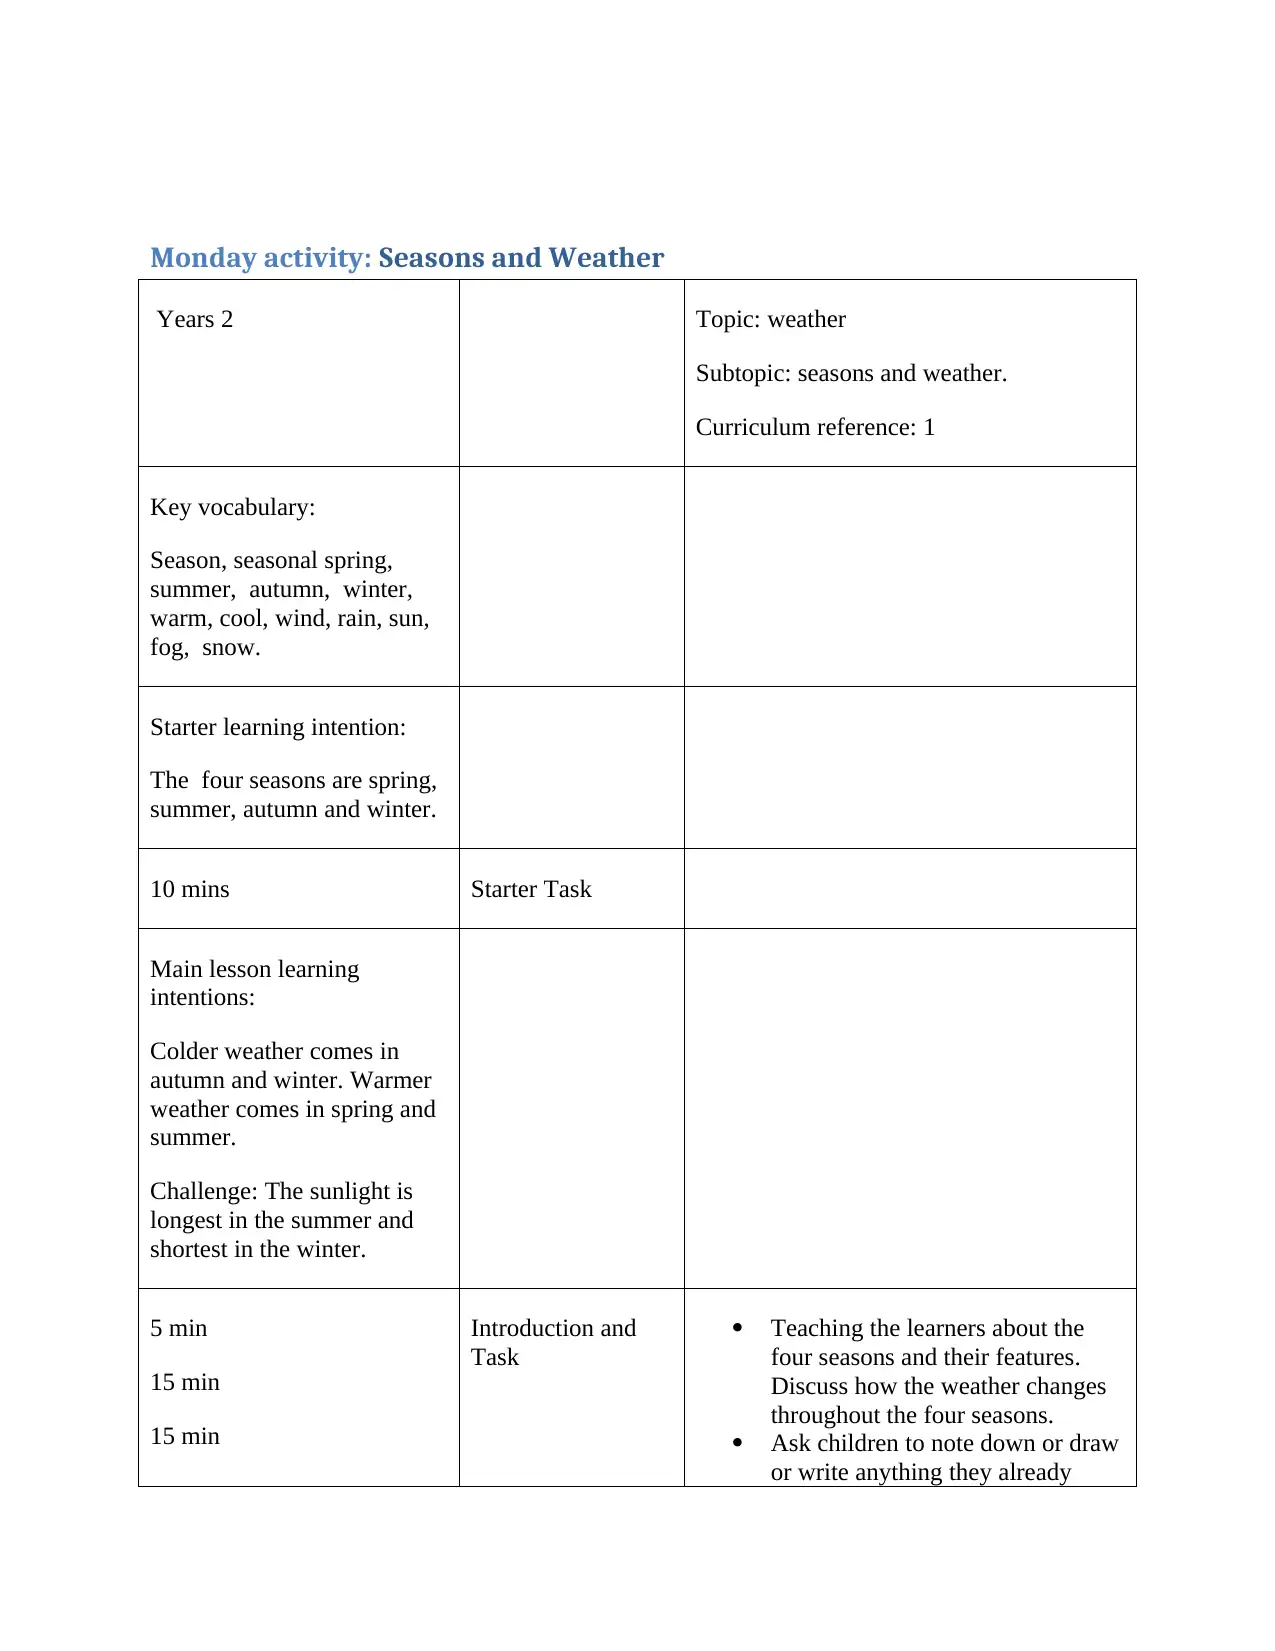
Monday activity: Seasons and Weather
Years 2 Topic: weather
Subtopic: seasons and weather.
Curriculum reference: 1
Key vocabulary:
Season, seasonal spring,
summer, autumn, winter,
warm, cool, wind, rain, sun,
fog, snow.
Starter learning intention:
The four seasons are spring,
summer, autumn and winter.
10 mins Starter Task
Main lesson learning
intentions:
Colder weather comes in
autumn and winter. Warmer
weather comes in spring and
summer.
Challenge: The sunlight is
longest in the summer and
shortest in the winter.
5 min
15 min
15 min
Introduction and
Task
Teaching the learners about the
four seasons and their features.
Discuss how the weather changes
throughout the four seasons.
Ask children to note down or draw
or write anything they already
⊘ This is a preview!⊘
Do you want full access?
Subscribe today to unlock all pages.
Trusted by 1+ million students worldwide
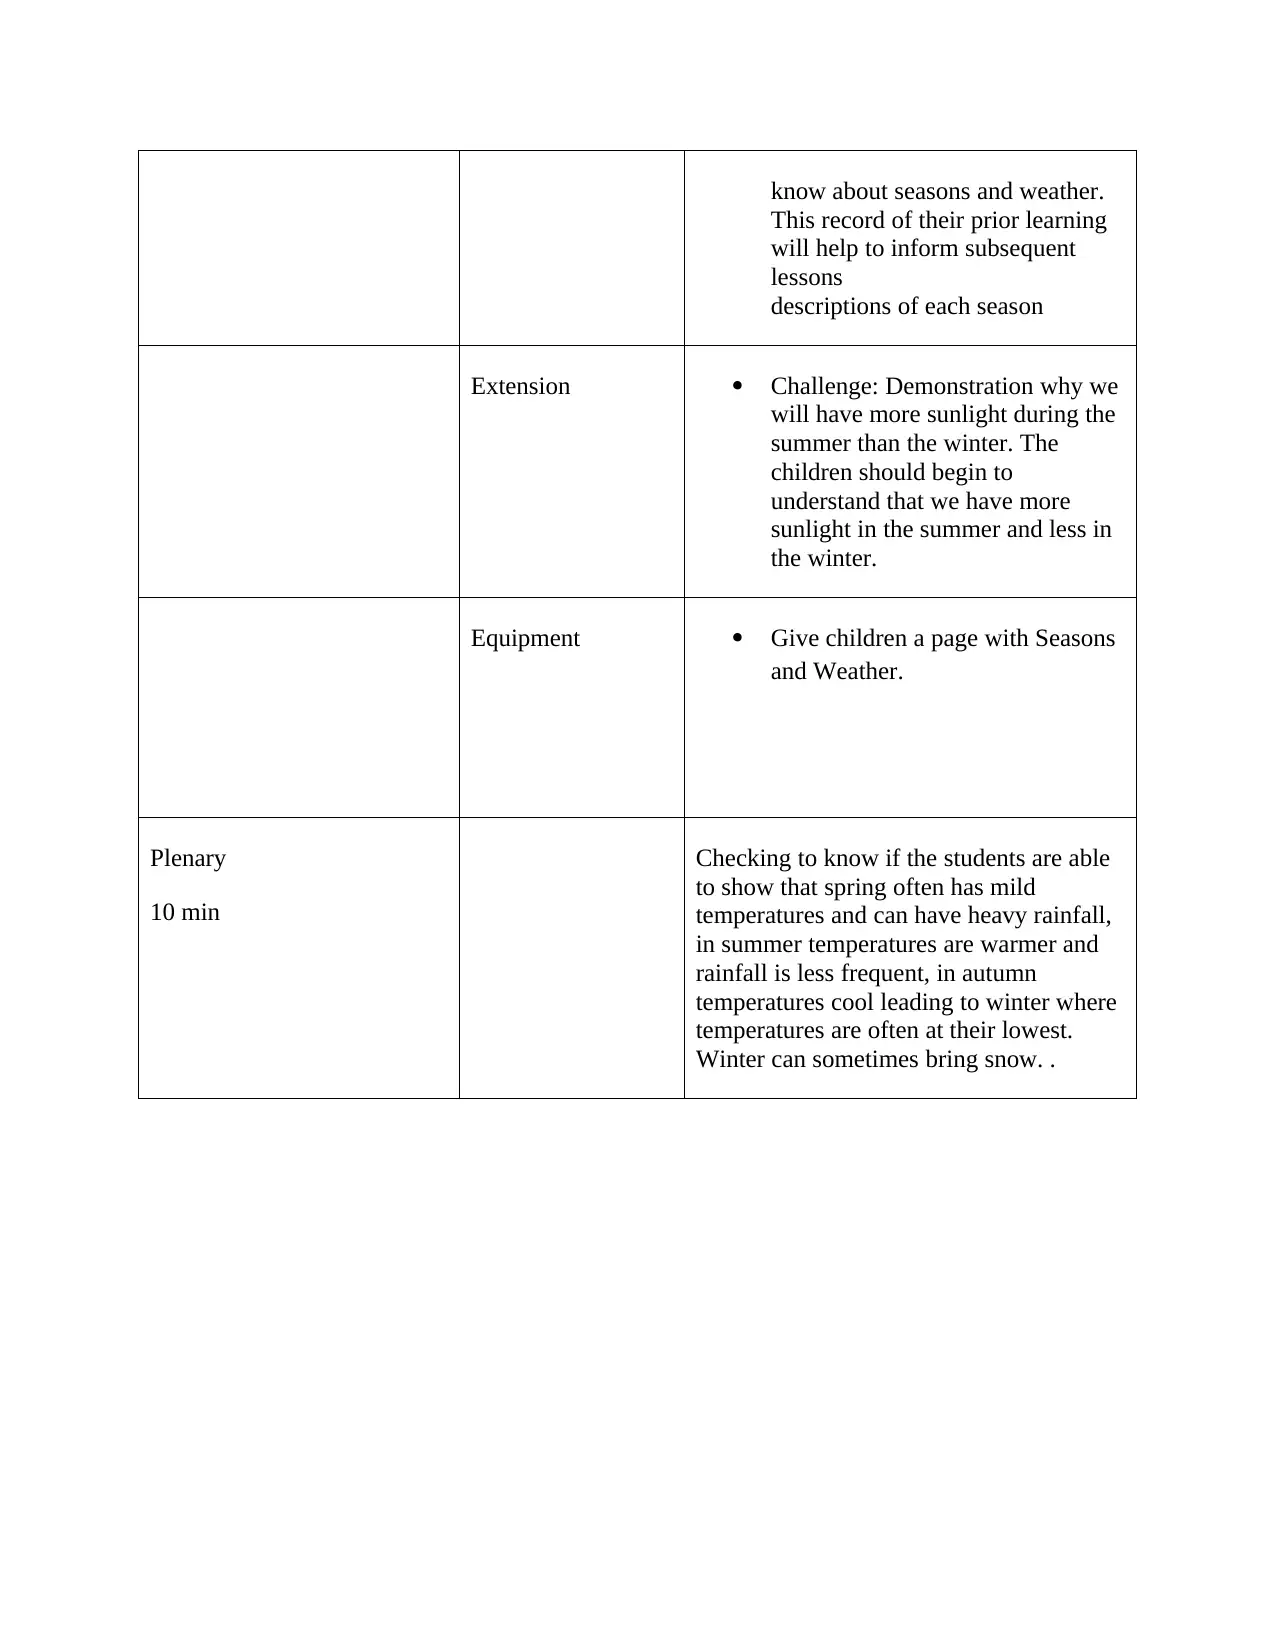
know about seasons and weather.
This record of their prior learning
will help to inform subsequent
lessons
descriptions of each season
Extension Challenge: Demonstration why we
will have more sunlight during the
summer than the winter. The
children should begin to
understand that we have more
sunlight in the summer and less in
the winter.
Equipment Give children a page with Seasons
and Weather.
Plenary
10 min
Checking to know if the students are able
to show that spring often has mild
temperatures and can have heavy rainfall,
in summer temperatures are warmer and
rainfall is less frequent, in autumn
temperatures cool leading to winter where
temperatures are often at their lowest.
Winter can sometimes bring snow. .
Paraphrase This Document
Need a fresh take? Get an instant paraphrase of this document with our AI Paraphraser
Tuesday activity: Tools to record the weather
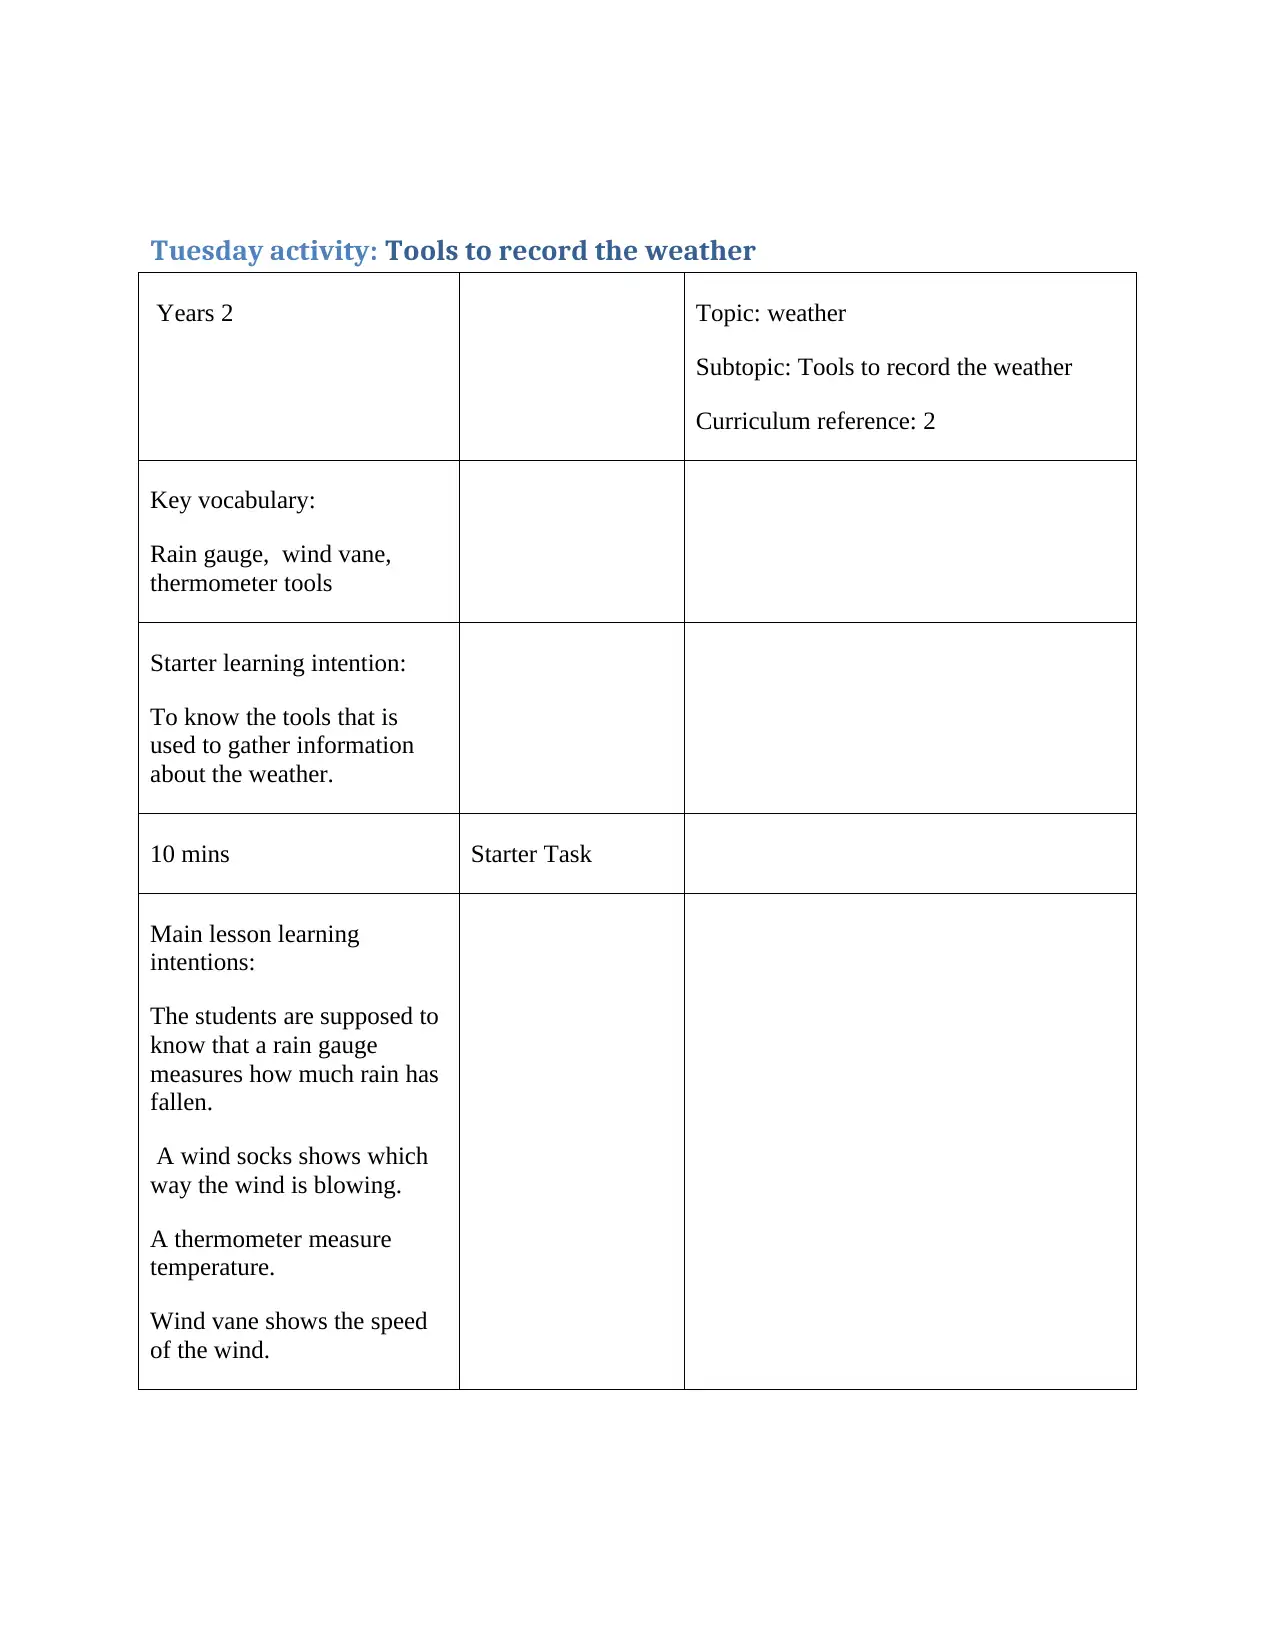
Years 2 Topic: weather
Subtopic: Tools to record the weather
Curriculum reference: 2
Key vocabulary:
Rain gauge, wind vane,
thermometer tools
Starter learning intention:
To know the tools that is
used to gather information
about the weather.
10 mins Starter Task
Main lesson learning
intentions:
The students are supposed to
know that a rain gauge
measures how much rain has
fallen.
A wind socks shows which
way the wind is blowing.
A thermometer measure
temperature.
Wind vane shows the speed
of the wind.
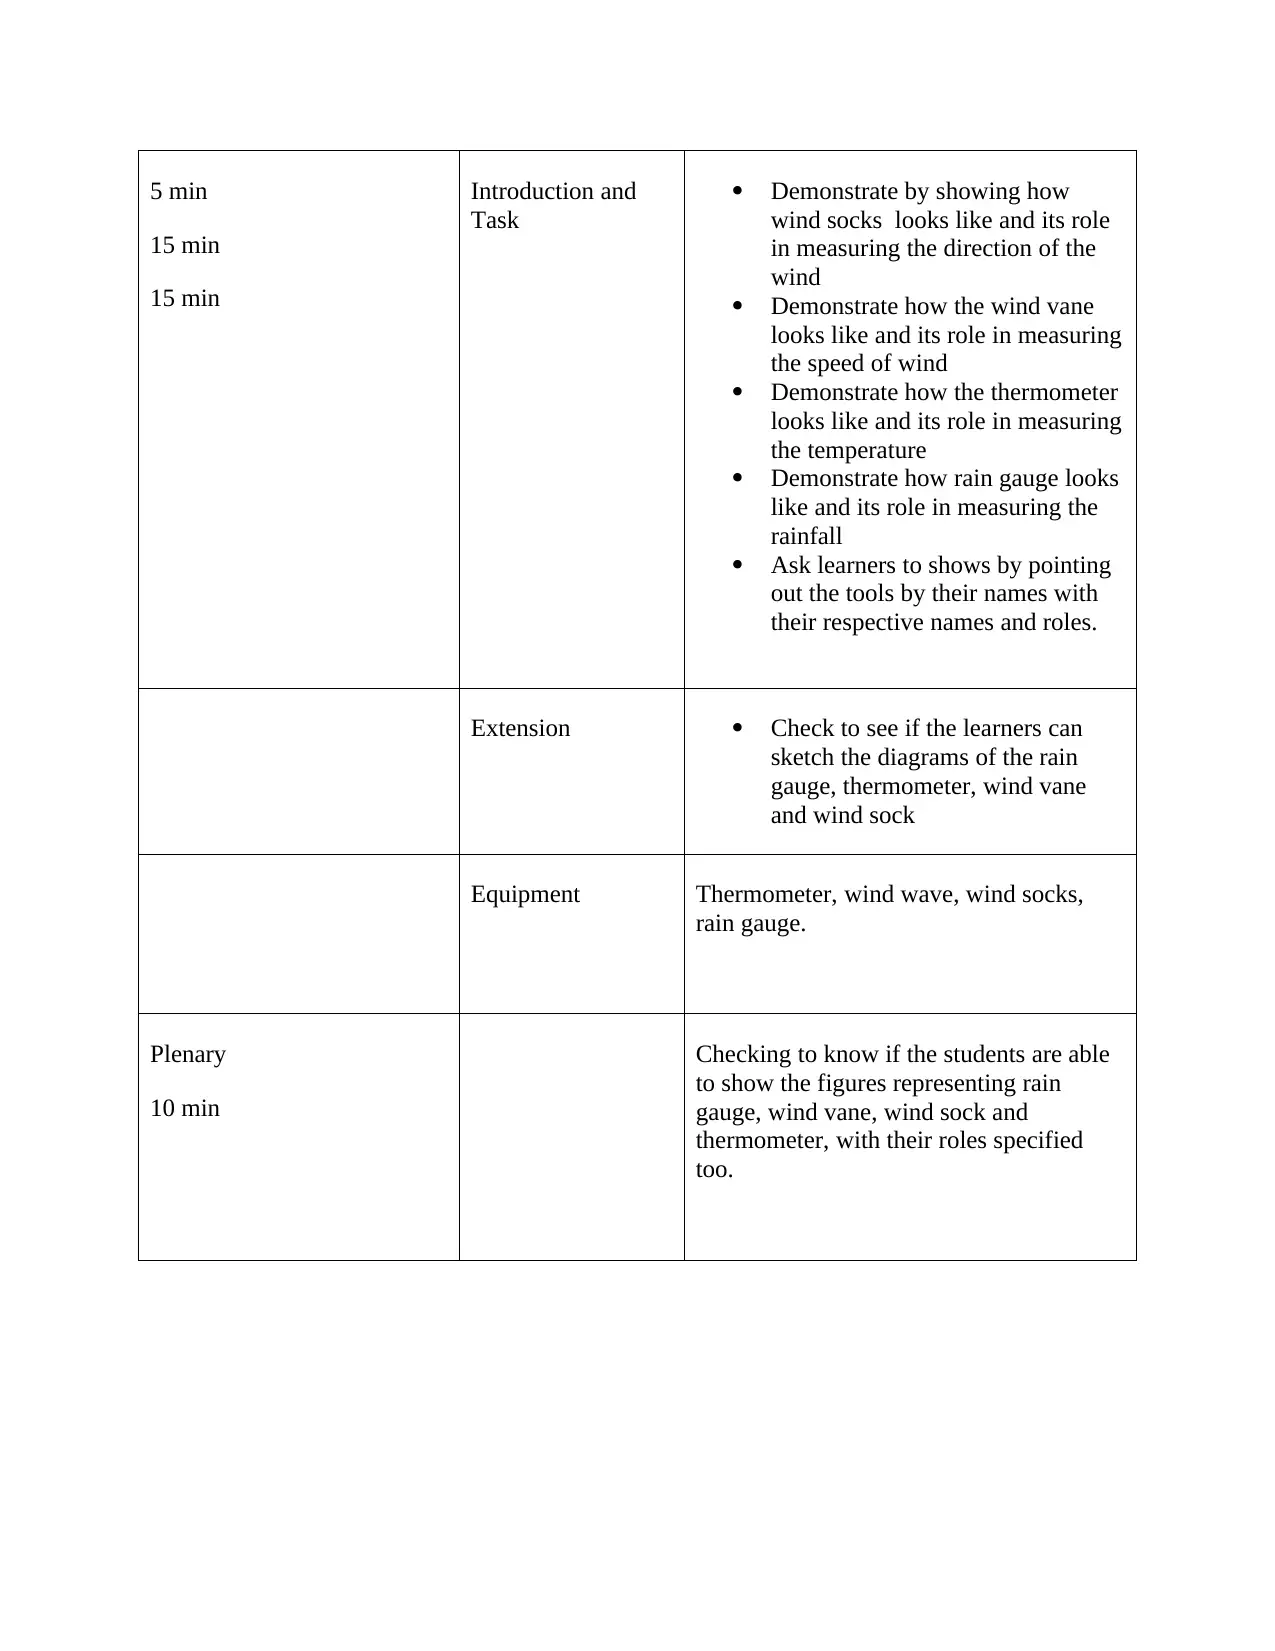
5 min
15 min
15 min
Introduction and
Task
Demonstrate by showing how
wind socks looks like and its role
in measuring the direction of the
wind
Demonstrate how the wind vane
looks like and its role in measuring
the speed of wind
Demonstrate how the thermometer
looks like and its role in measuring
the temperature
Demonstrate how rain gauge looks
like and its role in measuring the
rainfall
Ask learners to shows by pointing
out the tools by their names with
their respective names and roles.
Extension Check to see if the learners can
sketch the diagrams of the rain
gauge, thermometer, wind vane
and wind sock
Equipment Thermometer, wind wave, wind socks,
rain gauge.
Plenary
10 min
Checking to know if the students are able
to show the figures representing rain
gauge, wind vane, wind sock and
thermometer, with their roles specified
too.
15 min
15 min
Introduction and
Task
Demonstrate by showing how
wind socks looks like and its role
in measuring the direction of the
wind
Demonstrate how the wind vane
looks like and its role in measuring
the speed of wind
Demonstrate how the thermometer
looks like and its role in measuring
the temperature
Demonstrate how rain gauge looks
like and its role in measuring the
rainfall
Ask learners to shows by pointing
out the tools by their names with
their respective names and roles.
Extension Check to see if the learners can
sketch the diagrams of the rain
gauge, thermometer, wind vane
and wind sock
Equipment Thermometer, wind wave, wind socks,
rain gauge.
Plenary
10 min
Checking to know if the students are able
to show the figures representing rain
gauge, wind vane, wind sock and
thermometer, with their roles specified
too.
⊘ This is a preview!⊘
Do you want full access?
Subscribe today to unlock all pages.
Trusted by 1+ million students worldwide
Wednesday activity: Using a graph to show information
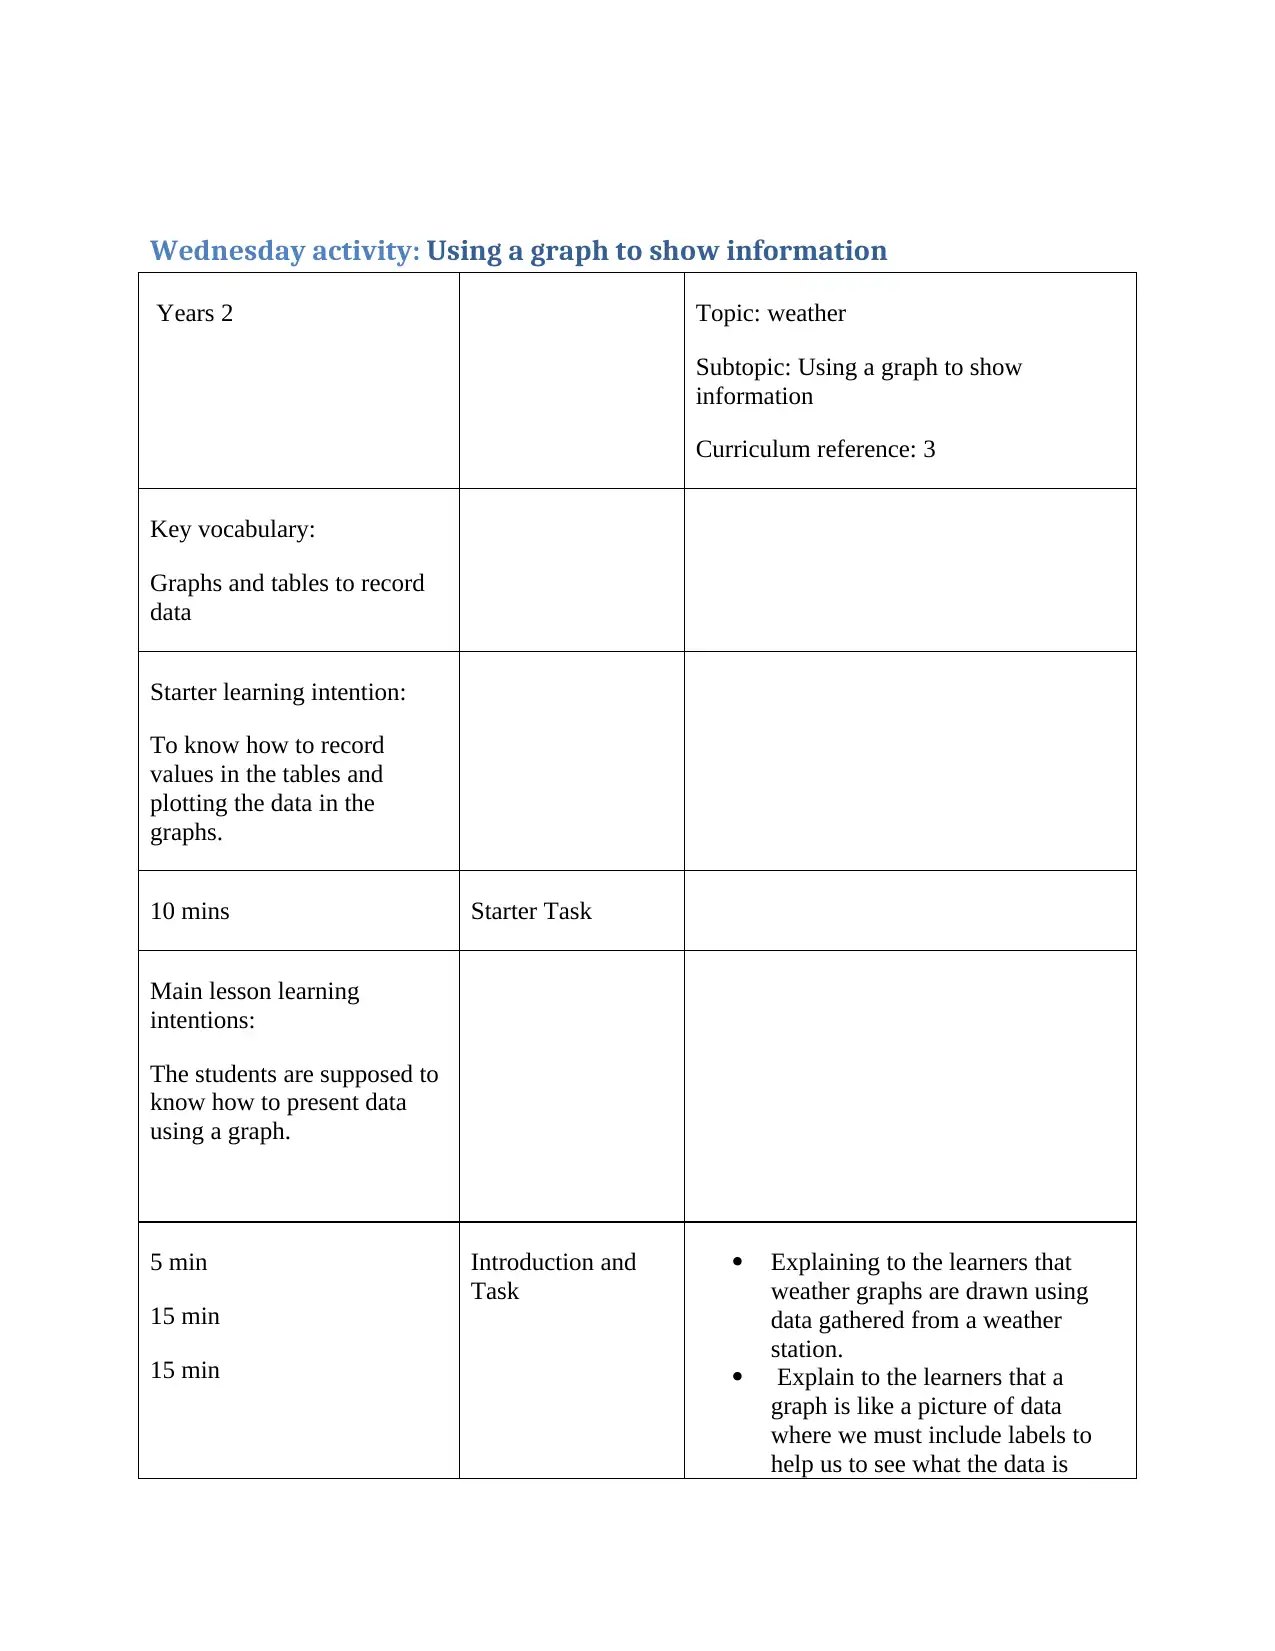
Years 2 Topic: weather
Subtopic: Using a graph to show
information
Curriculum reference: 3
Key vocabulary:
Graphs and tables to record
data
Starter learning intention:
To know how to record
values in the tables and
plotting the data in the
graphs.
10 mins Starter Task
Main lesson learning
intentions:
The students are supposed to
know how to present data
using a graph.
5 min
15 min
15 min
Introduction and
Task
Explaining to the learners that
weather graphs are drawn using
data gathered from a weather
station.
Explain to the learners that a
graph is like a picture of data
where we must include labels to
help us to see what the data is
Paraphrase This Document
Need a fresh take? Get an instant paraphrase of this document with our AI Paraphraser
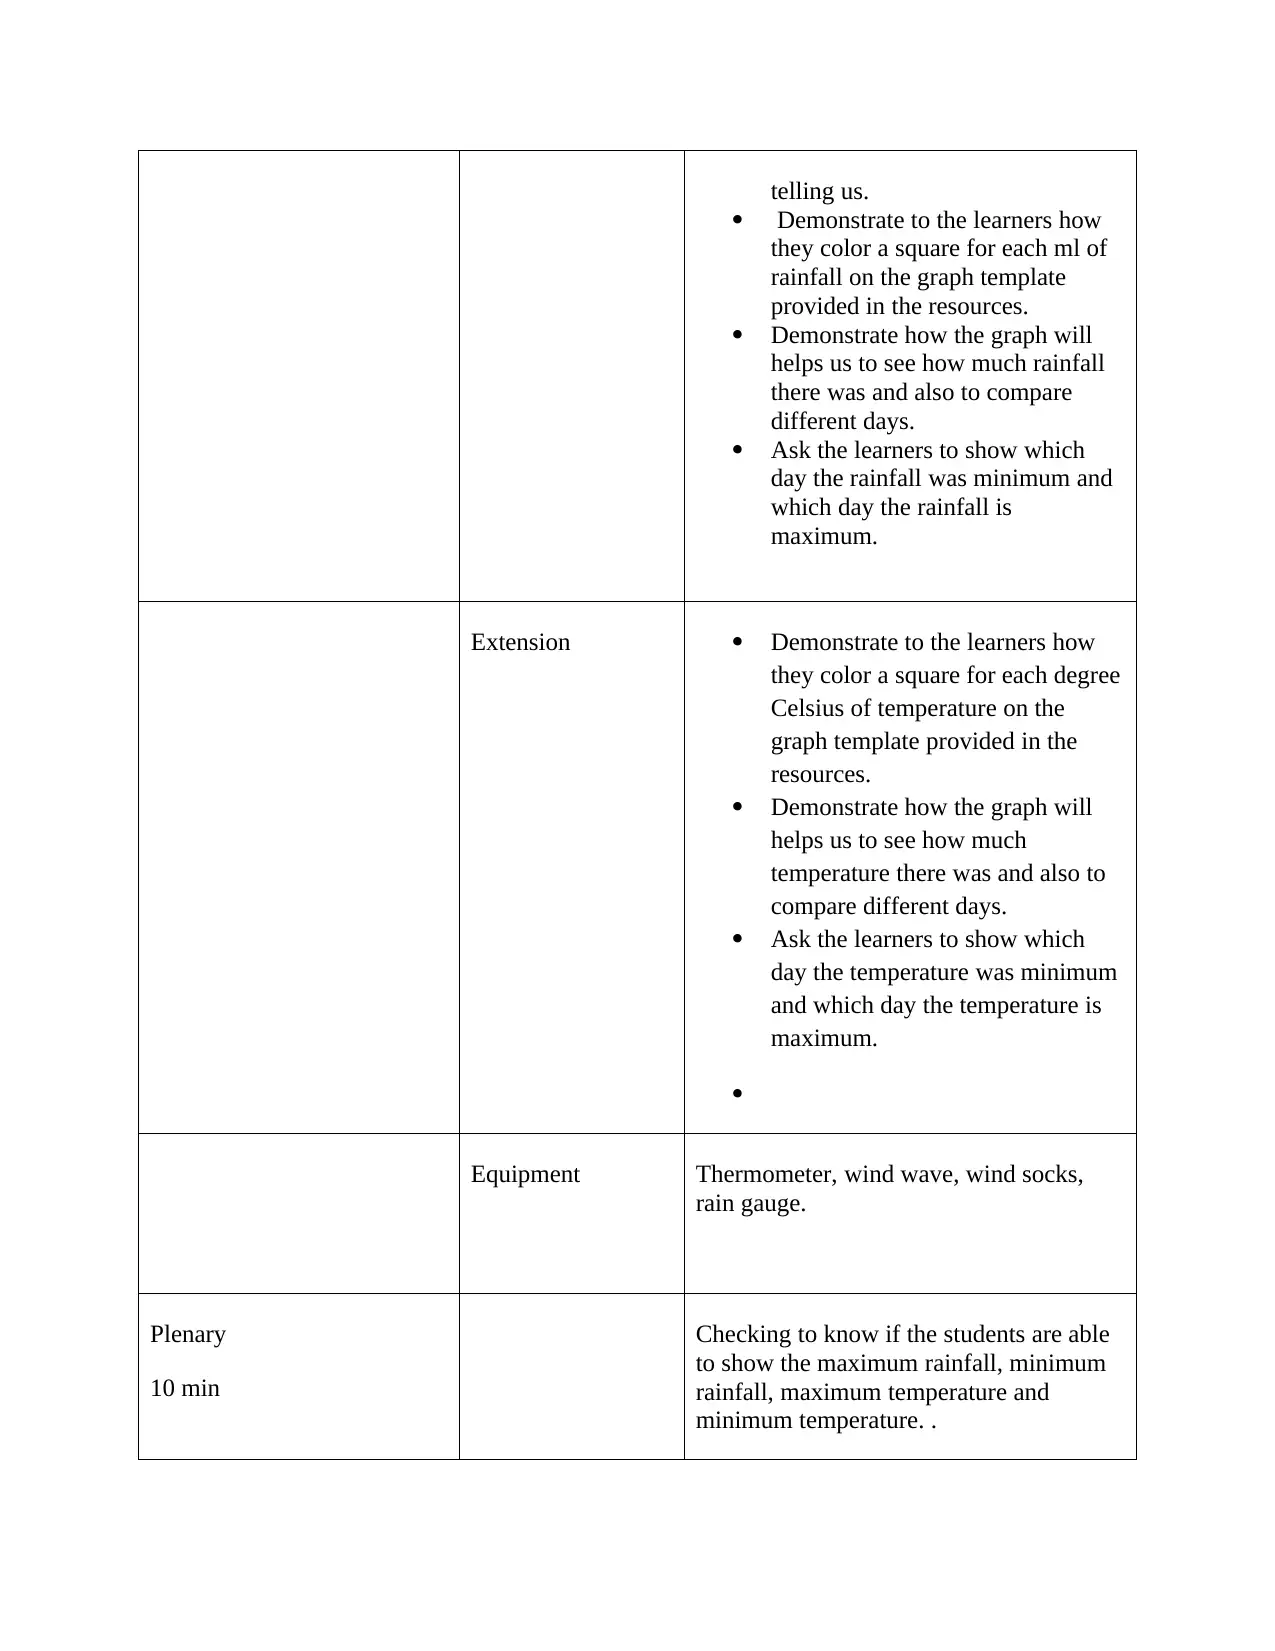
telling us.
Demonstrate to the learners how
they color a square for each ml of
rainfall on the graph template
provided in the resources.
Demonstrate how the graph will
helps us to see how much rainfall
there was and also to compare
different days.
Ask the learners to show which
day the rainfall was minimum and
which day the rainfall is
maximum.
Extension Demonstrate to the learners how
they color a square for each degree
Celsius of temperature on the
graph template provided in the
resources.
Demonstrate how the graph will
helps us to see how much
temperature there was and also to
compare different days.
Ask the learners to show which
day the temperature was minimum
and which day the temperature is
maximum.
Equipment Thermometer, wind wave, wind socks,
rain gauge.
Plenary
10 min
Checking to know if the students are able
to show the maximum rainfall, minimum
rainfall, maximum temperature and
minimum temperature. .
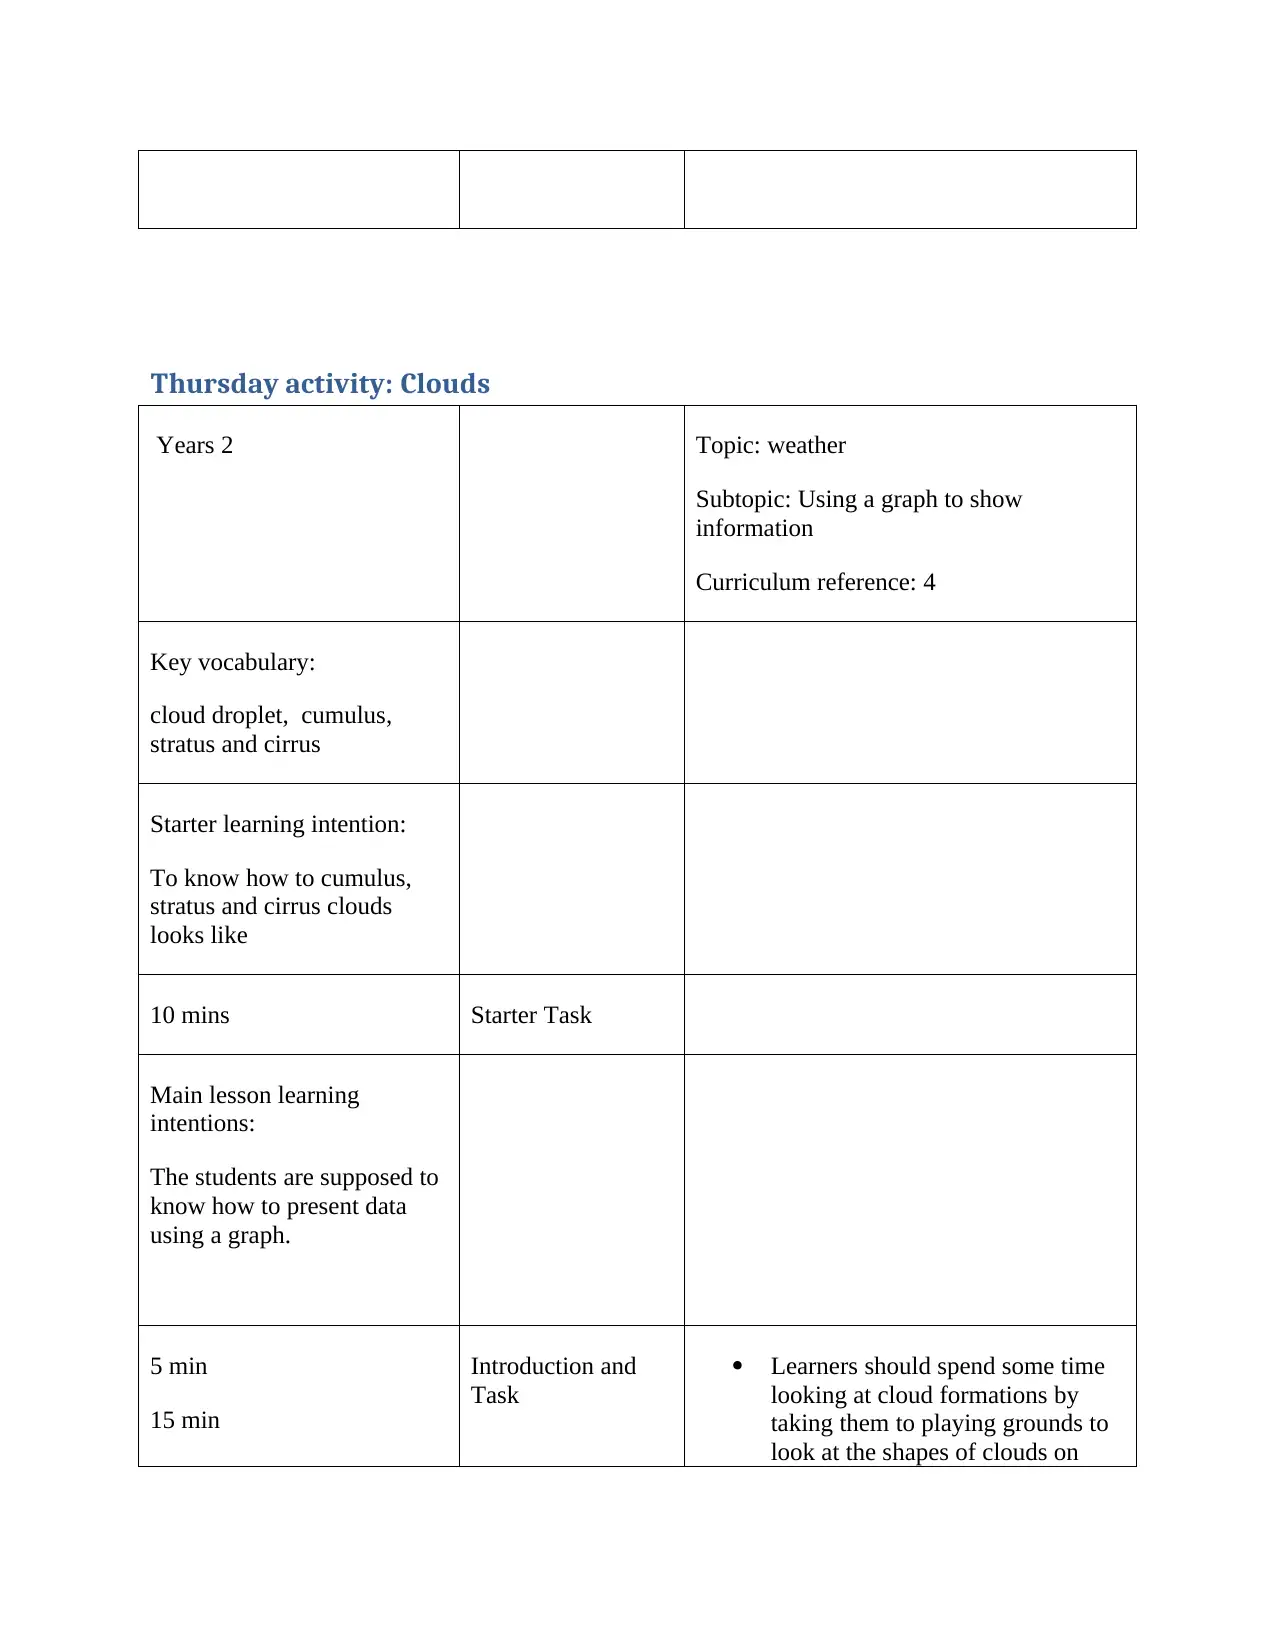
Thursday activity: Clouds
Years 2 Topic: weather
Subtopic: Using a graph to show
information
Curriculum reference: 4
Key vocabulary:
cloud droplet, cumulus,
stratus and cirrus
Starter learning intention:
To know how to cumulus,
stratus and cirrus clouds
looks like
10 mins Starter Task
Main lesson learning
intentions:
The students are supposed to
know how to present data
using a graph.
5 min
15 min
Introduction and
Task
Learners should spend some time
looking at cloud formations by
taking them to playing grounds to
look at the shapes of clouds on
⊘ This is a preview!⊘
Do you want full access?
Subscribe today to unlock all pages.
Trusted by 1+ million students worldwide
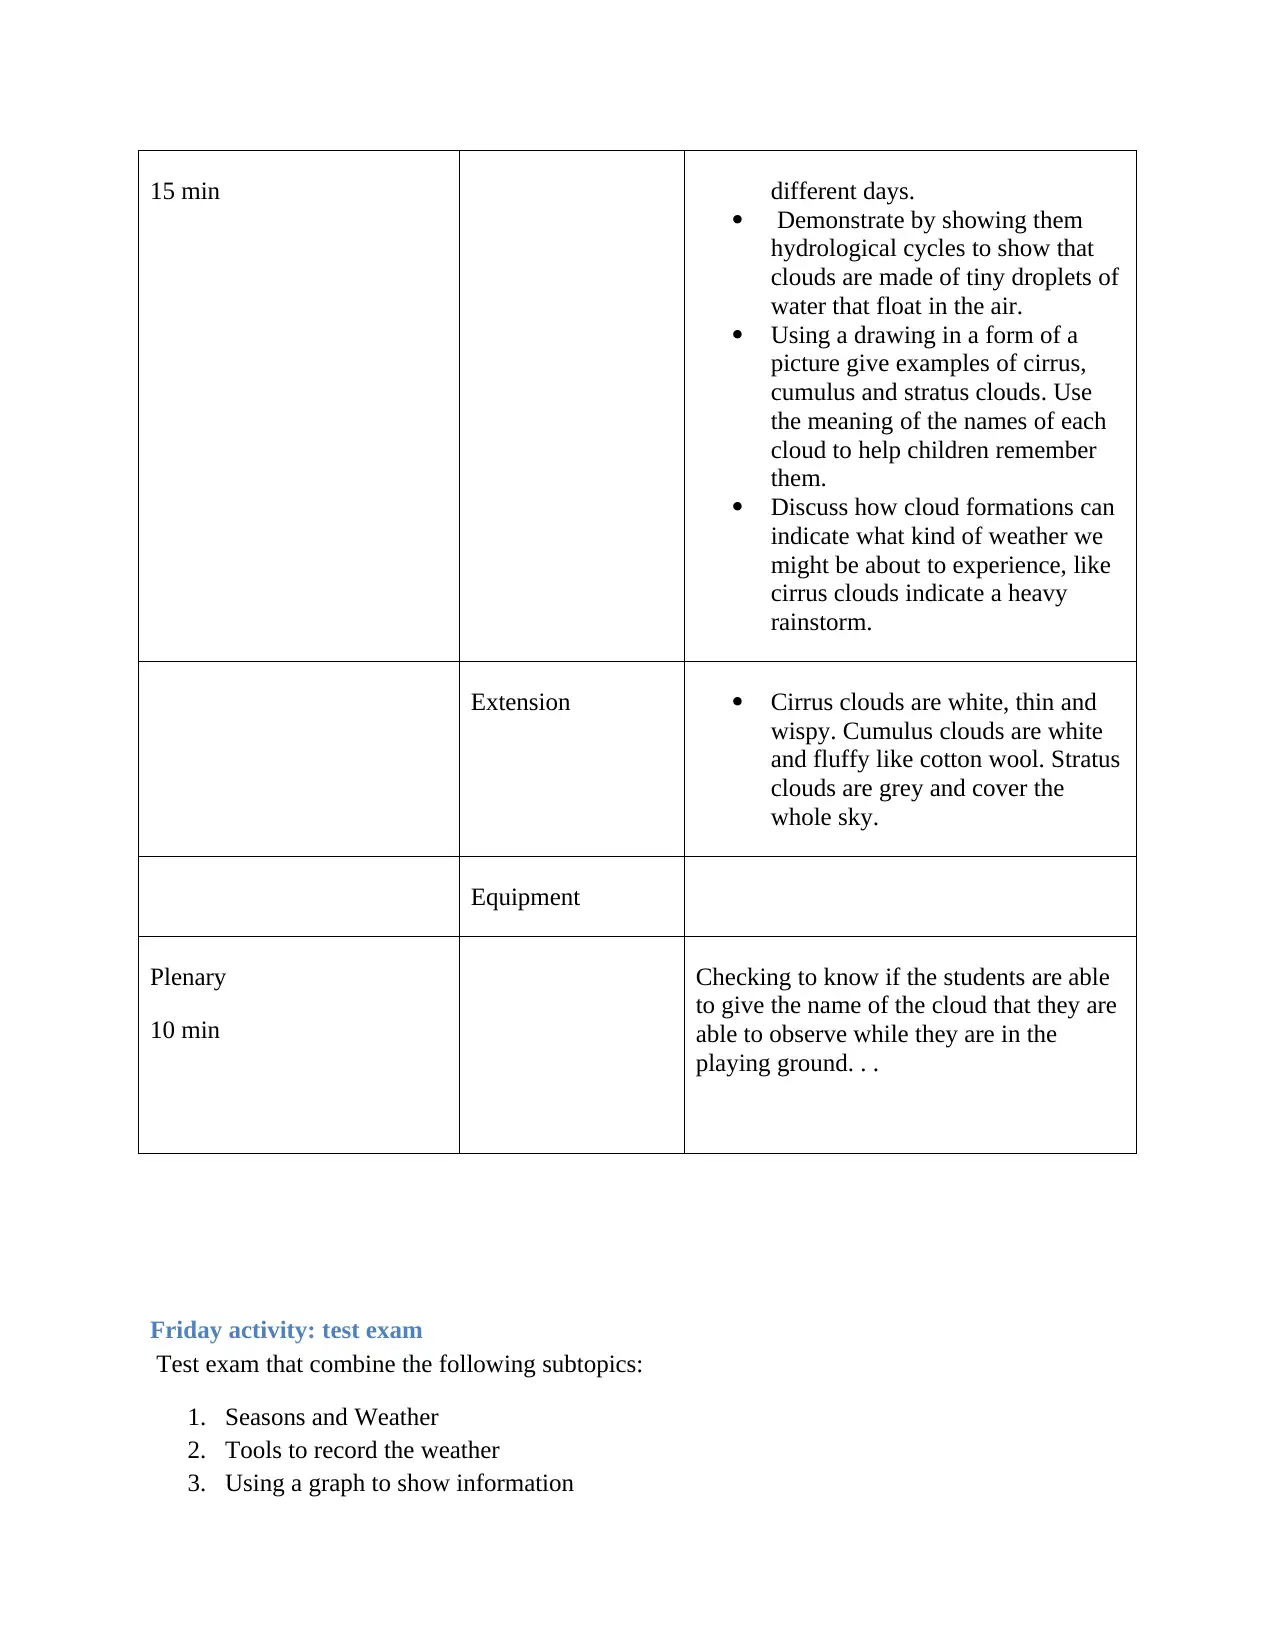
15 min different days.
Demonstrate by showing them
hydrological cycles to show that
clouds are made of tiny droplets of
water that float in the air.
Using a drawing in a form of a
picture give examples of cirrus,
cumulus and stratus clouds. Use
the meaning of the names of each
cloud to help children remember
them.
Discuss how cloud formations can
indicate what kind of weather we
might be about to experience, like
cirrus clouds indicate a heavy
rainstorm.
Extension Cirrus clouds are white, thin and
wispy. Cumulus clouds are white
and fluffy like cotton wool. Stratus
clouds are grey and cover the
whole sky.
Equipment
Plenary
10 min
Checking to know if the students are able
to give the name of the cloud that they are
able to observe while they are in the
playing ground. . .
Friday activity: test exam
Test exam that combine the following subtopics:
1. Seasons and Weather
2. Tools to record the weather
3. Using a graph to show information
Paraphrase This Document
Need a fresh take? Get an instant paraphrase of this document with our AI Paraphraser
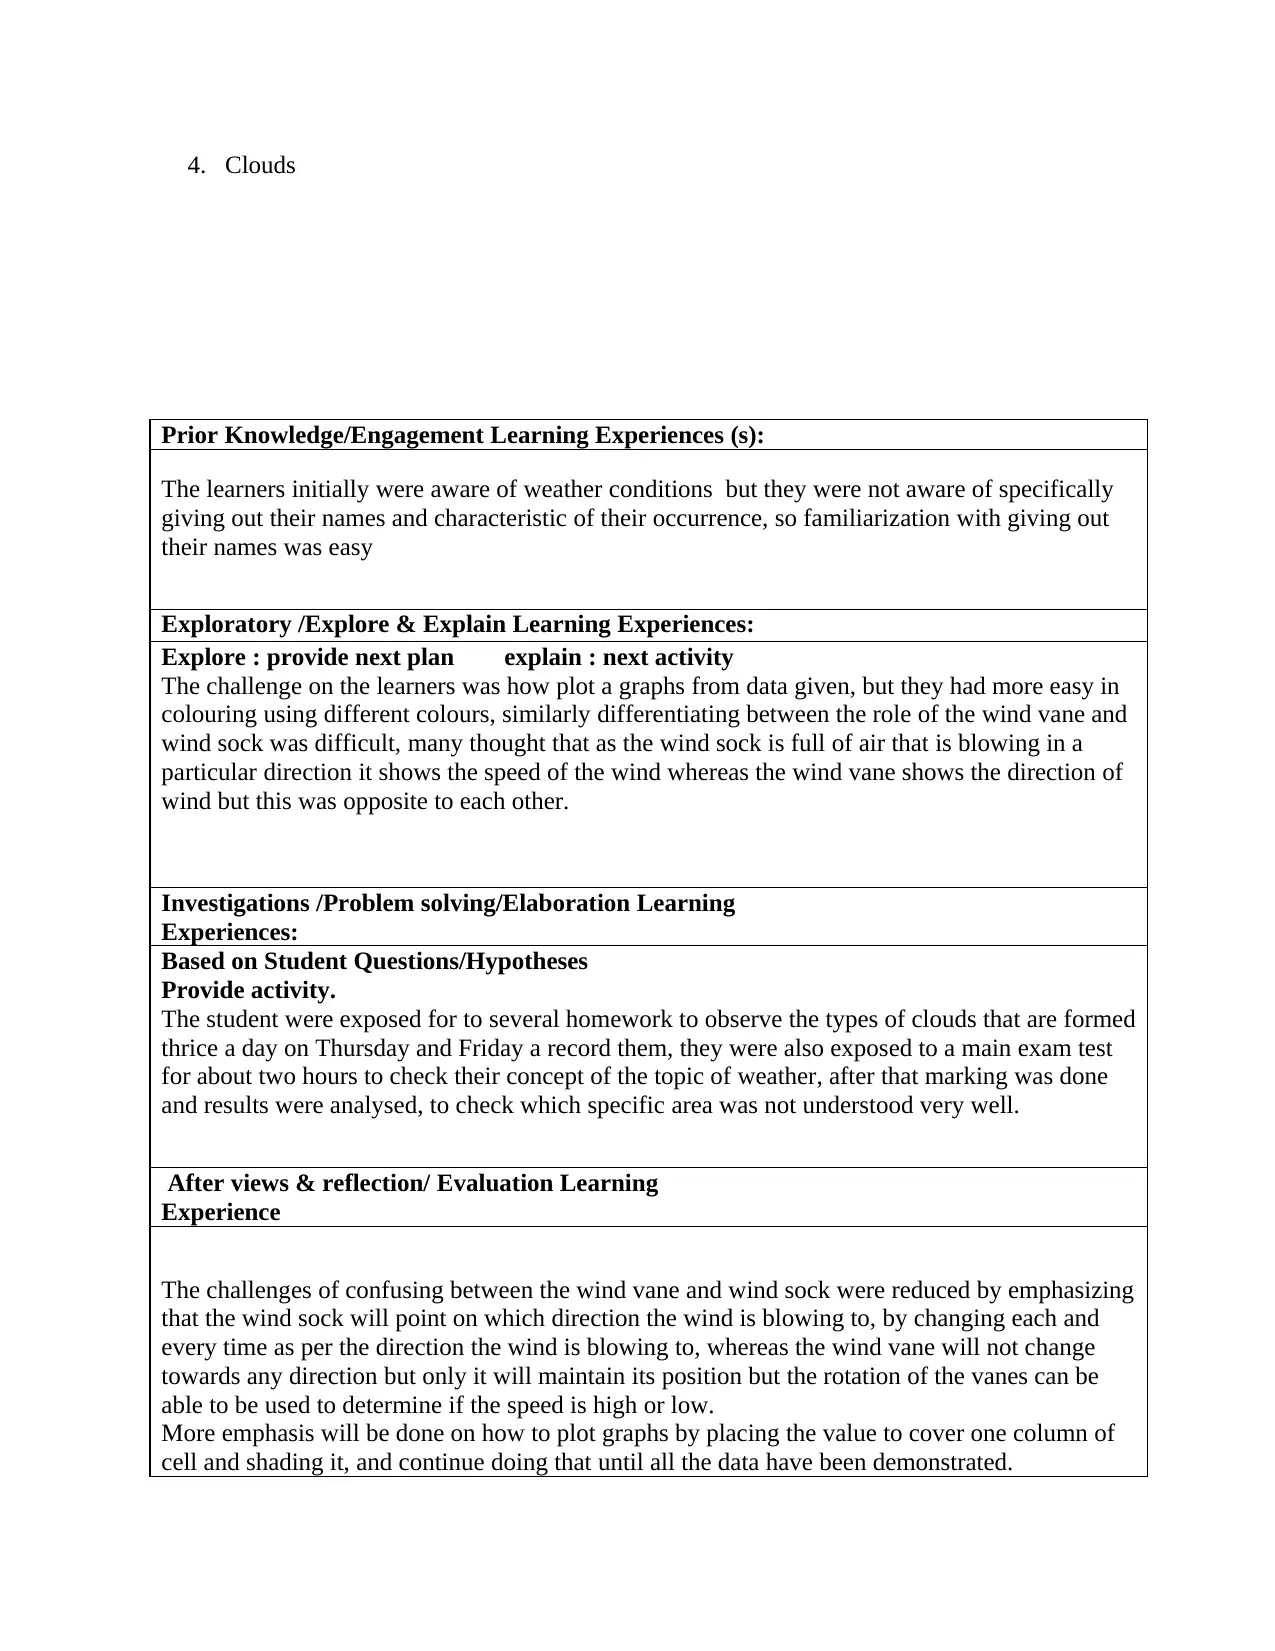
4. Clouds
Prior Knowledge/Engagement Learning Experiences (s):
The learners initially were aware of weather conditions but they were not aware of specifically
giving out their names and characteristic of their occurrence, so familiarization with giving out
their names was easy
Exploratory /Explore & Explain Learning Experiences:
Explore : provide next plan explain : next activity
The challenge on the learners was how plot a graphs from data given, but they had more easy in
colouring using different colours, similarly differentiating between the role of the wind vane and
wind sock was difficult, many thought that as the wind sock is full of air that is blowing in a
particular direction it shows the speed of the wind whereas the wind vane shows the direction of
wind but this was opposite to each other.
Investigations /Problem solving/Elaboration Learning
Experiences:
Based on Student Questions/Hypotheses
Provide activity.
The student were exposed for to several homework to observe the types of clouds that are formed
thrice a day on Thursday and Friday a record them, they were also exposed to a main exam test
for about two hours to check their concept of the topic of weather, after that marking was done
and results were analysed, to check which specific area was not understood very well.
After views & reflection/ Evaluation Learning
Experience
The challenges of confusing between the wind vane and wind sock were reduced by emphasizing
that the wind sock will point on which direction the wind is blowing to, by changing each and
every time as per the direction the wind is blowing to, whereas the wind vane will not change
towards any direction but only it will maintain its position but the rotation of the vanes can be
able to be used to determine if the speed is high or low.
More emphasis will be done on how to plot graphs by placing the value to cover one column of
cell and shading it, and continue doing that until all the data have been demonstrated.
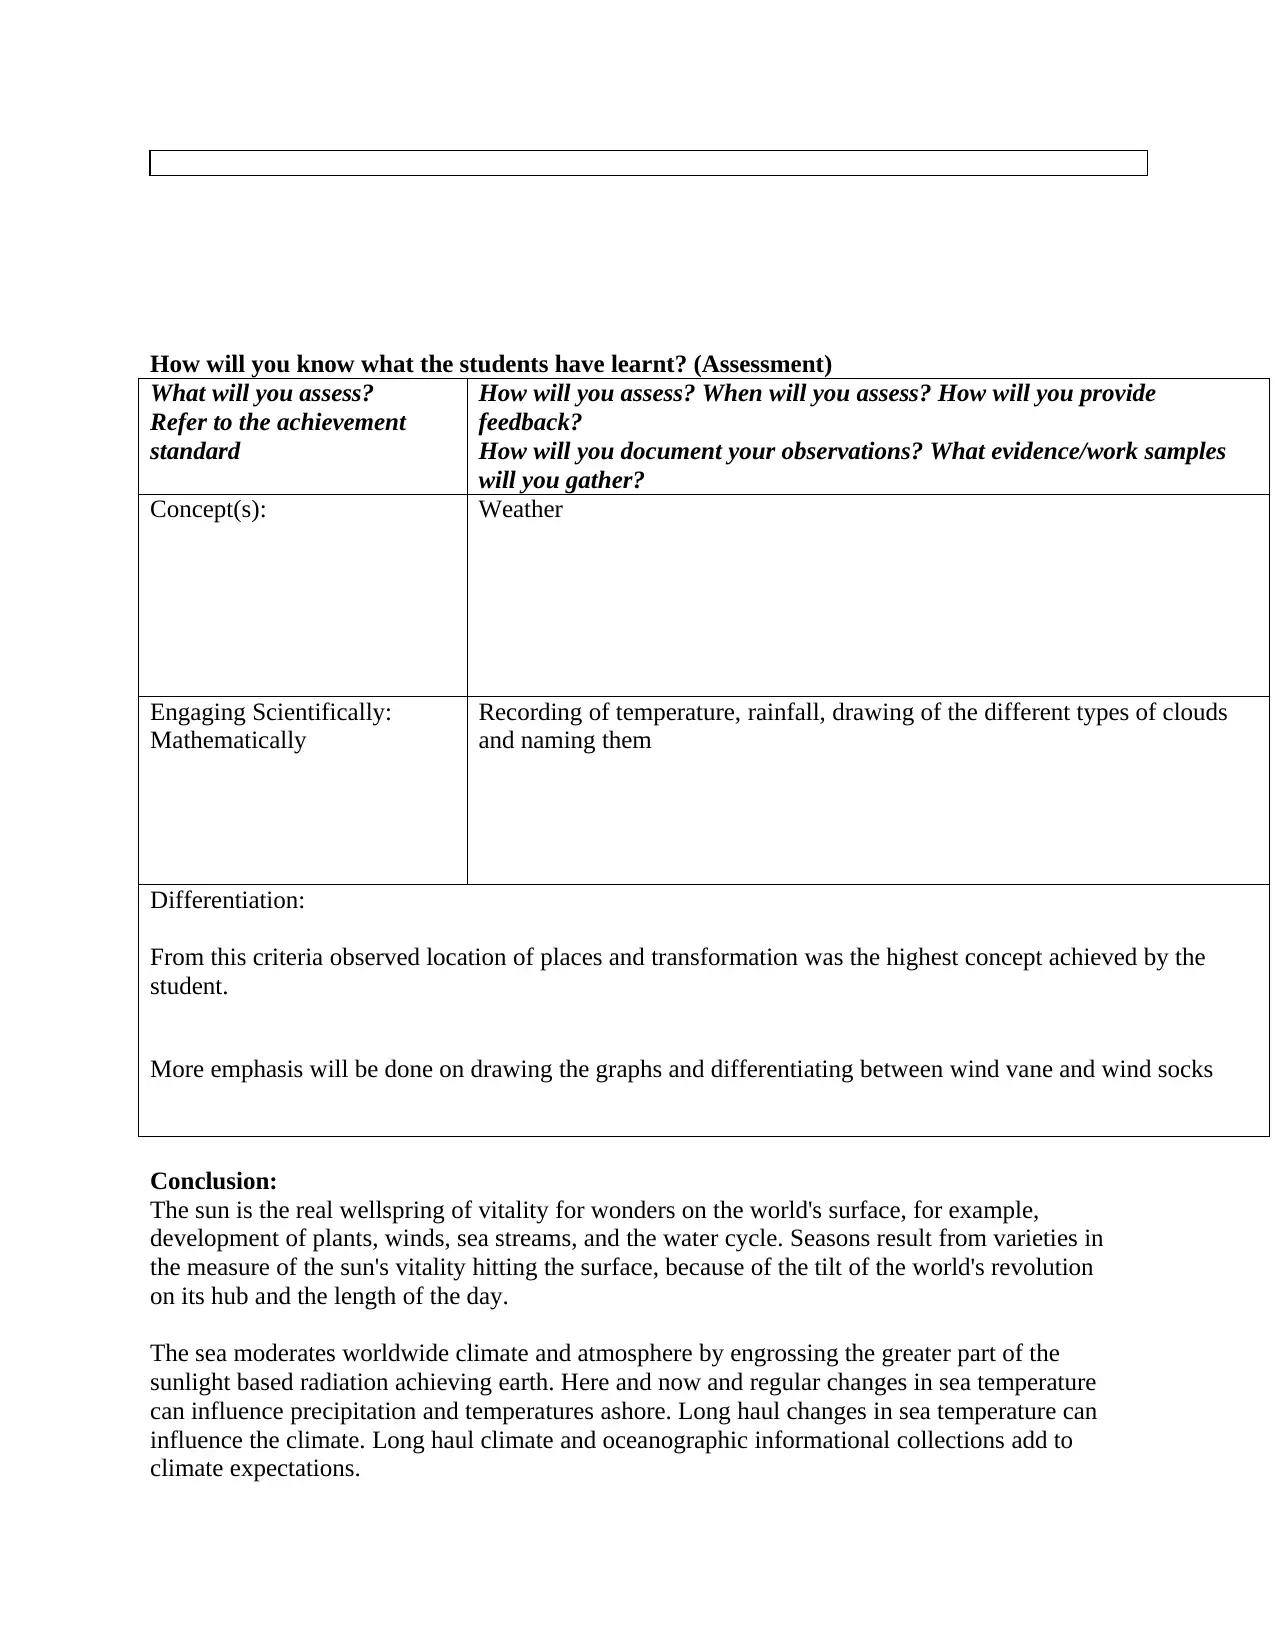
How will you know what the students have learnt? (Assessment)
What will you assess?
Refer to the achievement
standard
How will you assess? When will you assess? How will you provide
feedback?
How will you document your observations? What evidence/work samples
will you gather?
Concept(s): Weather
Engaging Scientifically:
Mathematically
Recording of temperature, rainfall, drawing of the different types of clouds
and naming them
Differentiation:
From this criteria observed location of places and transformation was the highest concept achieved by the
student.
More emphasis will be done on drawing the graphs and differentiating between wind vane and wind socks
Conclusion:
The sun is the real wellspring of vitality for wonders on the world's surface, for example,
development of plants, winds, sea streams, and the water cycle. Seasons result from varieties in
the measure of the sun's vitality hitting the surface, because of the tilt of the world's revolution
on its hub and the length of the day.
The sea moderates worldwide climate and atmosphere by engrossing the greater part of the
sunlight based radiation achieving earth. Here and now and regular changes in sea temperature
can influence precipitation and temperatures ashore. Long haul changes in sea temperature can
influence the climate. Long haul climate and oceanographic informational collections add to
climate expectations.
⊘ This is a preview!⊘
Do you want full access?
Subscribe today to unlock all pages.
Trusted by 1+ million students worldwide
1 out of 13
Your All-in-One AI-Powered Toolkit for Academic Success.
+13062052269
info@desklib.com
Available 24*7 on WhatsApp / Email
![[object Object]](/_next/static/media/star-bottom.7253800d.svg)
Unlock your academic potential
Copyright © 2020–2026 A2Z Services. All Rights Reserved. Developed and managed by ZUCOL.