Risk Management of Securities: CML, SML, and CAPM Models
VerifiedAdded on 2022/08/27
|12
|2818
|15
Report
AI Summary
This report provides a comprehensive analysis of risk management strategies in securities investments, focusing on the Capital Market Line (CML) and Security Market Line (SML) approaches, alongside the Capital Asset Pricing Model (CAPM). The report explores the concept of investment in securities, emphasizing the inherent risks and the role of financial models in predicting risk and return relationships. It delves into the CML approach, illustrating how it helps investors achieve optimal returns based on their risk tolerance, and discusses the minimum variance portfolio and its significance in determining the efficient frontier. The report further examines the CAPM model, its underlying assumptions, and its advantages over other models, particularly its use of beta to measure systematic risk. The SML approach is then presented as a visual representation of CAPM, highlighting its role in evaluating undervalued and overvalued stocks. The importance of beta in assessing stock volatility and market sensitivity is also discussed. The report concludes with recommendations for investors, emphasizing the need for diversification and the use of CAPM and CML models to manage risk effectively. It highlights the importance of understanding both diversifiable and non-diversifiable risks to make informed investment decisions.

Risk management models of finance
Paraphrase This Document
Need a fresh take? Get an instant paraphrase of this document with our AI Paraphraser
1
RISK MANAGEMENT OF SECURITIES
Table of Contents
Introduction................................................................................................................................2
Concept of investment in securities...........................................................................................2
Analysis of CML approach........................................................................................................2
Concept of minimum variance portfolio................................................................................4
Importance of minimum variance portfolio...........................................................................4
Basic assumptions for CAPM model.........................................................................................5
Accuracy of CAPM model in the comparison of other models.............................................6
Concept of SML Approach....................................................................................................6
Special features of CAPM model...........................................................................................7
Importance of Beta.................................................................................................................8
Difference between CML and SML Lines.................................................................................9
Conclusion................................................................................................................................10
Recommendations for the investors.........................................................................................10
References................................................................................................................................12
2
RISK MANAGEMENT OF SECURITIES
Introduction
In this report, an analysis will be done over the CML and SML approach of portfolios. These
are related to the risk and return measures for any portfolio related to investment. The various
characteristics of CAPM will also be discussed in order to understand the relationship
between risk free assets and expected return. The focus will be given over the difference
between SML and CML approach. The importance of efficient frontier and Beta is also
analysed in this report. The focus is provided on the importance of the various models and
approaches of the investments by getting maximum return on portfolios. In the end,
recommendations are given on the bases of the analysis of different approaches of investment
management for protecting the investors from high level of risk.
Concept of investment in securities
The investment in securities is seems to be risky for investors because no tool can exactly
predict the return of the security with a certain level of risk. Different models and approaches
of finance can provide an idea about the risk and return relationship for individual stocks or
portfolios. That is why most of the investors are interested in knowing the expected return
within a certain amount of risk. CAPM model, SML and CML approaches offers the
guidelines to measure risk and return relationship of different securities (VI OSAYI, 2019).
Analysis of CML approach
Capital market line is depicted by a graph with respect to expected return and risk of a
portfolio which is used by investors to obtain best return. The CML is calculated with the
help of market return on portfolio and risk free assets. In this approach risk is measured by
standard deviation.
The equation of CML is written below:
E(Rc) = Rf + SDc {E(Rm)- Rf/SDm}
E (Rc)= Expected return on portfolio C
SDc = Standard deviation for portfolio C
SDm= S.D. for market return
⊘ This is a preview!⊘
Do you want full access?
Subscribe today to unlock all pages.
Trusted by 1+ million students worldwide
3
RISK MANAGEMENT OF SECURITIES
E(Rm)= Expected market return
Rf = Risk free rate
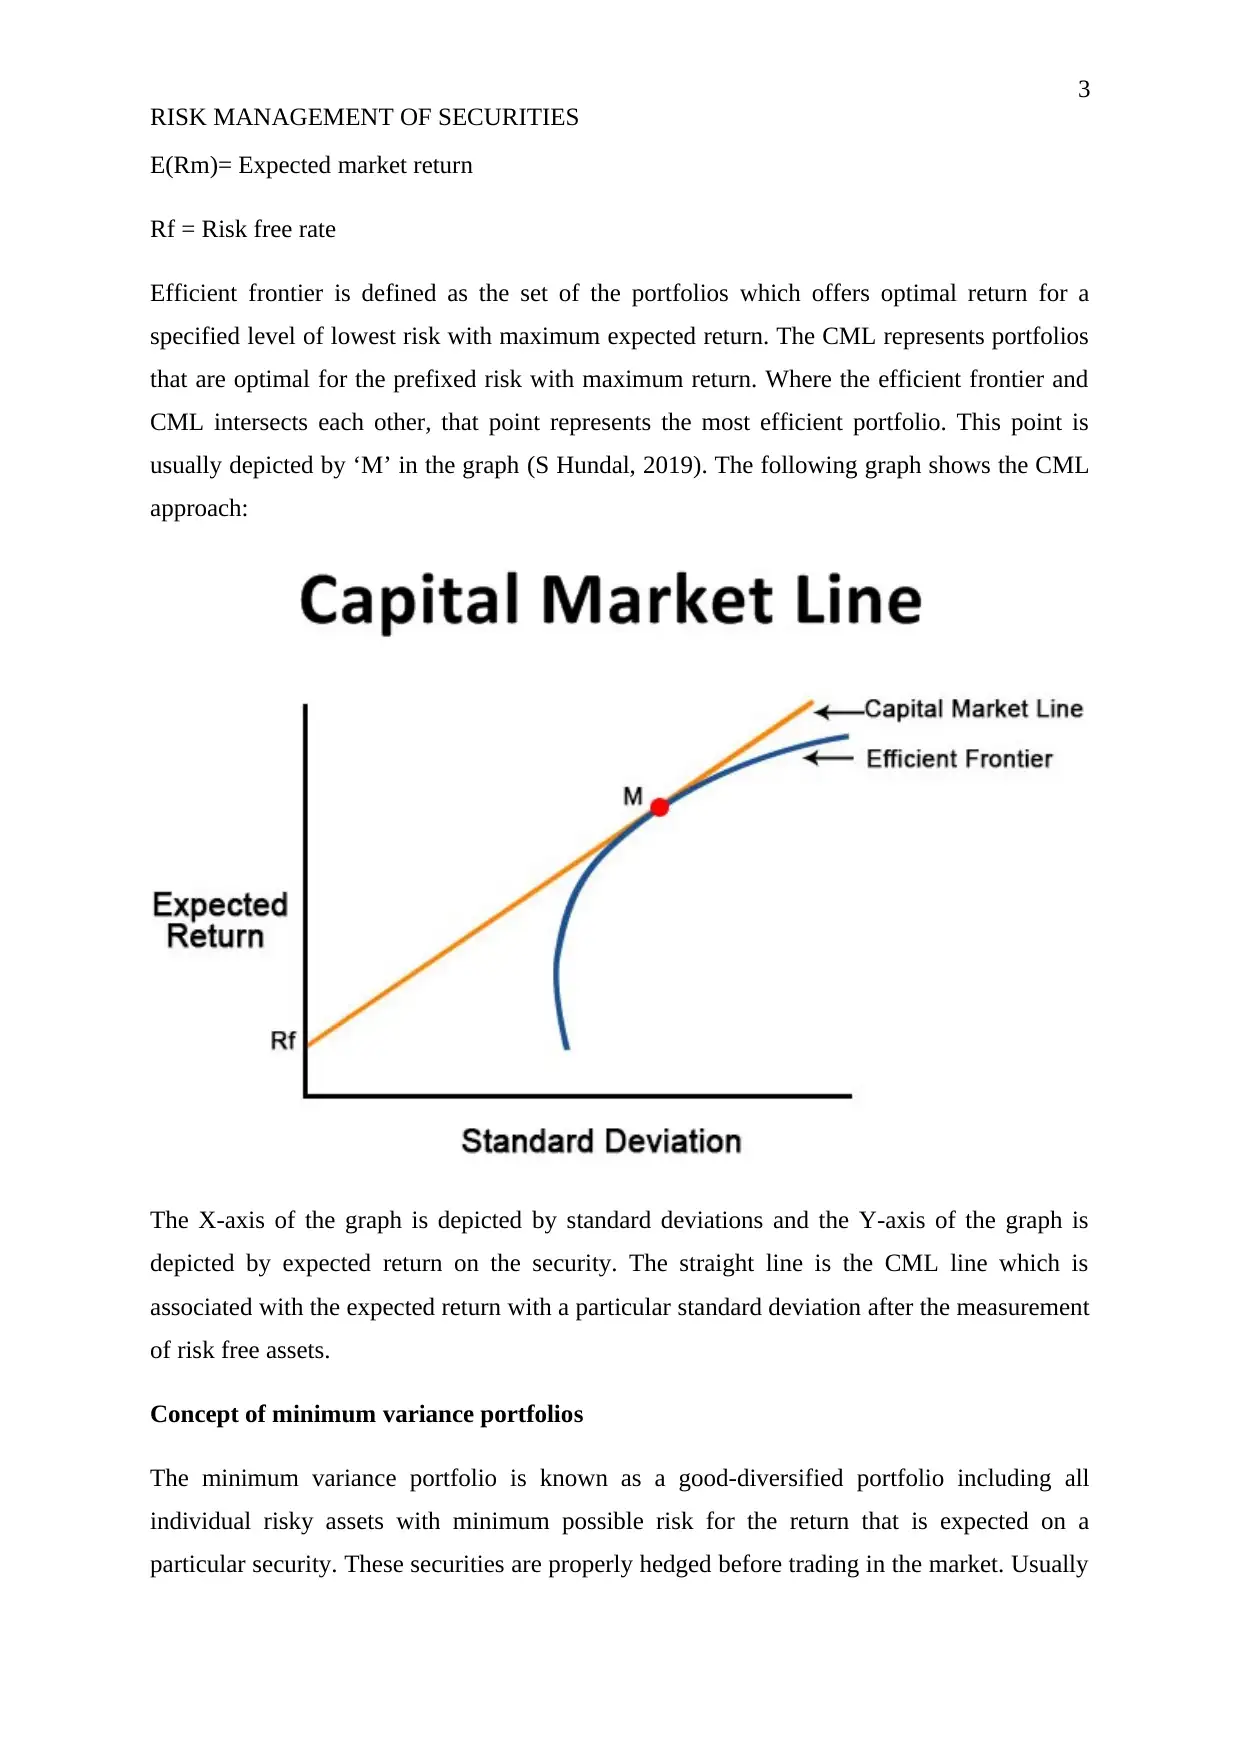
Efficient frontier is defined as the set of the portfolios which offers optimal return for a
specified level of lowest risk with maximum expected return. The CML represents portfolios
that are optimal for the prefixed risk with maximum return. Where the efficient frontier and
CML intersects each other, that point represents the most efficient portfolio. This point is
usually depicted by ‘M’ in the graph (S Hundal, 2019). The following graph shows the CML
approach:
The X-axis of the graph is depicted by standard deviations and the Y-axis of the graph is
depicted by expected return on the security. The straight line is the CML line which is
associated with the expected return with a particular standard deviation after the measurement
of risk free assets.
Concept of minimum variance portfolios
The minimum variance portfolio is known as a good-diversified portfolio including all
individual risky assets with minimum possible risk for the return that is expected on a
particular security. These securities are properly hedged before trading in the market. Usually
RISK MANAGEMENT OF SECURITIES
E(Rm)= Expected market return
Rf = Risk free rate
Efficient frontier is defined as the set of the portfolios which offers optimal return for a
specified level of lowest risk with maximum expected return. The CML represents portfolios
that are optimal for the prefixed risk with maximum return. Where the efficient frontier and
CML intersects each other, that point represents the most efficient portfolio. This point is
usually depicted by ‘M’ in the graph (S Hundal, 2019). The following graph shows the CML
approach:
The X-axis of the graph is depicted by standard deviations and the Y-axis of the graph is
depicted by expected return on the security. The straight line is the CML line which is
associated with the expected return with a particular standard deviation after the measurement
of risk free assets.
Concept of minimum variance portfolios
The minimum variance portfolio is known as a good-diversified portfolio including all
individual risky assets with minimum possible risk for the return that is expected on a
particular security. These securities are properly hedged before trading in the market. Usually
Paraphrase This Document
Need a fresh take? Get an instant paraphrase of this document with our AI Paraphraser
4
RISK MANAGEMENT OF SECURITIES
the investors are interested in knowing the expected return with minimum risk on their
minimum variance portfolios. CML approach focused on providing the return on the well-
diversified portfolios of the investors (TT Cai, 2019).
Importance of portfolios with minimum variance
The portfolios of minimum variance determine the minimum level of efficient frontier. It
means below the minimum variance related portfolio, all the portfolios are inefficient and that
is why no investor wants to invest in the portfolio which exists below the portfolios of
minimum variance. So the minimum variance of portfolio provides a guideline to protect the
investors from facing loss by investing in inefficient portfolios. This tool is very helpful for
the investors by protecting their portfolio against the high level of diversifiable risk.
However, non-diversifiable risk can-not be eliminated by using any method. It has to be bear
by the investors (O Tilfani, 2020).
Basic assumptions for CAPM model
CAPM model is based upon certain assumptions on the market conditions and the nature of
the investors on which the CAPM model calculated the expected return. Basic assumptions
are as follows:
(a) No taxation and no transaction fees are exist inside the market.
(b) All investors are risk averse.
(c) All investors have similar expectations with risk and return.
(d) All investors have homogeneous time horizon for buying the assets at a particular
time.
(e) All the assets are marketable and divisible.
(f) Total availability of assets.
(g) Markets are ideal.
(h) All investors have equal access of information.
(i) There are no restrictions in borrowing and lending of amount.
(j) Beta co-efficient is the only parameter to measure the risk.
(k) All the assets are in liquid form (JY Campbell, 2018).
(l) All the markets are in equilibrium position (S Hundal, 2019).
5
RISK MANAGEMENT OF SECURITIES
Accuracy of CAPM model in the comparison of other models
CAPM model is widely used by investor in comparison of other models because of its special
and unique features. The CAPM considers systematic risk into account with the help of beta,
which is mostly avoided by other models while calculating required rate of return. It also
considers financial risk variability into the calculation while the other models do not focus on
variability of risk with respect to time (L Qoqiauri, 2019). CAPM also based on the time
value of money concept while measuring the required rate of return which makes the model
more accurate and competent in comparison of other models like WACC model (S Hundal,
2019).
However the CAPM model is criticised due to the unrealistic assumptions. Like existence of
homogeneous market expectations involved in the assumptions of CAPM whereas it is very
unrealistic to have homogeneous market expectations. Still CAPM is widely used for its
accurate calculating features with the involvement of various risks (S Hundal, 2019).
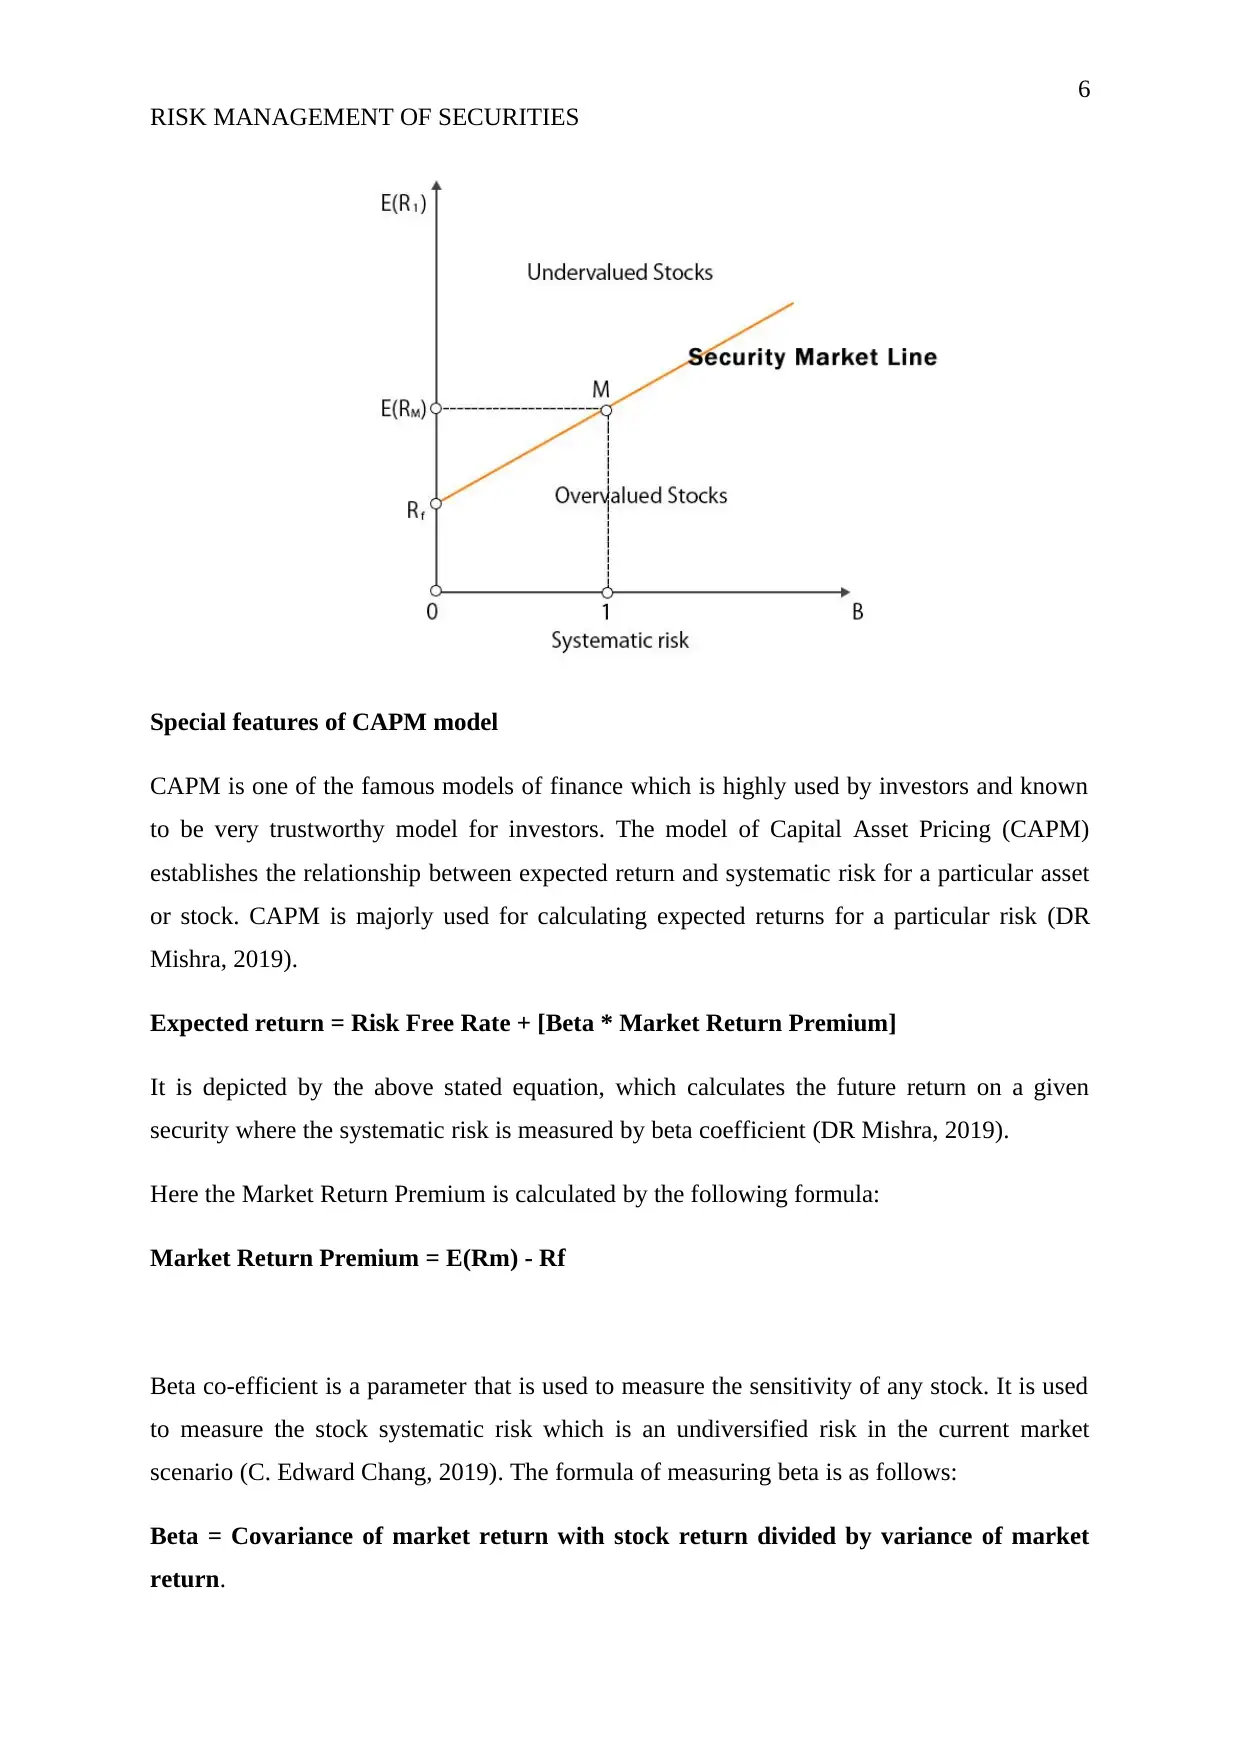
Concept of SML Approach
The SML approach or equation is a pictorial representation of the CAPM model, which
considers different level of risk with marketable securities. The X-axis on the chart represent
the risk factors associated with the securities in terms of beta whereas the Y-axis of the chart
represent the expected return on the security on a particular time with respect to certain risk.
It also takes undervalued and overvalued stock into consideration while measuring the risk
and return associated with any security (mojo, 2020).
RISK MANAGEMENT OF SECURITIES
Accuracy of CAPM model in the comparison of other models
CAPM model is widely used by investor in comparison of other models because of its special
and unique features. The CAPM considers systematic risk into account with the help of beta,
which is mostly avoided by other models while calculating required rate of return. It also
considers financial risk variability into the calculation while the other models do not focus on
variability of risk with respect to time (L Qoqiauri, 2019). CAPM also based on the time
value of money concept while measuring the required rate of return which makes the model
more accurate and competent in comparison of other models like WACC model (S Hundal,
2019).
However the CAPM model is criticised due to the unrealistic assumptions. Like existence of
homogeneous market expectations involved in the assumptions of CAPM whereas it is very
unrealistic to have homogeneous market expectations. Still CAPM is widely used for its
accurate calculating features with the involvement of various risks (S Hundal, 2019).
Concept of SML Approach
The SML approach or equation is a pictorial representation of the CAPM model, which
considers different level of risk with marketable securities. The X-axis on the chart represent
the risk factors associated with the securities in terms of beta whereas the Y-axis of the chart
represent the expected return on the security on a particular time with respect to certain risk.
It also takes undervalued and overvalued stock into consideration while measuring the risk
and return associated with any security (mojo, 2020).
⊘ This is a preview!⊘
Do you want full access?
Subscribe today to unlock all pages.
Trusted by 1+ million students worldwide
6
RISK MANAGEMENT OF SECURITIES
Special features of CAPM model
CAPM is one of the famous models of finance which is highly used by investors and known
to be very trustworthy model for investors. The model of Capital Asset Pricing (CAPM)
establishes the relationship between expected return and systematic risk for a particular asset
or stock. CAPM is majorly used for calculating expected returns for a particular risk (DR
Mishra, 2019).
Expected return = Risk Free Rate + [Beta * Market Return Premium]
It is depicted by the above stated equation, which calculates the future return on a given
security where the systematic risk is measured by beta coefficient (DR Mishra, 2019).
Here the Market Return Premium is calculated by the following formula:
Market Return Premium = E(Rm) - Rf
Beta co-efficient is a parameter that is used to measure the sensitivity of any stock. It is used
to measure the stock systematic risk which is an undiversified risk in the current market
scenario (C. Edward Chang, 2019). The formula of measuring beta is as follows:
Beta = Covariance of market return with stock return divided by variance of market
return.
Paraphrase This Document
Need a fresh take? Get an instant paraphrase of this document with our AI Paraphraser
7
RISK MANAGEMENT OF SECURITIES
Importance of Beta
Beta is very important parameter in investment management because it measures the risk of
an investment which cannot be diversified. Beta is used to measures the sensitivity of
systematic market risk which cannot be diversified by making changes in the portfolio. With
the help of Beta, investors may have an idea about the volatility in the market. Beta defines
the movement in securities returns with respect to the fluctuations in the market (Sunderman,
2019). However the Beta does not consider unsystematic risk into consideration but still it is
very helpful for the investors by having the idea about the volatility in the return of stock
related to fluctuations in the market (Glabadanidis, 2019).
Use of beta by investors:
(a) If any stock has Beta with exact numeric value 1, it represent that the stock is highly
co-related to the market fluctuations. It associated the same amount of systematic risk
with respect to the volatility of market (Sunderman, 2019).
(b) If any stock has Beta with numeric value less than 1, it represent that the stock is less
volatile with the fluctuations in the market. It shows that the stock has a very less
changes in its value with respect to changes in the systematic risk of market.
(c) If any stock has Beta with numeric value greater than 1, it represents the high
volatility with respect to the changes in the systematic risk of market. It shows that the
stock is very sensitive towards the fluctuations in the market (C. Edward Chang,
2019).
However, decision of the investor is very much depends upon the risk taking ability of
investors but still Beta represents a level of risk which is associated with any individual
asset or stock (C. Edward Chang, 2019).
The major differences between the concepts of CML and SML Lines
The full form of term CML is Capital market line whereas the SML presents the concept of
Security market line. The major difference between CML and SML is how the risk factor is
measured. Although, both of the approaches are used to measure the relationship between
risk and return but the difference is only in the process of calculating the risk factor in both
the approaches. Standard deviation is calculated to measure associated risk factors in CML
8
RISK MANAGEMENT OF SECURITIES
approach whereas beta co-efficient is used to measure the risk factor in SML approach
(between.net, 2020).
The graph which represent only Capital market line is only focuses over efficient portfolios
whereas the graph of SML defines both the efficient and non-efficient portfolios. The assets
which are risk free and return on the market portfolio are determined by the approach of
CML whereas security factors of all types are determined by SML approach. SML is
basically focuses over the risk and return relationship of individual stocks whereas CML
approach is focuses over the risk and relationship of return on the whole portfolio of assets, it
does not consider return on single or individual stock. Although, the major objectives of both
the approaches are same, both of the approaches used to measure return and risk on stocks
but the method of measuring is different in the approaches (between.net, 2020).
Conclusion
On the bases of above analysis of CML approach and CAPM model with SML approach with
Beta measurement, it can be said that CAPM model is very useful for the investors because it
provides guidelines to invest in profitable assets by protecting the investors with huge risk.
Beta measurement also guides the investors by providing the status of security with related to
its volatility with market fluctuations.
Recommendations for the investors
Investment management is a very crucial field because no model can predict exact return
related to the securities because of the presence of a large amount of non-diversifiable risk
present inside the market (O Wagdi, 2016). That is why an investor has to hedge its portfolio
properly by knowing the maximum risk in the assets in which he is going to invest. Investors
should take the help of CAPM model and CML approach by making sure about the
maximum return associated with minimum risk for the portfolio of assets (EG De Giorgi,
2019).
In portfolio management risk and return trade- off is very difficult and uncertain because of
the extremely volatility of the market but by taking the help of Beta measurement an investor
can be ensure about the sensitivity of the stock with respect to fluctuations in the market
(Kittipat Laisasikorn, 2019). There is always systematic and unsystematic risks are associated
⊘ This is a preview!⊘
Do you want full access?
Subscribe today to unlock all pages.
Trusted by 1+ million students worldwide

9
RISK MANAGEMENT OF SECURITIES
with the securities. However, systematic risk is a non-diversifiable risk because it is linked
with the fluctuations in the market whereas unsystematic risk can be diversifies by adding or
reducing particular securities from the portfolios. That is why it is very important for the
investors by using hedging tools for getting maximum profit from their portfolios (finweek,
2019).
Paraphrase This Document
Need a fresh take? Get an instant paraphrase of this document with our AI Paraphraser
10
RISK MANAGEMENT OF SECURITIES
References
between.net, D., 2020. Difference Between CML and SML. [Online]
Available at: http://www.differencebetween.net/business/difference-between-cml-and-sml/
[Accessed 15 January 2020].
C. Edward Chang, T. M. K. a. C. T. M., 2019. Intelligent Selection of Smart Beta Mutual
Funds. The Journal of Wealth Management , 22(1), pp. 10-23.
DR Mishra, T. O., 2019. Fama-French, CAPM, and implied cost of equity. Journal of
Economics and Business, Volume 101, pp. 73-85.
EG De Giorgi, T. P. A. Y., 2019. A concave security market line. Journal of Banking &
Finance, Volume 106, pp. 65-81.
finweek, S. L. -., 2019. How to make the right decisions-portfolio management. finweek, pp.
19-19.
Glabadanidis, P., 2019. Smart Beta and Statistical Significance. The Journal of Wealth
Management.
JY Campbell, S. G. C. P. R. T., 2018. An intertemporal CAPM with stochastic volatility.
Journal of Financial Economics, 128(2), pp. 207-233.
Kittipat Laisasikorn, N. R., 2019. A Study of the Relationship Between a Successful
Enterprise Risk Management System, a Performance Measurement System and the Financial
Performance of Thai Listed Companies. American Journal of Business, 10(2).
L Qoqiauri, N. Q., 2019. Main Regulations of CAPM Model and Its Modern Modification.
Management, 7(1), pp. 15-32.
11
RISK MANAGEMENT OF SECURITIES
mojo, W. s., 2020. Security Market Line (SML). [Online]
Available at: https://www.wallstreetmojo.com/security-market-line/
[Accessed 17 January 2020].
O Tilfani, P. F. M. E. B., 2020. Multiscale optimal portfolios using CAPM fractal regression:
estimation for emerging stock markets. Post-Communist Economies, 32(1), pp. 77-112.
O Wagdi, Y. T., 2016. The impact of financial risk on systematic risks: international
evidence. Journal of Applied Finance & Banking, 9(6).
S Hundal, A. E. D. T., 2019. Risk–return relationship in the Finnish stock market in the light
of Capital Asset Pricing Model (CAPM). Journal of Transnational Management , 24(4), pp.
305-322.
Sunderman, M., 2019. Housing'Beta'Common Risk Factor in Returns of Stocks. Journal of
Real Estate Finance and Economics .
TT Cai, J. H. Y. L. X. Z., 2019. High-dimensional minimum variance portfolio estimation
based on high-frequency data. Journal of Econometrics.
VI OSAYI, H. E. M. D., 2019. Risk Management Approach and Banks’ Portfolio Investment.
Risk management, 10(6).
⊘ This is a preview!⊘
Do you want full access?
Subscribe today to unlock all pages.
Trusted by 1+ million students worldwide
1 out of 12
Related Documents


Your All-in-One AI-Powered Toolkit for Academic Success.
+13062052269
info@desklib.com
Available 24*7 on WhatsApp / Email
![[object Object]](/_next/static/media/star-bottom.7253800d.svg)
Unlock your academic potential
Copyright © 2020–2026 A2Z Services. All Rights Reserved. Developed and managed by ZUCOL.