Security Analysis and Portfolio Management Report - University X
VerifiedAdded on 2023/01/11
|14
|3687
|67
Report
AI Summary
This report provides a comprehensive analysis of security analysis and portfolio management, addressing key concepts such as investment, risk assessment, and the relationship between risk and return. It explores bond valuation, including price-yield curves and yield to maturity calculations. The report also delves into the gender divide in investment, examining how factors like risk aversion, overconfidence, psychological influences, education, and behavioral biases affect investment decisions made by women. Furthermore, it highlights the importance of financial education in bridging this gap and promoting greater female participation in financial markets. The report concludes by emphasizing that while women may invest differently than men, their decisions can be equally successful. This report is a valuable resource for students studying finance and investment.

Security Analysis and Portfolio
Management
Management
Paraphrase This Document
Need a fresh take? Get an instant paraphrase of this document with our AI Paraphraser
TABLE OF CONTENTS
INTRODUCTION......................................................................................................................3
Question 1..................................................................................................................................3
SECTION B...............................................................................................................................7
Question 2..................................................................................................................................7
1. Price-yield curve for a zero-coupon bond with a face value of £100 and 260...................7
2 Given a 10-year, 8% coupon bond with a face value of £100 and semi-annual coupon
payments................................................................................................................................9
3. Why the yield curve for lower quality bonds could be negatively sloped when the yield
curves for other bonds are not..............................................................................................10
Question 3................................................................................................................................11
a) Determining the current yield and yield to maturity of the Bonds..................................11
b) Evaluating investment implication of the yield curves....................................................12
c) Factors affecting price, yield or duration of the fixed income securities.........................12
CONCLUSION........................................................................................................................12
REFERENCES.........................................................................................................................14
INTRODUCTION
Security analysis and portfolio management deals with managing different securities
and creating an investment objective for an individual. It referred to an art for selecting or
choosing best plans relating to investment for individual concern that guarantees or offers
maximum returns with minimal level of risk. The report includes several aspects of the
portfolio managing concepts and also highlights different types of bonds issued by
government.
Question 1
(i)
Investment involves making of the sacrifice in current with a hope to earn returns in
the future periods. The two major or most crucial features of investment are current sacrifice
and the future benefit. It includes several types of decisions like type, amount, grade, mix and
timing of an investment for decision making needs to be constant along with this investment
is defined as an activity which commits that the funds in any form that is physical or financial
in current condition with expectation of receiving an additional return in future. An
expectation comes up with probability with regards to proportion of the return that might vary
from low to high. Such probability of the variation in case of actual return is called or stated
as investment risk (Baron and et.al., 2019). Thus, each and every investment includes a risk
or the return. The relationship between the risk & return shows the fundamental financial
relationship which impacts an expected rate of return on each existing investment.
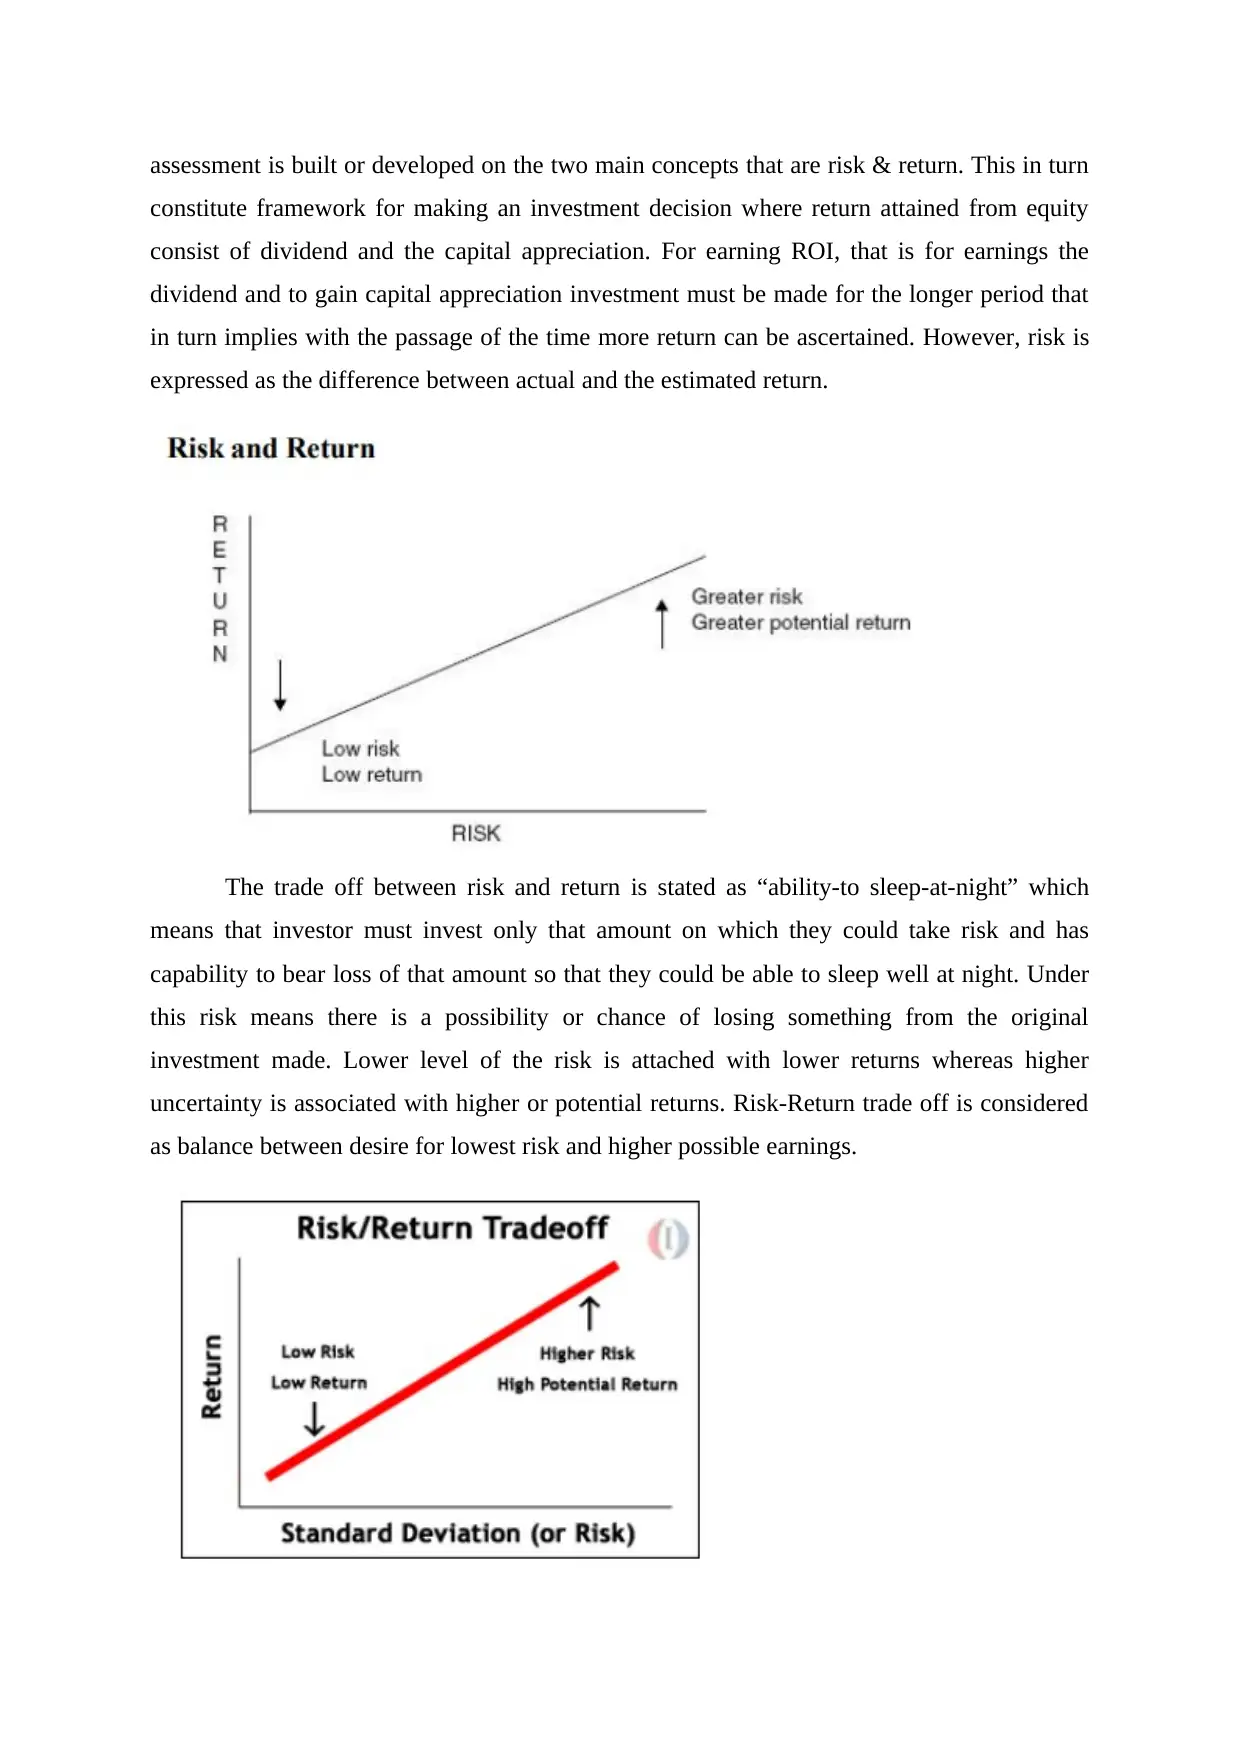
Risk-return relation is been characterized as positive or the direct relationship which
reflects that if there is expectation of the higher risk level attached with specific investment as
compared to greater returns are needed as compensation for higher expected risk. On the
other hand, if a particular investment has lower level of the expected risk then the investors
seems as satisfied with the low returns. This kind of relationship holds for the business
managers and individual investors. Higher degree of the risk indicates higher earnings on
investment which means that if an investor makes investment in the highly risky securities
then he or she must have expectation of earning higher returns. Since return of an investment
is associated with the degree of risk included, investors need to determine the quantum of
return which is appropriate for the given risk level. This procedure is known as “pricing risk”
in which investors’ measures or quantifies risk and then to decide adequate price for the risk
bear on the investment (Gong and et.al., 2017). The whole scenario relating to security
Security analysis and portfolio management deals with managing different securities
and creating an investment objective for an individual. It referred to an art for selecting or
choosing best plans relating to investment for individual concern that guarantees or offers
maximum returns with minimal level of risk. The report includes several aspects of the
portfolio managing concepts and also highlights different types of bonds issued by
government.
Question 1
(i)
Investment involves making of the sacrifice in current with a hope to earn returns in
the future periods. The two major or most crucial features of investment are current sacrifice
and the future benefit. It includes several types of decisions like type, amount, grade, mix and
timing of an investment for decision making needs to be constant along with this investment
is defined as an activity which commits that the funds in any form that is physical or financial
in current condition with expectation of receiving an additional return in future. An
expectation comes up with probability with regards to proportion of the return that might vary
from low to high. Such probability of the variation in case of actual return is called or stated
as investment risk (Baron and et.al., 2019). Thus, each and every investment includes a risk
or the return. The relationship between the risk & return shows the fundamental financial
relationship which impacts an expected rate of return on each existing investment.
Risk-return relation is been characterized as positive or the direct relationship which
reflects that if there is expectation of the higher risk level attached with specific investment as
compared to greater returns are needed as compensation for higher expected risk. On the
other hand, if a particular investment has lower level of the expected risk then the investors
seems as satisfied with the low returns. This kind of relationship holds for the business
managers and individual investors. Higher degree of the risk indicates higher earnings on
investment which means that if an investor makes investment in the highly risky securities
then he or she must have expectation of earning higher returns. Since return of an investment
is associated with the degree of risk included, investors need to determine the quantum of
return which is appropriate for the given risk level. This procedure is known as “pricing risk”
in which investors’ measures or quantifies risk and then to decide adequate price for the risk
bear on the investment (Gong and et.al., 2017). The whole scenario relating to security
⊘ This is a preview!⊘
Do you want full access?
Subscribe today to unlock all pages.
Trusted by 1+ million students worldwide
assessment is built or developed on the two main concepts that are risk & return. This in turn
constitute framework for making an investment decision where return attained from equity
consist of dividend and the capital appreciation. For earning ROI, that is for earnings the
dividend and to gain capital appreciation investment must be made for the longer period that
in turn implies with the passage of the time more return can be ascertained. However, risk is
expressed as the difference between actual and the estimated return.
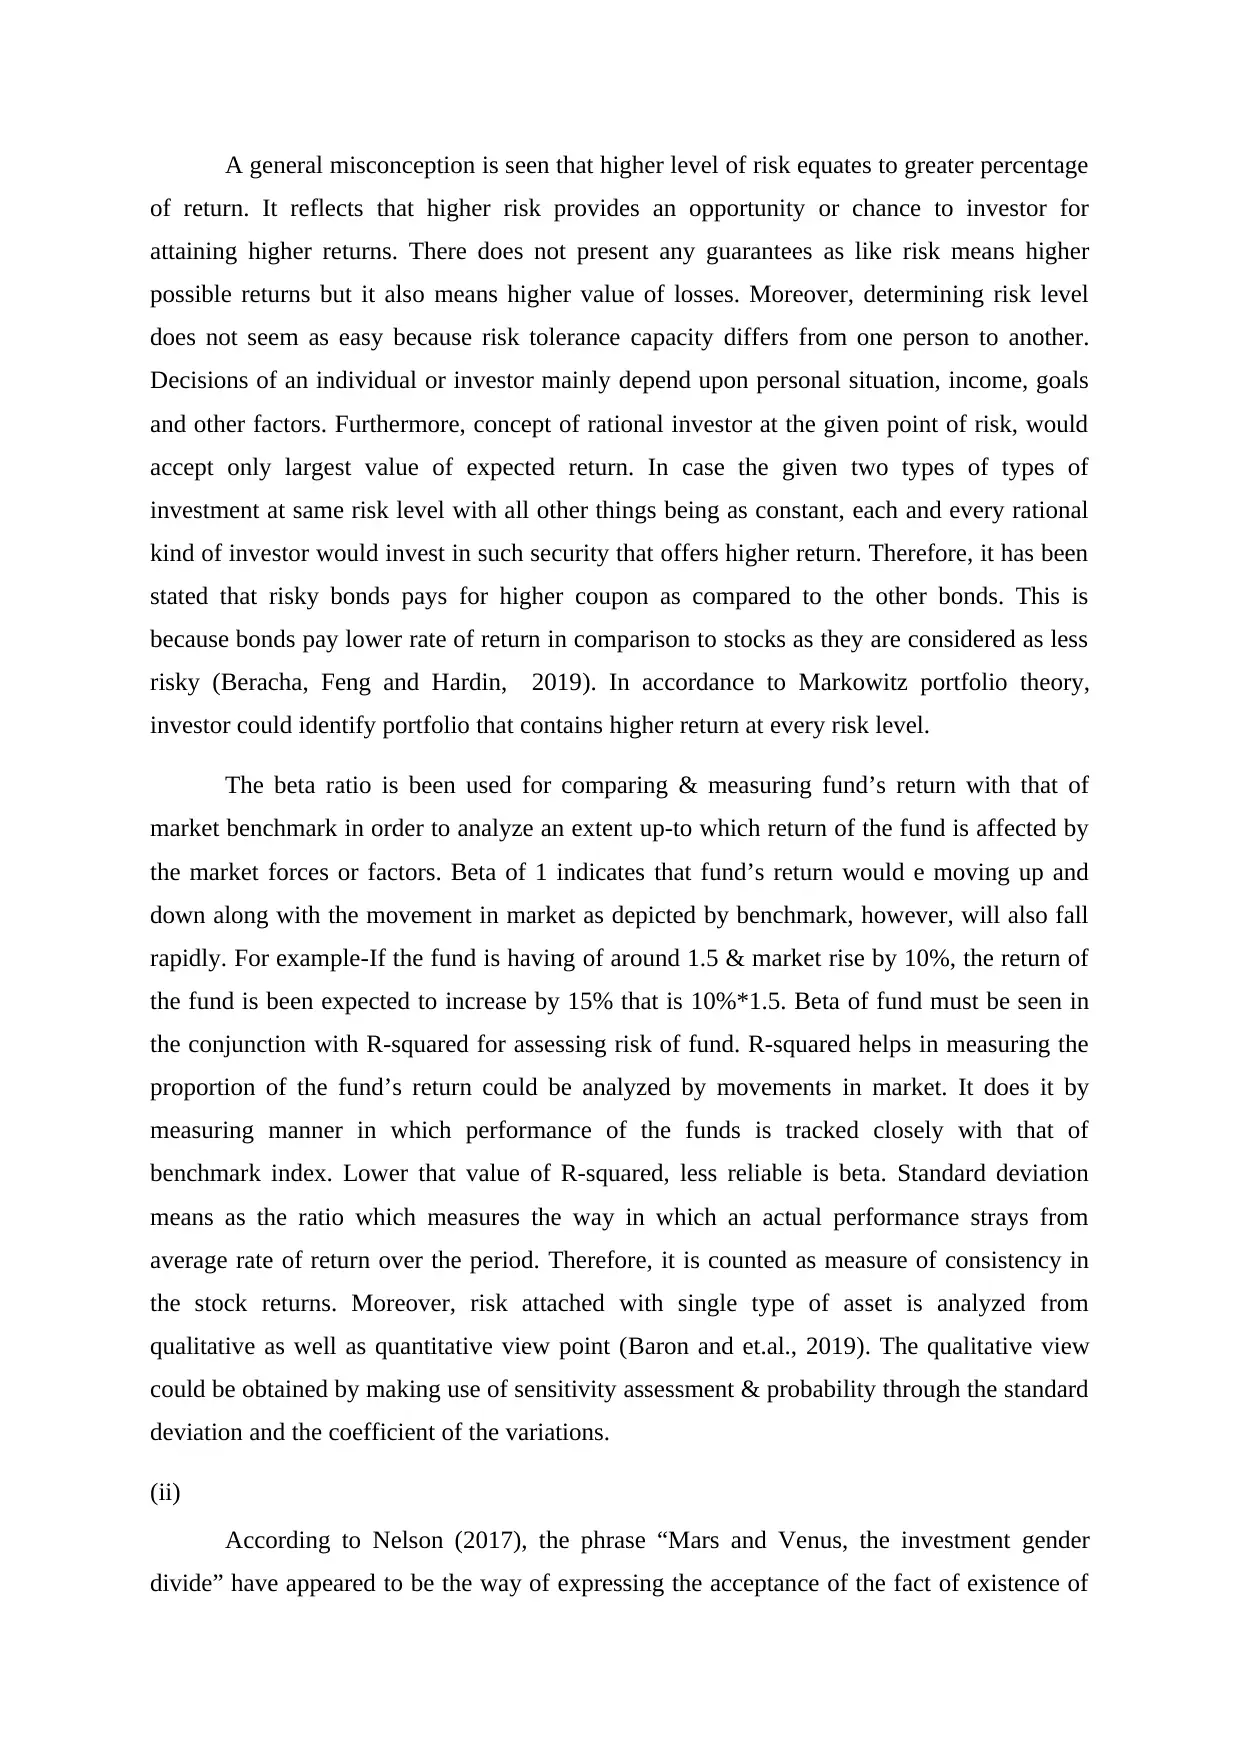
The trade off between risk and return is stated as “ability-to sleep-at-night” which
means that investor must invest only that amount on which they could take risk and has
capability to bear loss of that amount so that they could be able to sleep well at night. Under
this risk means there is a possibility or chance of losing something from the original
investment made. Lower level of the risk is attached with lower returns whereas higher
uncertainty is associated with higher or potential returns. Risk-Return trade off is considered
as balance between desire for lowest risk and higher possible earnings.
constitute framework for making an investment decision where return attained from equity
consist of dividend and the capital appreciation. For earning ROI, that is for earnings the
dividend and to gain capital appreciation investment must be made for the longer period that
in turn implies with the passage of the time more return can be ascertained. However, risk is
expressed as the difference between actual and the estimated return.
The trade off between risk and return is stated as “ability-to sleep-at-night” which
means that investor must invest only that amount on which they could take risk and has
capability to bear loss of that amount so that they could be able to sleep well at night. Under
this risk means there is a possibility or chance of losing something from the original
investment made. Lower level of the risk is attached with lower returns whereas higher
uncertainty is associated with higher or potential returns. Risk-Return trade off is considered
as balance between desire for lowest risk and higher possible earnings.
Paraphrase This Document
Need a fresh take? Get an instant paraphrase of this document with our AI Paraphraser
A general misconception is seen that higher level of risk equates to greater percentage
of return. It reflects that higher risk provides an opportunity or chance to investor for
attaining higher returns. There does not present any guarantees as like risk means higher
possible returns but it also means higher value of losses. Moreover, determining risk level
does not seem as easy because risk tolerance capacity differs from one person to another.
Decisions of an individual or investor mainly depend upon personal situation, income, goals
and other factors. Furthermore, concept of rational investor at the given point of risk, would
accept only largest value of expected return. In case the given two types of types of
investment at same risk level with all other things being as constant, each and every rational
kind of investor would invest in such security that offers higher return. Therefore, it has been
stated that risky bonds pays for higher coupon as compared to the other bonds. This is
because bonds pay lower rate of return in comparison to stocks as they are considered as less
risky (Beracha, Feng and Hardin, 2019). In accordance to Markowitz portfolio theory,
investor could identify portfolio that contains higher return at every risk level.
The beta ratio is been used for comparing & measuring fund’s return with that of
market benchmark in order to analyze an extent up-to which return of the fund is affected by
the market forces or factors. Beta of 1 indicates that fund’s return would e moving up and
down along with the movement in market as depicted by benchmark, however, will also fall
rapidly. For example-If the fund is having of around 1.5 & market rise by 10%, the return of
the fund is been expected to increase by 15% that is 10%*1.5. Beta of fund must be seen in
the conjunction with R-squared for assessing risk of fund. R-squared helps in measuring the
proportion of the fund’s return could be analyzed by movements in market. It does it by
measuring manner in which performance of the funds is tracked closely with that of
benchmark index. Lower that value of R-squared, less reliable is beta. Standard deviation
means as the ratio which measures the way in which an actual performance strays from
average rate of return over the period. Therefore, it is counted as measure of consistency in
the stock returns. Moreover, risk attached with single type of asset is analyzed from
qualitative as well as quantitative view point (Baron and et.al., 2019). The qualitative view
could be obtained by making use of sensitivity assessment & probability through the standard
deviation and the coefficient of the variations.
(ii)
According to Nelson (2017), the phrase “Mars and Venus, the investment gender
divide” have appeared to be the way of expressing the acceptance of the fact of existence of

gender differences. Here men are from Mars and women are from Venus which is the title of
the book written by John Gray in 1992 for showing the difference between the two gender
and as stated by Norma Cohen. The difference in the thinking is the major factor and not the
gender. The environment and culture in which both men and women grown has a huge
impact on their thinking process. There are many differences between the males and females
in different domains and here the difference is been discussed in the financial domain and
more specific to the financial decision making process. People invests in the variety of asset
classes but the there is a big difference between the portfolios of men and women.
There are various factors that influences the investment making decisions of women.
The very first influencing factor is risk-aversion. In general, there are many differences on the
perception of risk and these differences can be found in 5 domains which are, gambling,
health, social domain, recreation and other activities related to potential payoff and other
fixed small costs. The masculinity and femininity play an important role in financial decision
making. The feminists tend to take less level of financial risk in comparison to the
masculinity. In a study byOsili and et.al(2018), females are generally more conservative
investors and men are more aggressiveIf the level of risk aversion is high by the women and
other minorities, the greater conservatism will lead to the lower income replacement but it
has also been said that among all women, the cohabitant women are the most aggressive in
terms of decision making. Also, the factor of risk aversion is also related to the age, marital
status and the level of education. For instance, every young and single woman will choose the
lower risk investment and the level of risk tolerance is dependent upon the education. As the
people will be having more financial and investment related knowledge, lesser the impact it
will have on the gender risk taking. Higher the education, higher will be the risk tolerance.
Second factor is overconfidence, men are usually overconfident than women as the men
basically overrate the expected earnings from the investmentwhich is because of the
overestimating the information provided while a rational investor will make the decision on
the transaction costs of the investment.
Third factor is the psychological factorswhich is having a great influence over the
women and the financial decision-making process. As per the research of Bucher‐Koenen and
et.al(2017), depression has the high impact over the choices made by the women for the
particular financial products and on the other hand, the emotional support from the important
people makes a positive contribution in tehri life for investment related decision making.
Fourth is education and experience of the person. It is mainly observed that men are usually
having more knowledge about the personal finance topics which may be because of the
⊘ This is a preview!⊘
Do you want full access?
Subscribe today to unlock all pages.
Trusted by 1+ million students worldwide
significant role of education and experience. In contrast to the men, women are less
motivated or enthusiastic about learning these topics of finance which leads to formation of
financial literacy gap among both the genders. There is a direct correlation between the
financial literacy and investment behaviour on the one side and the market participation on
the other side. Such knowledge should be given at the initial stage otherwise later on it is
difficult to get hands on it. Fifth is the behaviour, according to Bachmann (2016), women
who invest aggressively are affected by five behavioural biases, which are, disposition effect,
in which the investor has the tendency to sell the stock that has gained the value and hold the
stocks which has lost the value. Next is the herd behaviour, in this the investors imitates the
investment actions of others instead of following their own belief and information. Another is
availability heuristic, which is the phenomenon of identifying the likelihood of the event by
evaluating the easy instances. The last is hot hand fallacy, this is the wrong belief that the
certain random numbers or sequences might not to random and therefore, is positively auto
correlated.
All these behavioural factorshave a huge influence over the decision making process
of the women which causes a great difference between the portfolios of the two.But all these
factors are not fixed and measures can be taken to reduce this difference. The most important
and appropriate step that can be taken is changing the education system. Promoting financial
education among the women is very important which will help in increasing the female
participation.
It can be concluded that it is very right to say women invest differently than men
because of their different thinking but that doesn’t mean the decisions taken by them are
wrong or less gainful. Even though all these factors are for women by the most influencing
factor is the lack of financial knowledge if this factor is resolved then the problem of risk
aversion will take back seat and the higher number of transactions will be made by female in
the financial market. It will also build up the courage among the women.
SECTION B
Question 2
1. Price-yield curve for a zero-coupon bond with a face value of £100 and 260
Yields Values
0.04 97.2449
0.0425 97.0787
Paraphrase This Document
Need a fresh take? Get an instant paraphrase of this document with our AI Paraphraser
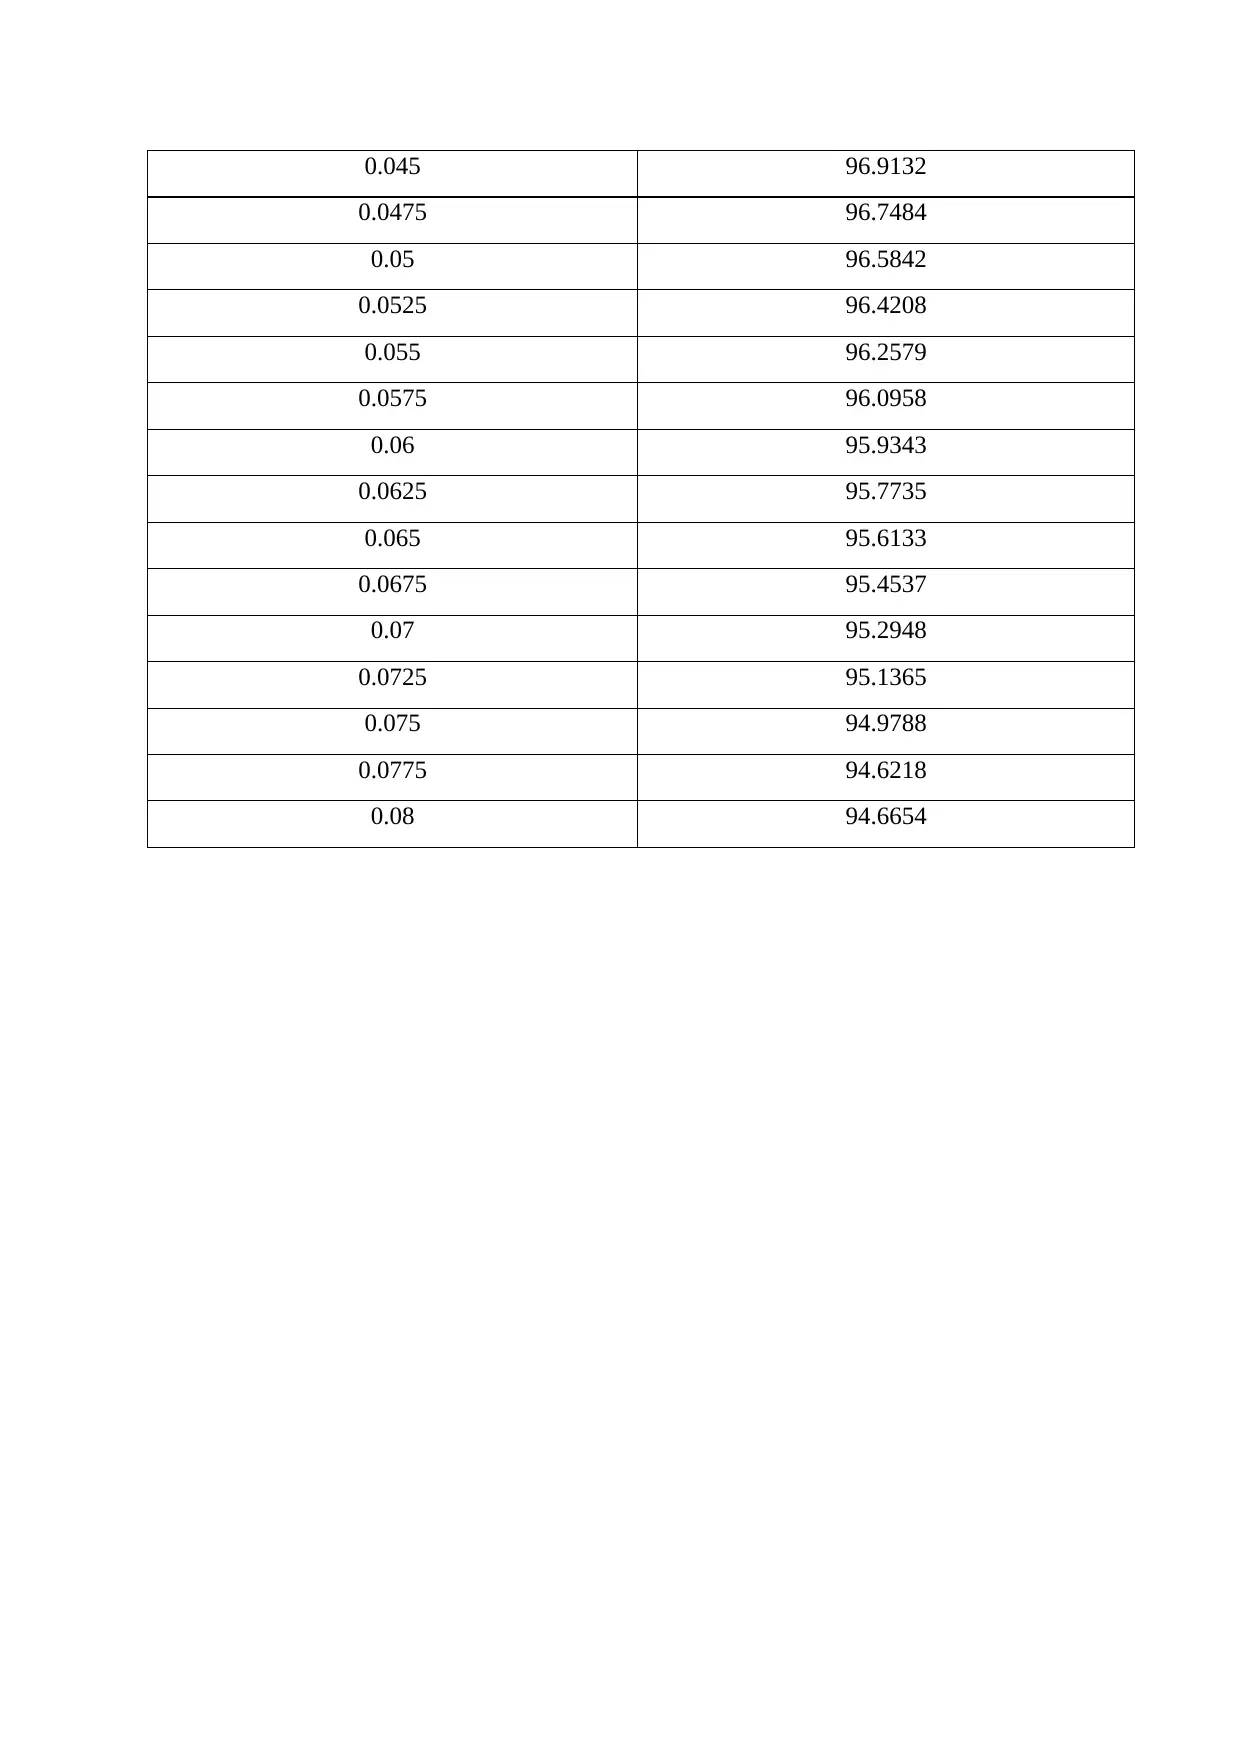
0.045 96.9132
0.0475 96.7484
0.05 96.5842
0.0525 96.4208
0.055 96.2579
0.0575 96.0958
0.06 95.9343
0.0625 95.7735
0.065 95.6133
0.0675 95.4537
0.07 95.2948
0.0725 95.1365
0.075 94.9788
0.0775 94.6218
0.08 94.6654
0.0475 96.7484
0.05 96.5842
0.0525 96.4208
0.055 96.2579
0.0575 96.0958
0.06 95.9343
0.0625 95.7735
0.065 95.6133
0.0675 95.4537
0.07 95.2948
0.0725 95.1365
0.075 94.9788
0.0775 94.6218
0.08 94.6654
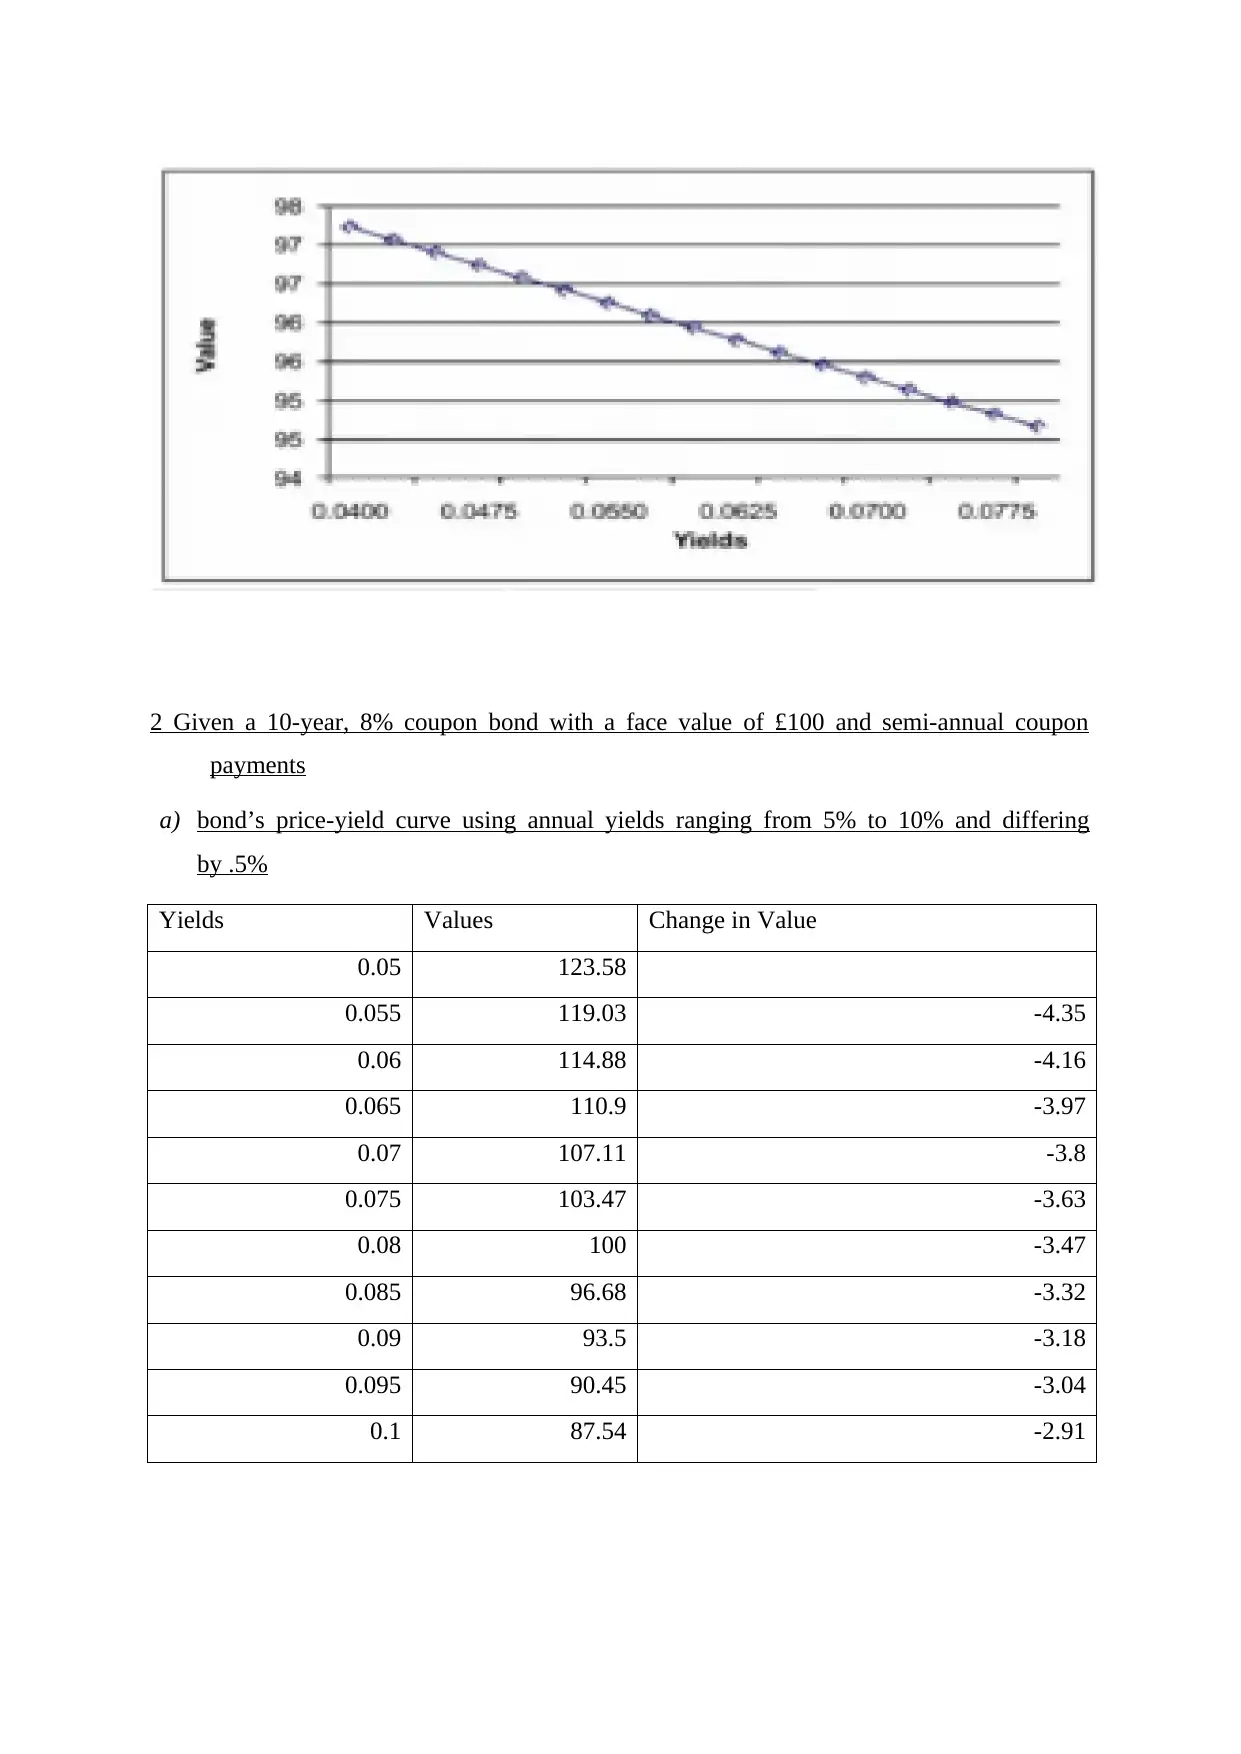
2 Given a 10-year, 8% coupon bond with a face value of £100 and semi-annual coupon
payments
a) bond’s price-yield curve using annual yields ranging from 5% to 10% and differing
by .5%
Yields Values Change in Value
0.05 123.58
0.055 119.03 -4.35
0.06 114.88 -4.16
0.065 110.9 -3.97
0.07 107.11 -3.8
0.075 103.47 -3.63
0.08 100 -3.47
0.085 96.68 -3.32
0.09 93.5 -3.18
0.095 90.45 -3.04
0.1 87.54 -2.91
⊘ This is a preview!⊘
Do you want full access?
Subscribe today to unlock all pages.
Trusted by 1+ million students worldwide
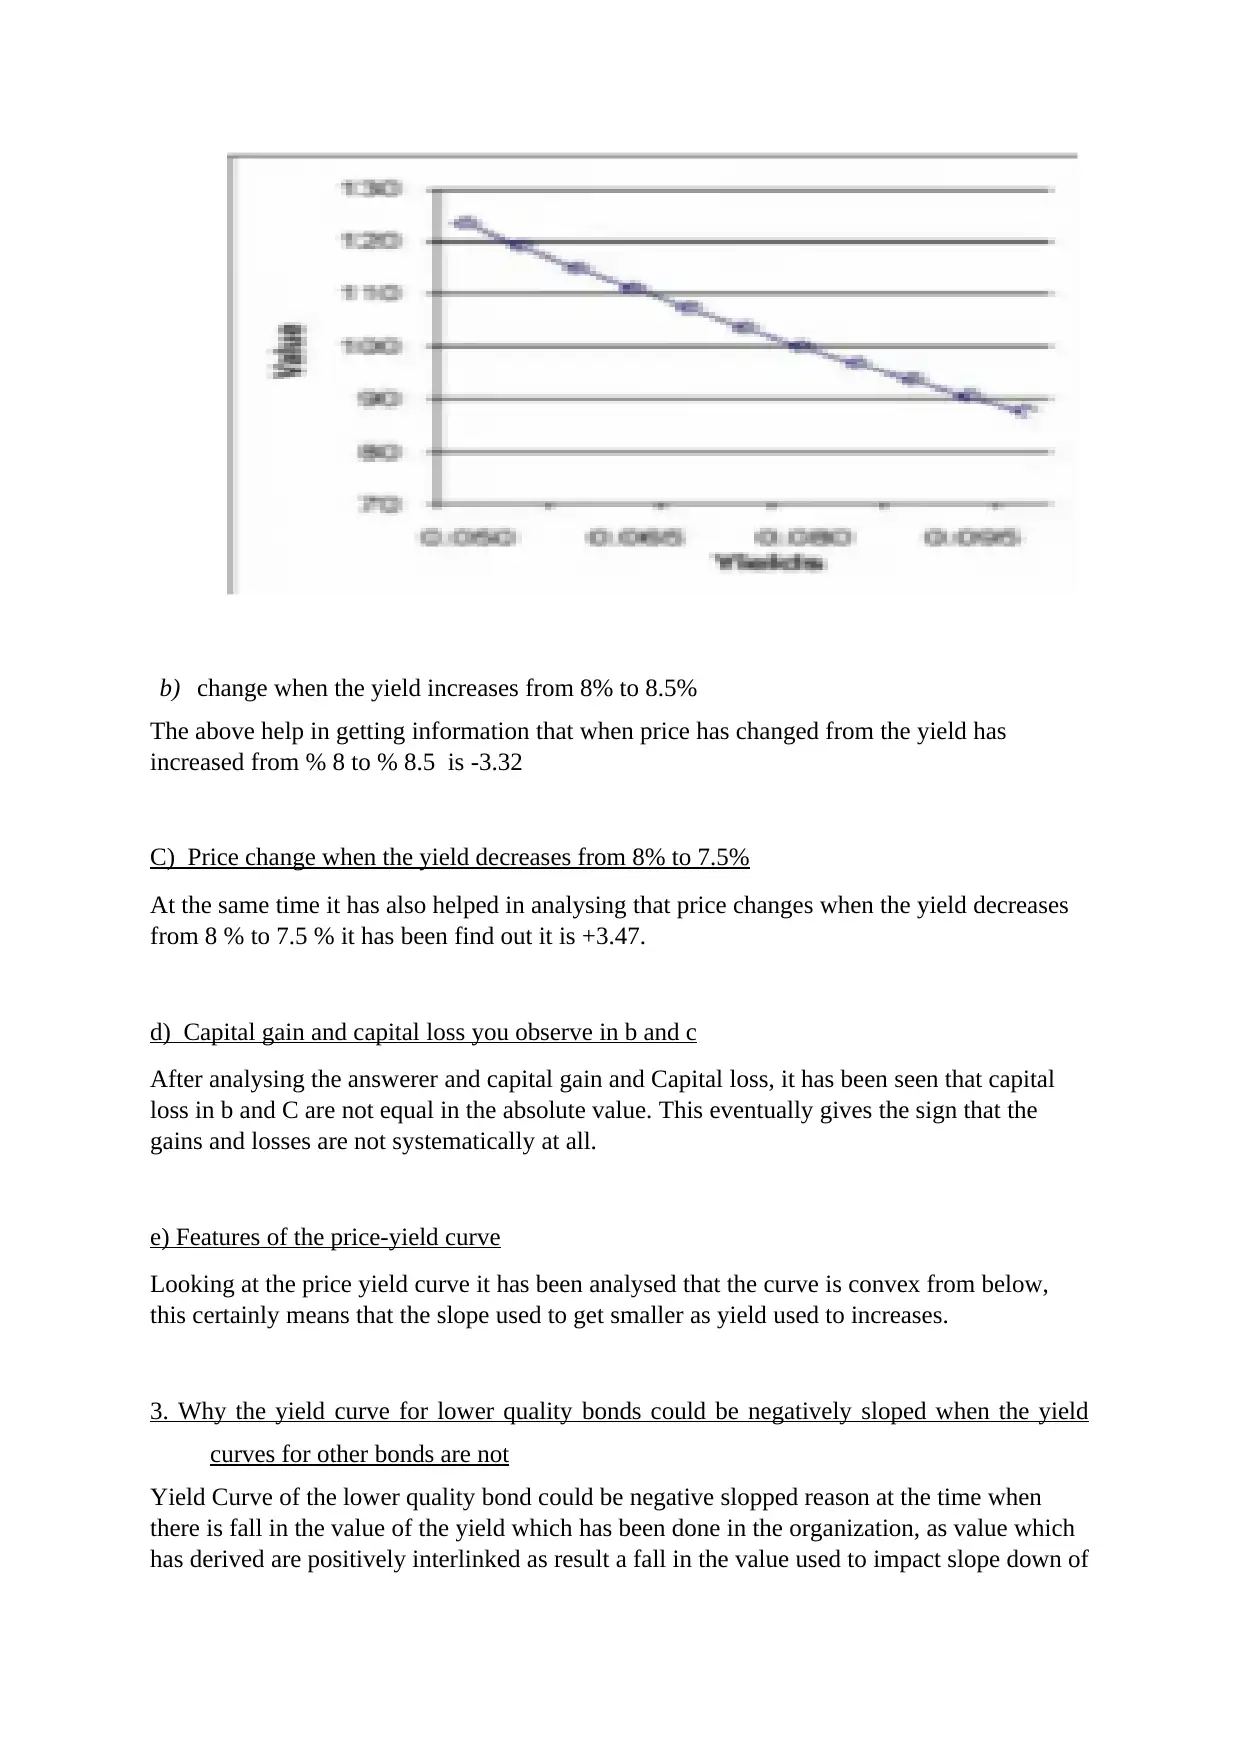
b) change when the yield increases from 8% to 8.5%
The above help in getting information that when price has changed from the yield has
increased from % 8 to % 8.5 is -3.32
C) Price change when the yield decreases from 8% to 7.5%
At the same time it has also helped in analysing that price changes when the yield decreases
from 8 % to 7.5 % it has been find out it is +3.47.
d) Capital gain and capital loss you observe in b and c
After analysing the answerer and capital gain and Capital loss, it has been seen that capital
loss in b and C are not equal in the absolute value. This eventually gives the sign that the
gains and losses are not systematically at all.
e) Features of the price-yield curve
Looking at the price yield curve it has been analysed that the curve is convex from below,
this certainly means that the slope used to get smaller as yield used to increases.
3. Why the yield curve for lower quality bonds could be negatively sloped when the yield
curves for other bonds are not
Yield Curve of the lower quality bond could be negative slopped reason at the time when
there is fall in the value of the yield which has been done in the organization, as value which
has derived are positively interlinked as result a fall in the value used to impact slope down of
Paraphrase This Document
Need a fresh take? Get an instant paraphrase of this document with our AI Paraphraser
the curve no value derived may result in seeing the slope at the point zero or it can also fall in
the negative side as well. So it is the only way in which the slope can also enter into the
negative aspect as well.
Question 3
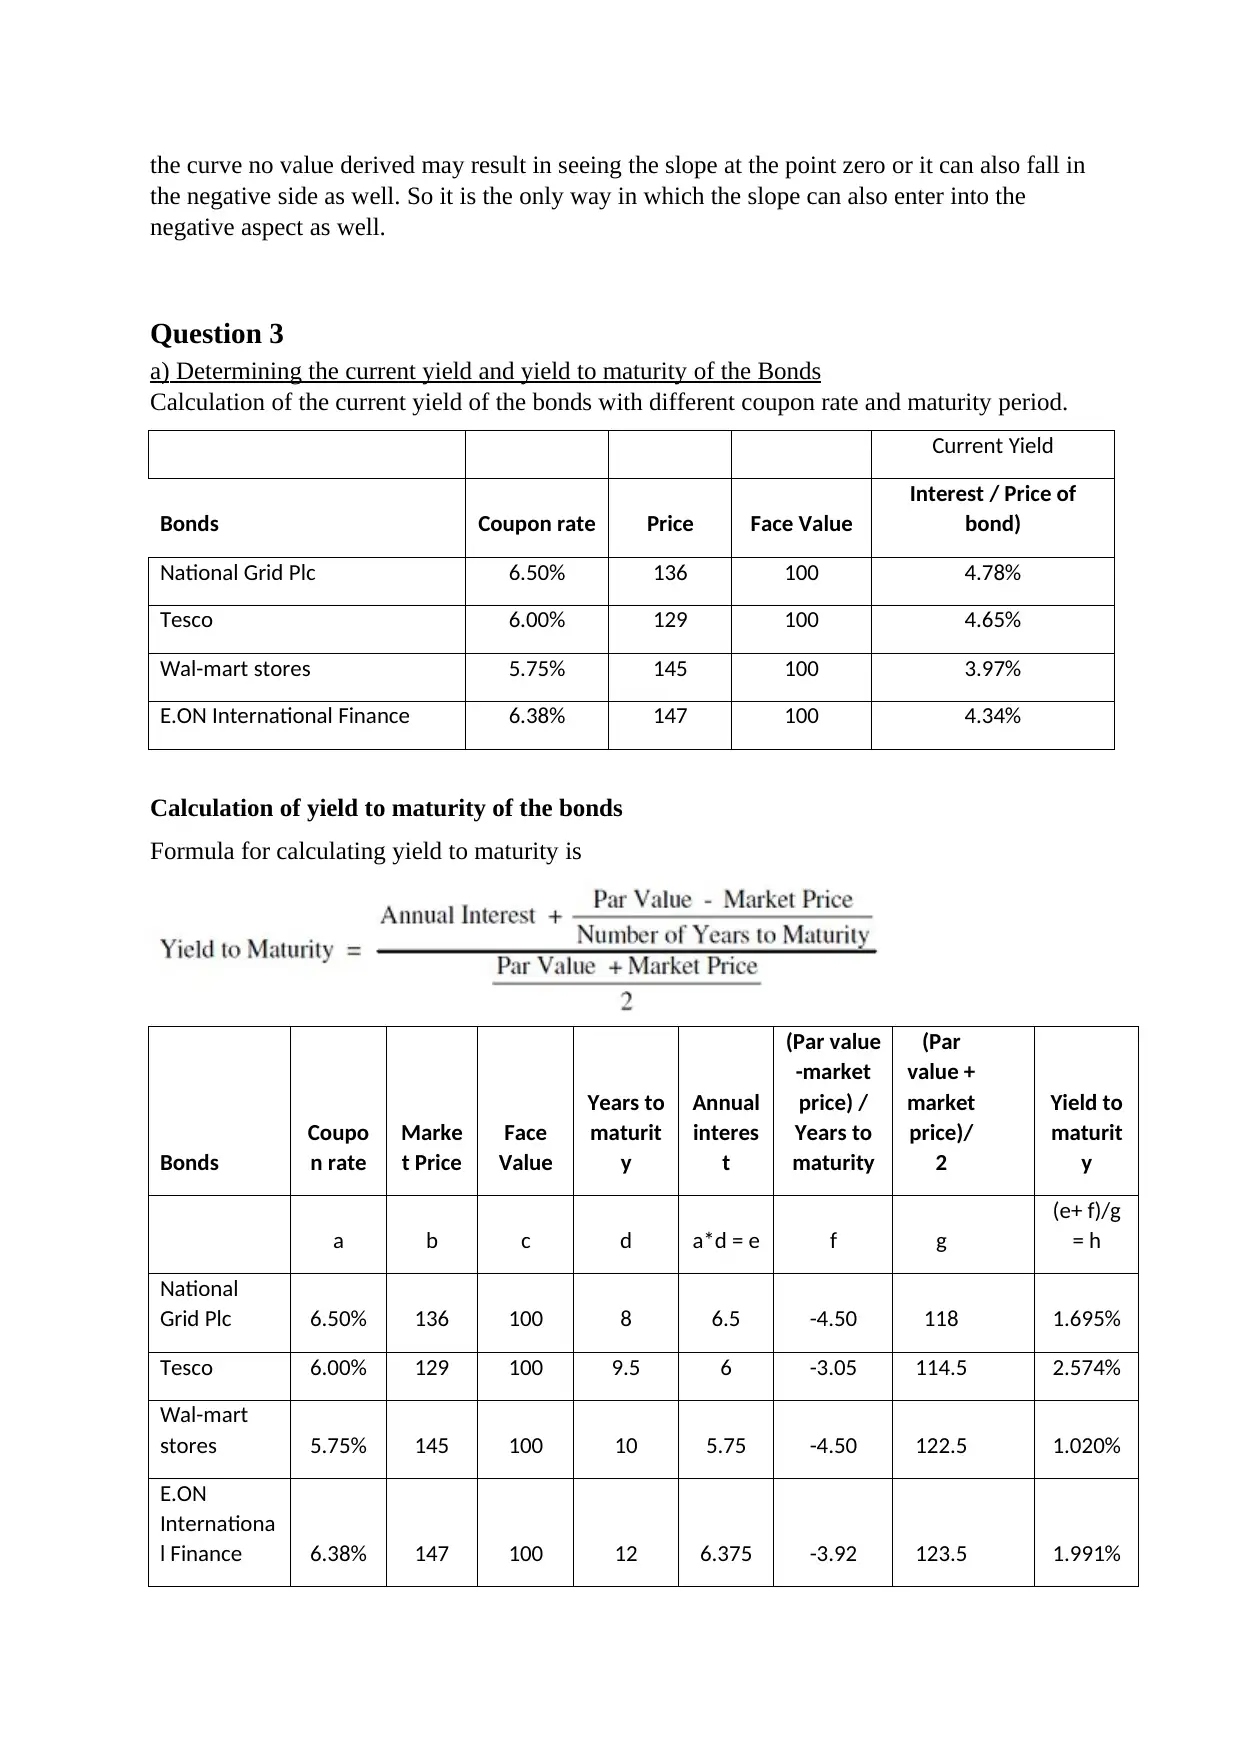
a) Determining the current yield and yield to maturity of the Bonds
Calculation of the current yield of the bonds with different coupon rate and maturity period.
Current Yield
Bonds Coupon rate Price Face Value
Interest / Price of
bond)
National Grid Plc 6.50% 136 100 4.78%
Tesco 6.00% 129 100 4.65%
Wal-mart stores 5.75% 145 100 3.97%
E.ON International Finance 6.38% 147 100 4.34%
Calculation of yield to maturity of the bonds
Formula for calculating yield to maturity is
Bonds
Coupo
n rate
Marke
t Price
Face
Value
Years to
maturit
y
Annual
interes
t
(Par value
-market
price) /
Years to
maturity
(Par
value +
market
price)/
2
Yield to
maturit
y
a b c d a*d = e f g
(e+ f)/g
= h
National
Grid Plc 6.50% 136 100 8 6.5 -4.50 118 1.695%
Tesco 6.00% 129 100 9.5 6 -3.05 114.5 2.574%
Wal-mart
stores 5.75% 145 100 10 5.75 -4.50 122.5 1.020%
E.ON
Internationa
l Finance 6.38% 147 100 12 6.375 -3.92 123.5 1.991%
the negative side as well. So it is the only way in which the slope can also enter into the
negative aspect as well.
Question 3
a) Determining the current yield and yield to maturity of the Bonds
Calculation of the current yield of the bonds with different coupon rate and maturity period.
Current Yield
Bonds Coupon rate Price Face Value
Interest / Price of
bond)
National Grid Plc 6.50% 136 100 4.78%
Tesco 6.00% 129 100 4.65%
Wal-mart stores 5.75% 145 100 3.97%
E.ON International Finance 6.38% 147 100 4.34%
Calculation of yield to maturity of the bonds
Formula for calculating yield to maturity is
Bonds
Coupo
n rate
Marke
t Price
Face
Value
Years to
maturit
y
Annual
interes
t
(Par value
-market
price) /
Years to
maturity
(Par
value +
market
price)/
2
Yield to
maturit
y
a b c d a*d = e f g
(e+ f)/g
= h
National
Grid Plc 6.50% 136 100 8 6.5 -4.50 118 1.695%
Tesco 6.00% 129 100 9.5 6 -3.05 114.5 2.574%
Wal-mart
stores 5.75% 145 100 10 5.75 -4.50 122.5 1.020%
E.ON
Internationa
l Finance 6.38% 147 100 12 6.375 -3.92 123.5 1.991%
b) Evaluating investment implication of the yield curves.
Yield curve refers to the graphical presentation of interest rates over debt for the range
of maturity periods. This shows yield investors expects to earn on lending money for the
specified period of time. graph display the yield from bond on vertical axis and time to
maturity over horizontal axis. Curve can take different shapes over different points in
economic cycle, but the curve is typically upward sloping. Investments with normal curves
have higher rate of interest giving higher return.
Inverted curve represents that long term yield is below the short term yield. This curve
is seen when the investors think that rate of interest will decline in future
(Zhang, Liu and Zhang, 2017). It is leading indicator of economic downturn.
Steep curve reflects that the long term yields of the securities are rising at faster than
short term yields. It reflects expansionary economic period. Steep and normal curves are
based over similar market conditions.
Flat Curve is means that the bonds with different maturities will have same yields. It
means yield of 30 year bond will be same as that of 10 year bond. It is seen over the
transitioning between normal and inverted yield curve.
c) Factors affecting price, yield or duration of the fixed income securities.
There are many factors affecting the prices yields and duration of securities.
Inflation
Central Bank tends to respond over rise in the expected inflation rate with the increase
in rate of interests. Rise in inflation will lead to decrease in the purchasing power and
investors expect increase in interest rate.
Economic Growth
Strong growth of economy leads to increase in the inflation due to the rise in
aggregate demand (Schinckus, 2018). It leads to higher yields and steeper curve.
Interest rates
If interest rates are raised by the Central Bank over treasuries, it will be resulting n
higher demand for the treasuries leading to decrease in the interest rates.
CONCLUSION
It can be summed up from the above that risk and return is the part of investment and
it is completely dependent upon the investor’sperspective. The difference of portfolio
management of both men and women is not because of gender but because of lack of
⊘ This is a preview!⊘
Do you want full access?
Subscribe today to unlock all pages.
Trusted by 1+ million students worldwide
1 out of 14
Related Documents


Your All-in-One AI-Powered Toolkit for Academic Success.
+13062052269
info@desklib.com
Available 24*7 on WhatsApp / Email
![[object Object]](/_next/static/media/star-bottom.7253800d.svg)
Unlock your academic potential
Copyright © 2020–2026 A2Z Services. All Rights Reserved. Developed and managed by ZUCOL.