Analysis of Corporate Financial Management: SML, CML, and CAPM Model
VerifiedAdded on 2023/06/05
|15
|2819
|317
Report
AI Summary
This report provides a detailed analysis of corporate financial management, focusing on the security market line (SML), capital market line (CML), minimum variance portfolios, and the capital asset pricing model (CAPM). It differentiates between CML and SML with graphical illustrations, emphasizes the significance of minimum variance portfolios in reducing price volatility and optimizing diversification, and explains the relevance of CAPM over other equations in calculating the required rate of return on investments, highlighting its benefits in making informed investment decisions. The report concludes that CAPM is preferred due to its consideration of systematic risk and ease of use compared to other complex models.
Running head: CORPORATE FINANCIAL MANAGEMENT
Corporate Financial Management
Name of the Student:
Name of the University:
Author’s Note:
Course ID:
Corporate Financial Management
Name of the Student:
Name of the University:
Author’s Note:
Course ID:
Paraphrase This Document
Need a fresh take? Get an instant paraphrase of this document with our AI Paraphraser

1CORPORATE FINANCIAL MANAGEMENT
Table of Contents
Introduction:....................................................................................................................................2
Differences between security market line (SML) and capital market line (CML) with graphical
illustration:.......................................................................................................................................2
Importance of minimum variance portfolios:..................................................................................7
Relevancy of CAPM over other equations when calculating required rate of return:.....................9
Conclusion:....................................................................................................................................12
References:....................................................................................................................................13
2CORPORATE FINANCIAL MANAGEMENT
Introduction:
The current assignment aims to deal with the various aspects related to corporate finance
with special emphasis provided to security analysis and portfolio management. The concepts of
security market line, capital market line, minimum variance portfolios and capital asset pricing
model (CAPM) are used by the investors so that they could form a portfolio of stocks based on
which investment decisions would be undertaken (Antoniou, Doukas and Subrahmanyam 2015).
The first section of the paper would highlight the key differences between security market line
(SML) and capital market line (CML) with the help of graphical representation. The second
segment would emphasise on describing the significance of minimum variance portfolios, as
they are widely used for analysing future risk and returns. Finally, the assignment would shed
light on explaining the relevance of CAPM over the other equations at the time of computing
required rate of return on a specific investment.
Differences between security market line (SML) and capital market line (CML) with
graphical illustration:
For differentiating between CML and SML, the efficient frontier could be taken into
consideration, which is illustrated as follows:
⊘ This is a preview!⊘
Do you want full access?
Subscribe today to unlock all pages.
Trusted by 1+ million students worldwide
3CORPORATE FINANCIAL MANAGEMENT
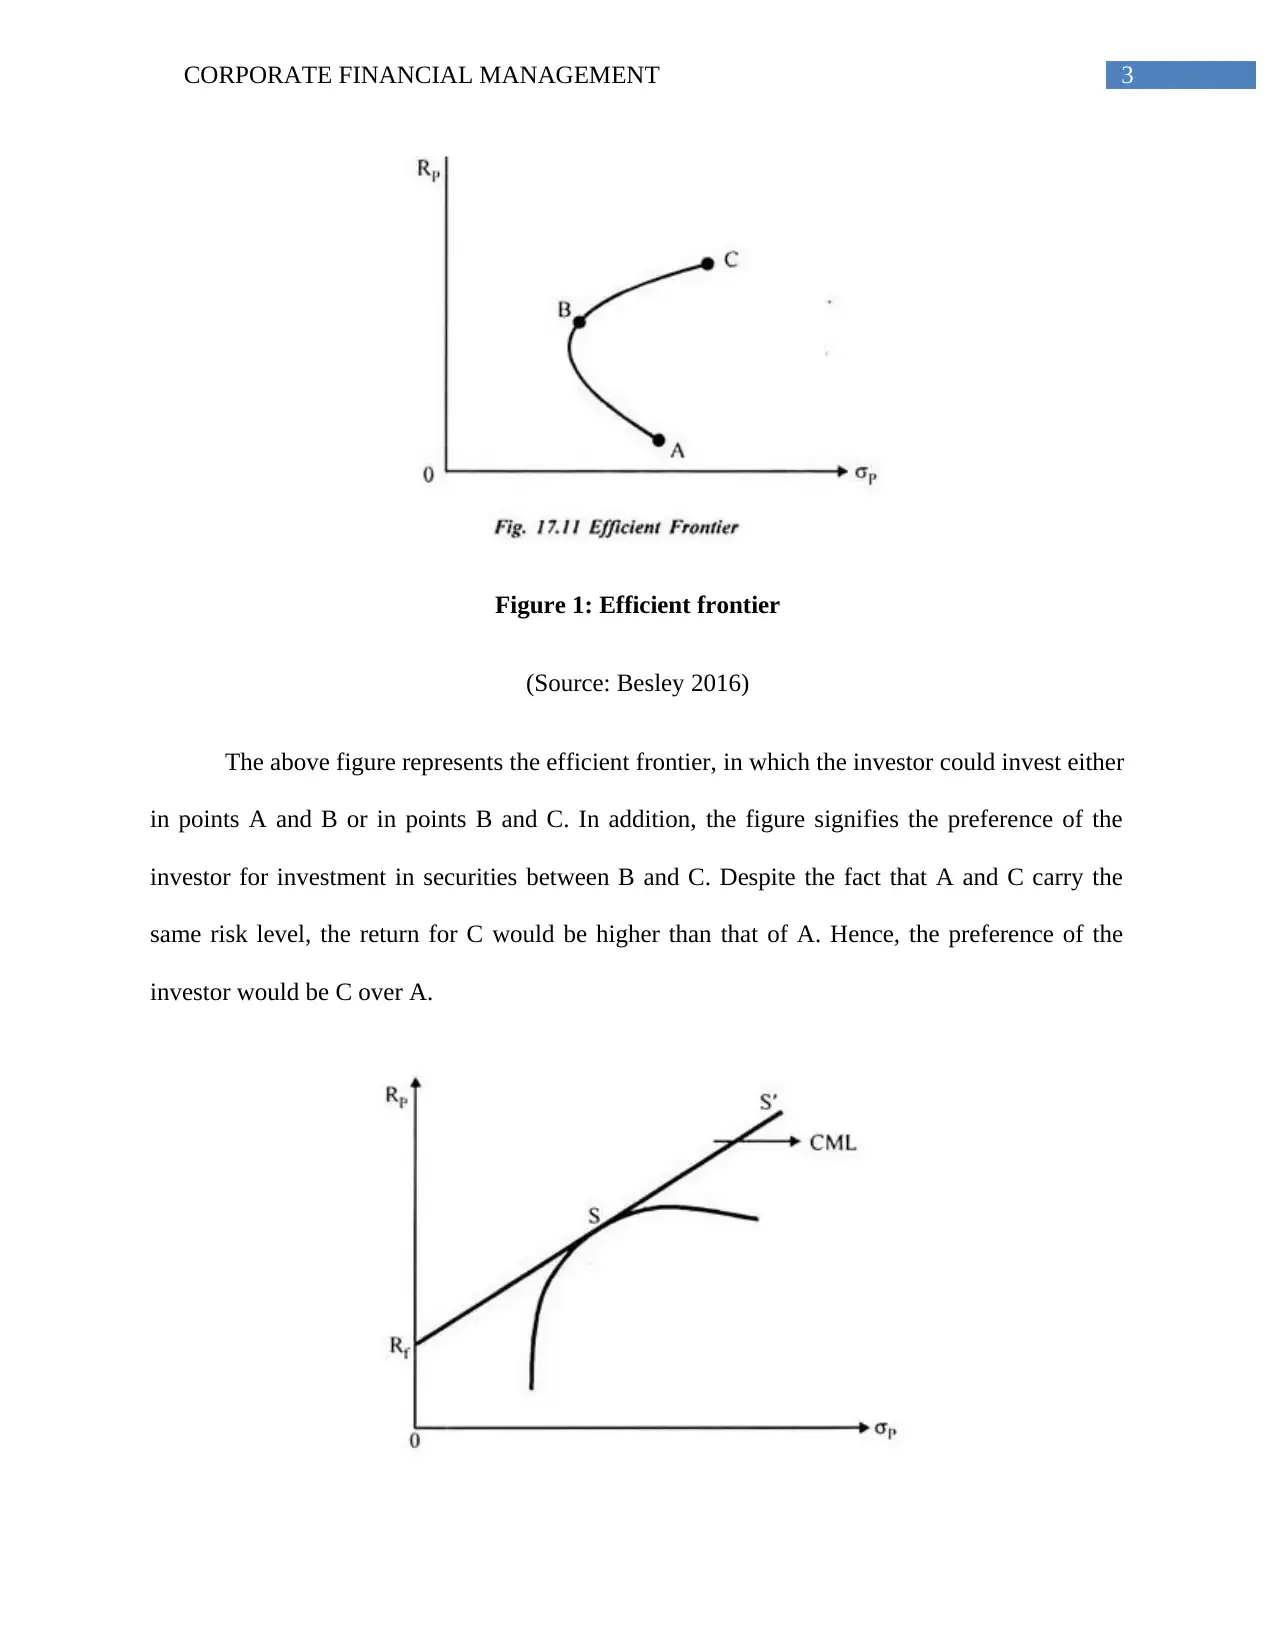
Figure 1: Efficient frontier
(Source: Besley 2016)
The above figure represents the efficient frontier, in which the investor could invest either
in points A and B or in points B and C. In addition, the figure signifies the preference of the
investor for investment in securities between B and C. Despite the fact that A and C carry the
same risk level, the return for C would be higher than that of A. Hence, the preference of the
investor would be C over A.
Paraphrase This Document
Need a fresh take? Get an instant paraphrase of this document with our AI Paraphraser
4CORPORATE FINANCIAL MANAGEMENT
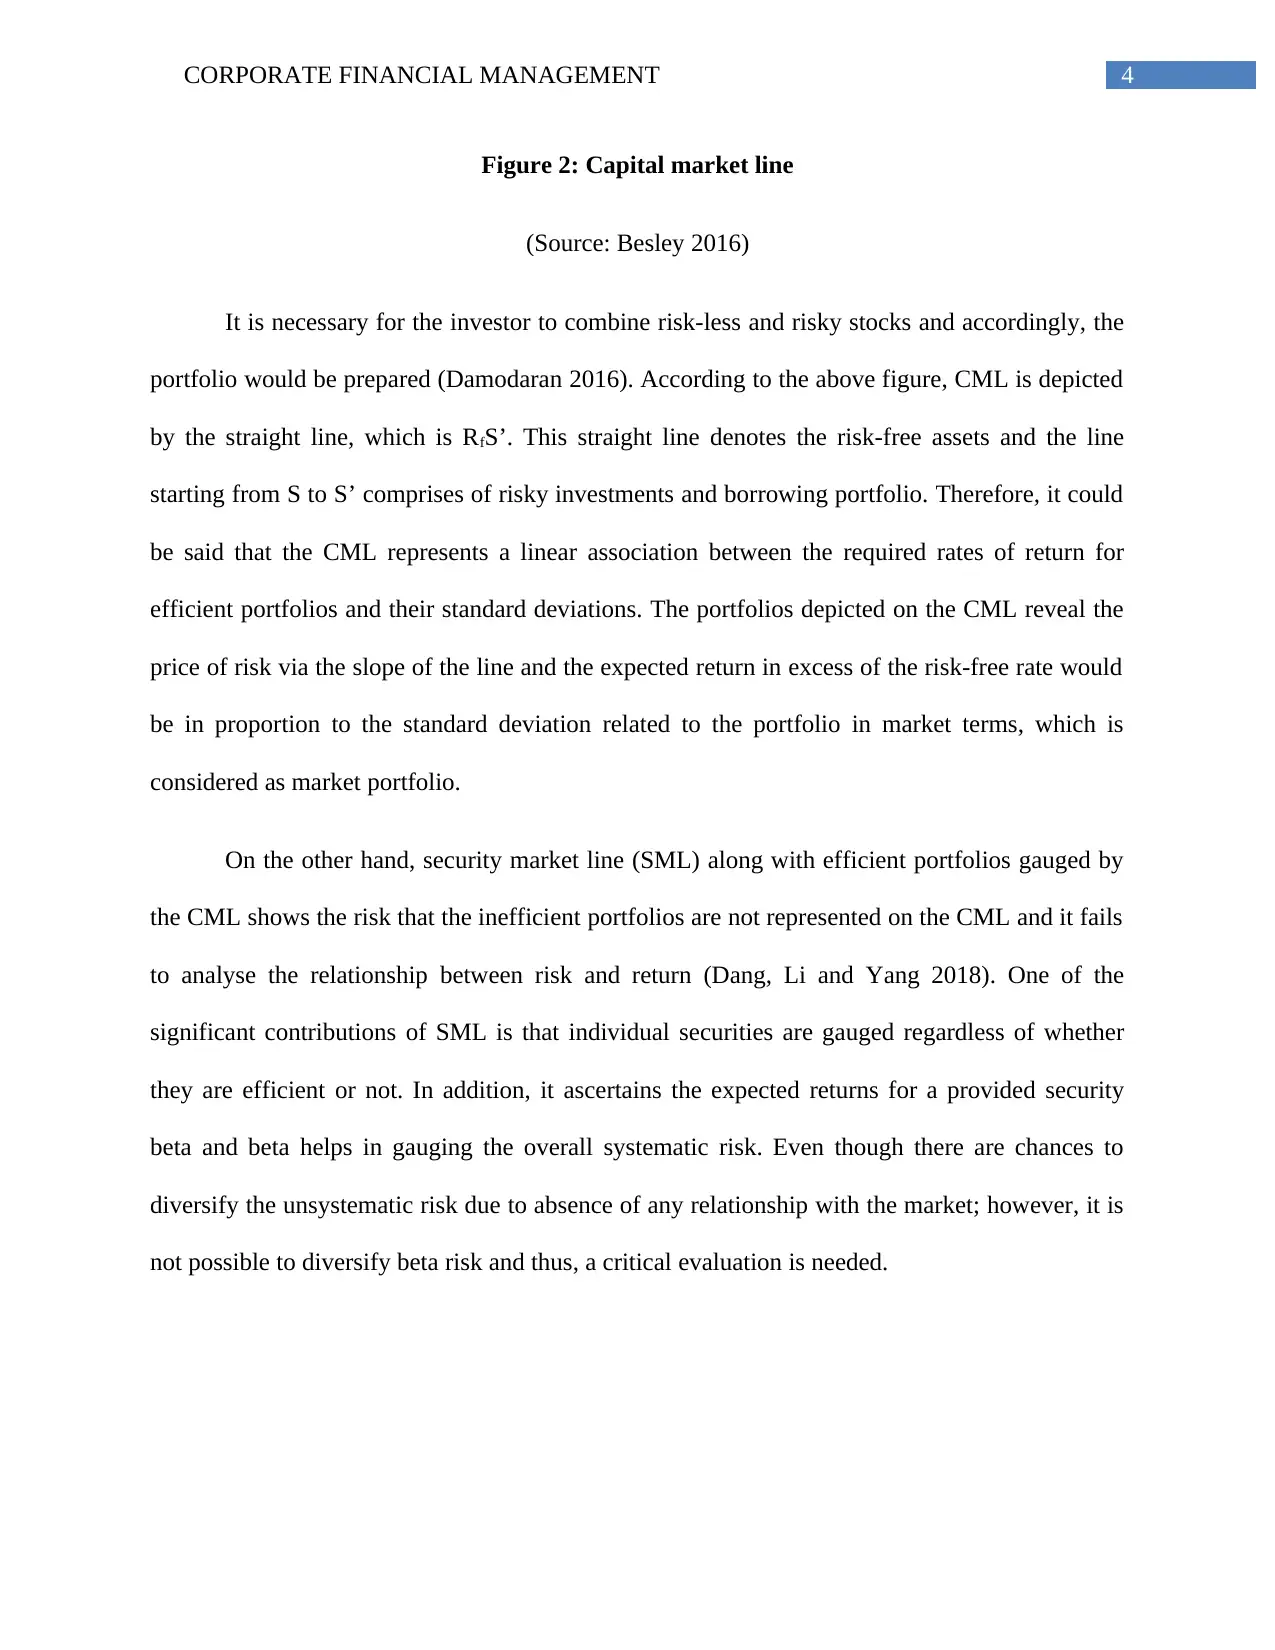
Figure 2: Capital market line
(Source: Besley 2016)
It is necessary for the investor to combine risk-less and risky stocks and accordingly, the
portfolio would be prepared (Damodaran 2016). According to the above figure, CML is depicted
by the straight line, which is RfS’. This straight line denotes the risk-free assets and the line
starting from S to S’ comprises of risky investments and borrowing portfolio. Therefore, it could
be said that the CML represents a linear association between the required rates of return for
efficient portfolios and their standard deviations. The portfolios depicted on the CML reveal the
price of risk via the slope of the line and the expected return in excess of the risk-free rate would
be in proportion to the standard deviation related to the portfolio in market terms, which is
considered as market portfolio.
On the other hand, security market line (SML) along with efficient portfolios gauged by
the CML shows the risk that the inefficient portfolios are not represented on the CML and it fails
to analyse the relationship between risk and return (Dang, Li and Yang 2018). One of the
significant contributions of SML is that individual securities are gauged regardless of whether
they are efficient or not. In addition, it ascertains the expected returns for a provided security
beta and beta helps in gauging the overall systematic risk. Even though there are chances to
diversify the unsystematic risk due to absence of any relationship with the market; however, it is
not possible to diversify beta risk and thus, a critical evaluation is needed.
5CORPORATE FINANCIAL MANAGEMENT
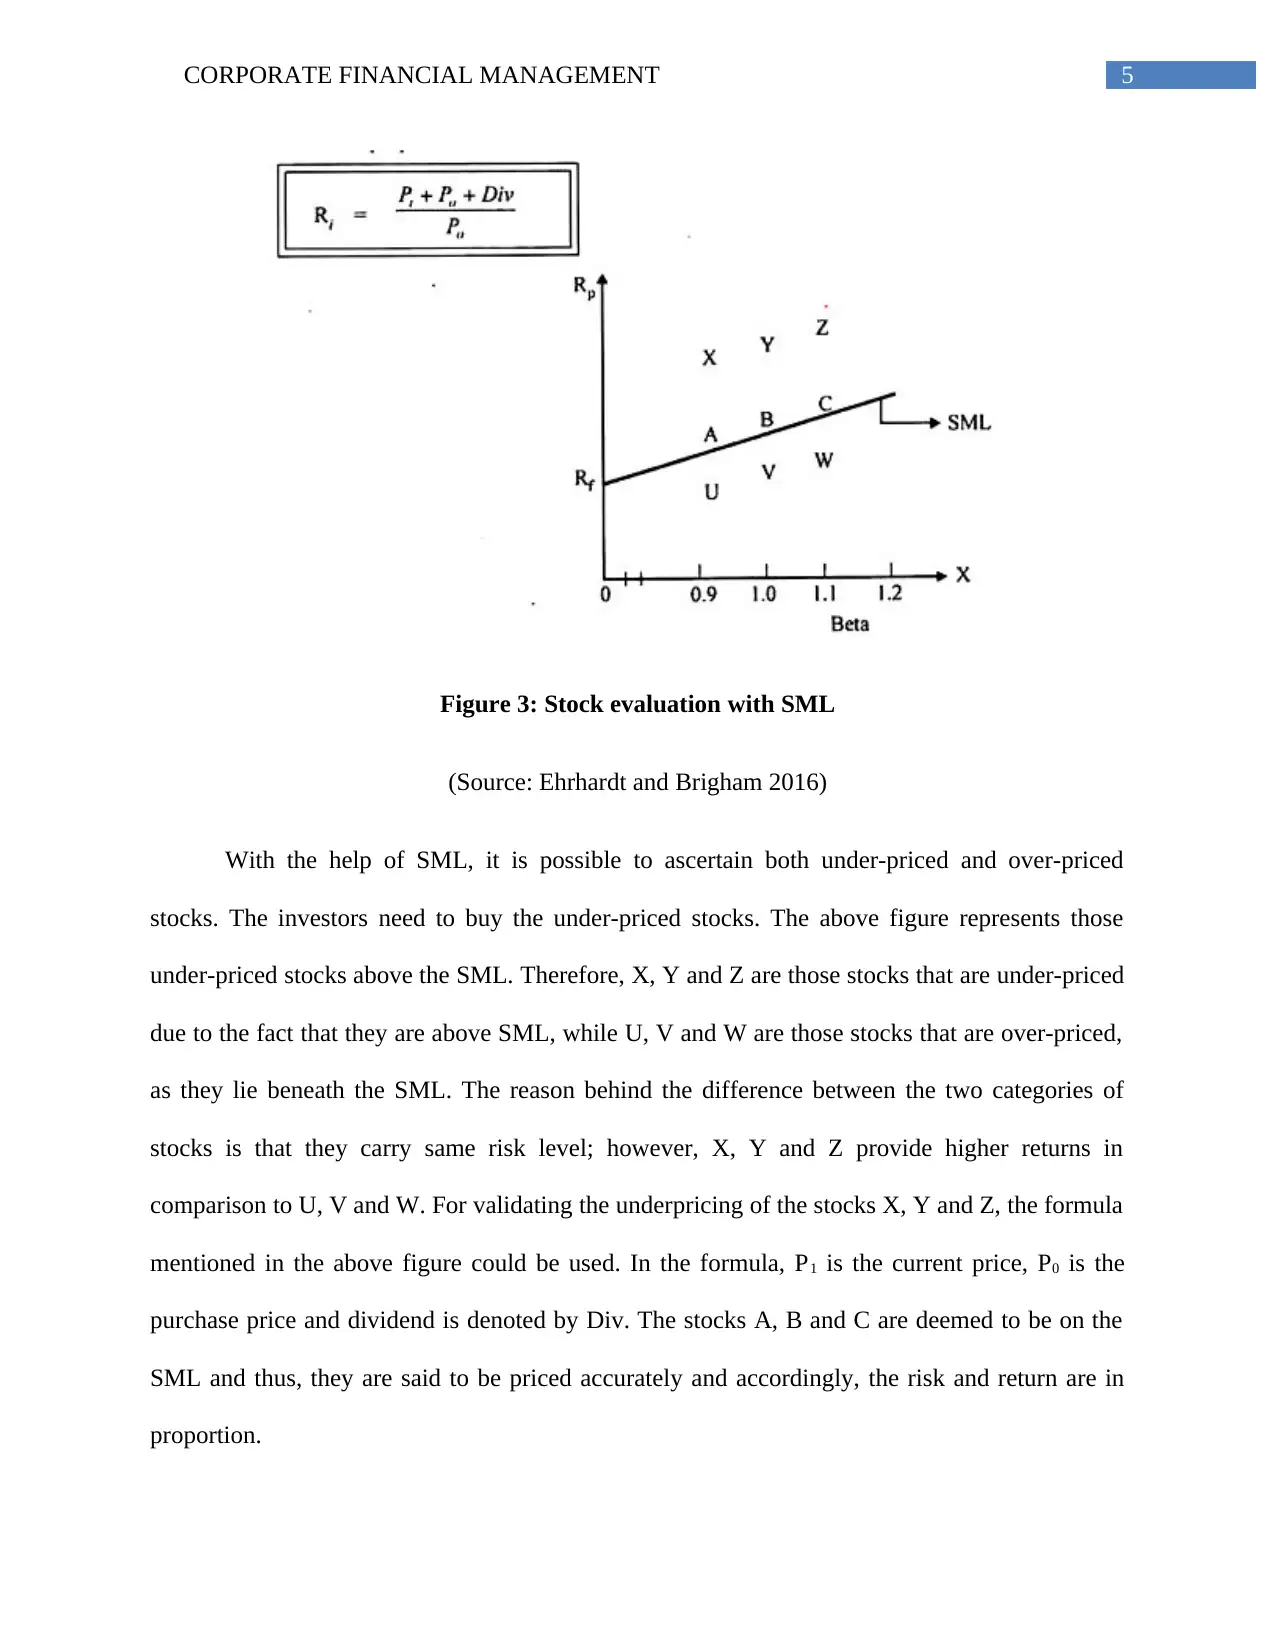
Figure 3: Stock evaluation with SML
(Source: Ehrhardt and Brigham 2016)
With the help of SML, it is possible to ascertain both under-priced and over-priced
stocks. The investors need to buy the under-priced stocks. The above figure represents those
under-priced stocks above the SML. Therefore, X, Y and Z are those stocks that are under-priced
due to the fact that they are above SML, while U, V and W are those stocks that are over-priced,
as they lie beneath the SML. The reason behind the difference between the two categories of
stocks is that they carry same risk level; however, X, Y and Z provide higher returns in
comparison to U, V and W. For validating the underpricing of the stocks X, Y and Z, the formula
mentioned in the above figure could be used. In the formula, P1 is the current price, P0 is the
purchase price and dividend is denoted by Div. The stocks A, B and C are deemed to be on the
SML and thus, they are said to be priced accurately and accordingly, the risk and return are in
proportion.
⊘ This is a preview!⊘
Do you want full access?
Subscribe today to unlock all pages.
Trusted by 1+ million students worldwide
6CORPORATE FINANCIAL MANAGEMENT
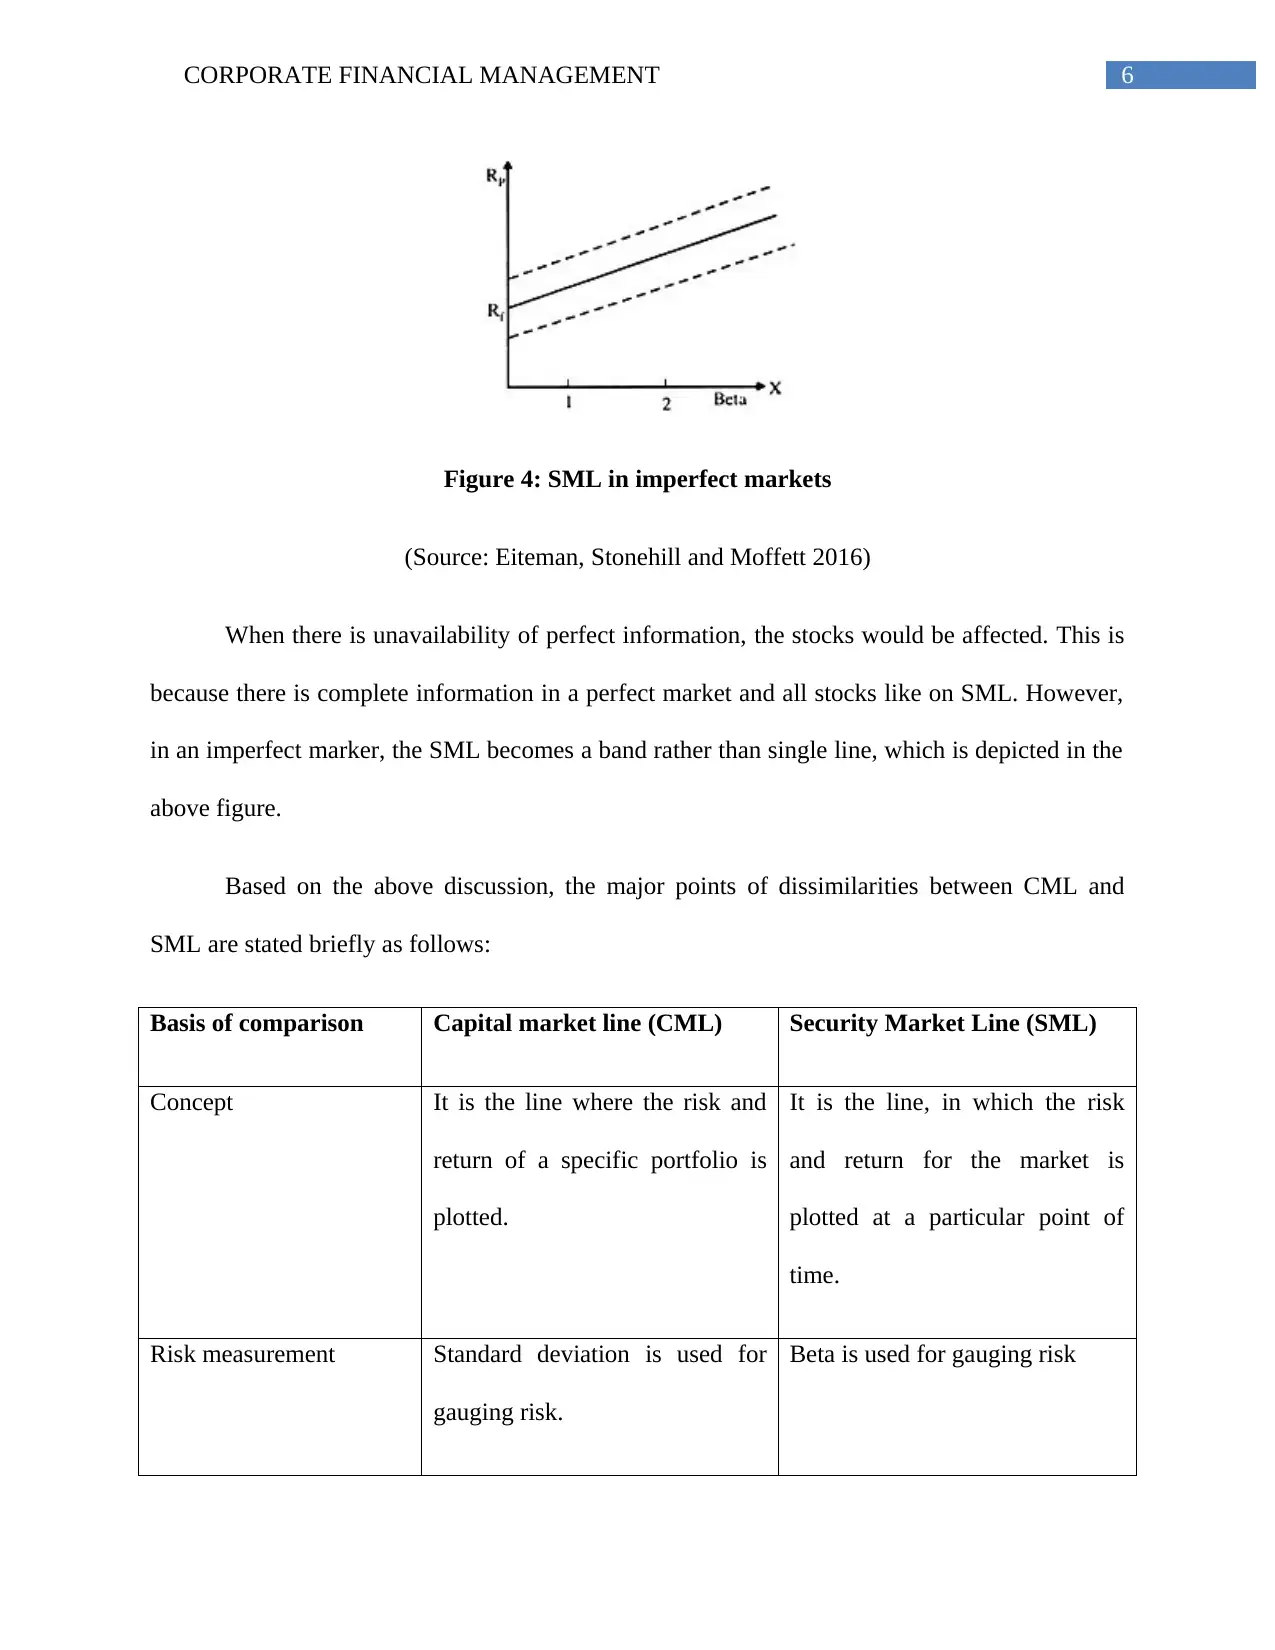
Figure 4: SML in imperfect markets
(Source: Eiteman, Stonehill and Moffett 2016)
When there is unavailability of perfect information, the stocks would be affected. This is
because there is complete information in a perfect market and all stocks like on SML. However,
in an imperfect marker, the SML becomes a band rather than single line, which is depicted in the
above figure.
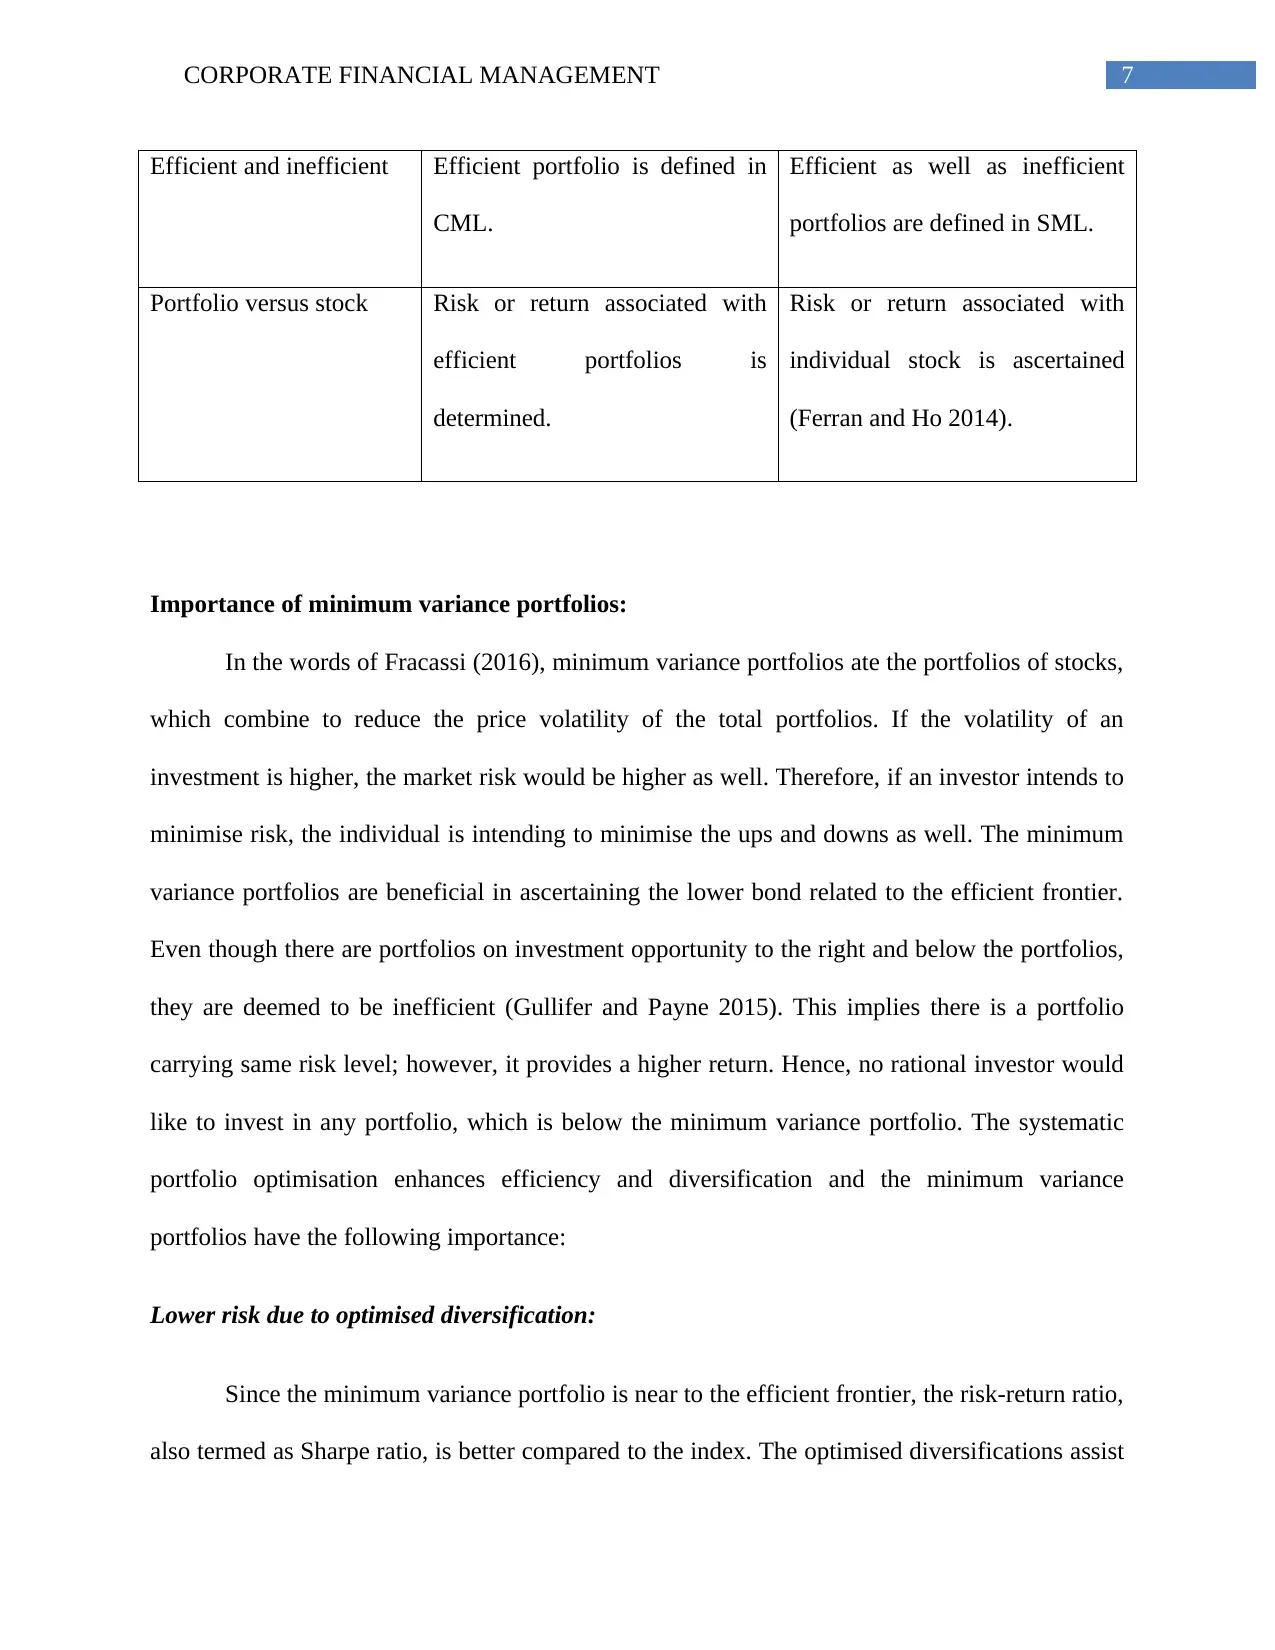
Based on the above discussion, the major points of dissimilarities between CML and
SML are stated briefly as follows:
Basis of comparison Capital market line (CML) Security Market Line (SML)
Concept It is the line where the risk and
return of a specific portfolio is
plotted.
It is the line, in which the risk
and return for the market is
plotted at a particular point of
time.
Risk measurement Standard deviation is used for
gauging risk.
Beta is used for gauging risk
Figure 4: SML in imperfect markets
(Source: Eiteman, Stonehill and Moffett 2016)
When there is unavailability of perfect information, the stocks would be affected. This is
because there is complete information in a perfect market and all stocks like on SML. However,
in an imperfect marker, the SML becomes a band rather than single line, which is depicted in the
above figure.
Based on the above discussion, the major points of dissimilarities between CML and
SML are stated briefly as follows:
Basis of comparison Capital market line (CML) Security Market Line (SML)
Concept It is the line where the risk and
return of a specific portfolio is
plotted.
It is the line, in which the risk
and return for the market is
plotted at a particular point of
time.
Risk measurement Standard deviation is used for
gauging risk.
Beta is used for gauging risk
Paraphrase This Document
Need a fresh take? Get an instant paraphrase of this document with our AI Paraphraser
7CORPORATE FINANCIAL MANAGEMENT
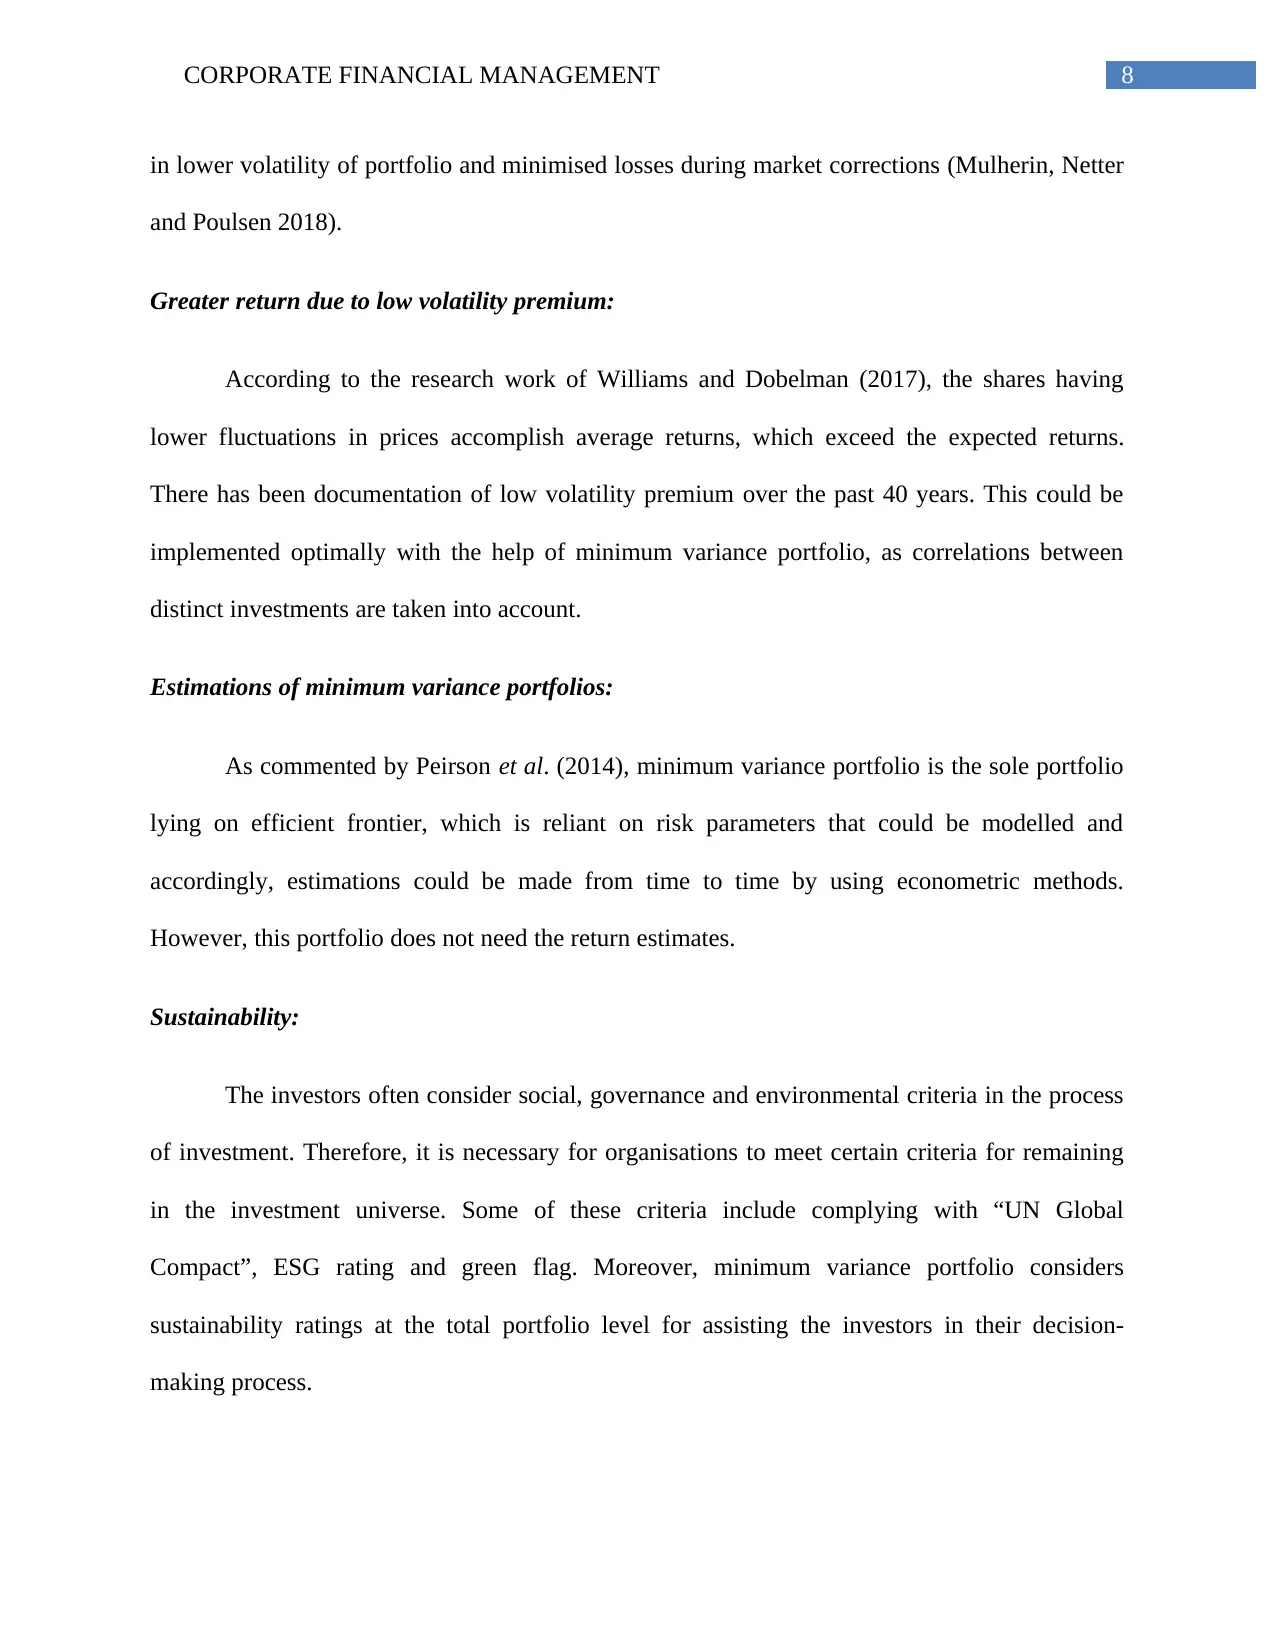
Efficient and inefficient Efficient portfolio is defined in
CML.
Efficient as well as inefficient
portfolios are defined in SML.
Portfolio versus stock Risk or return associated with
efficient portfolios is
determined.
Risk or return associated with
individual stock is ascertained
(Ferran and Ho 2014).
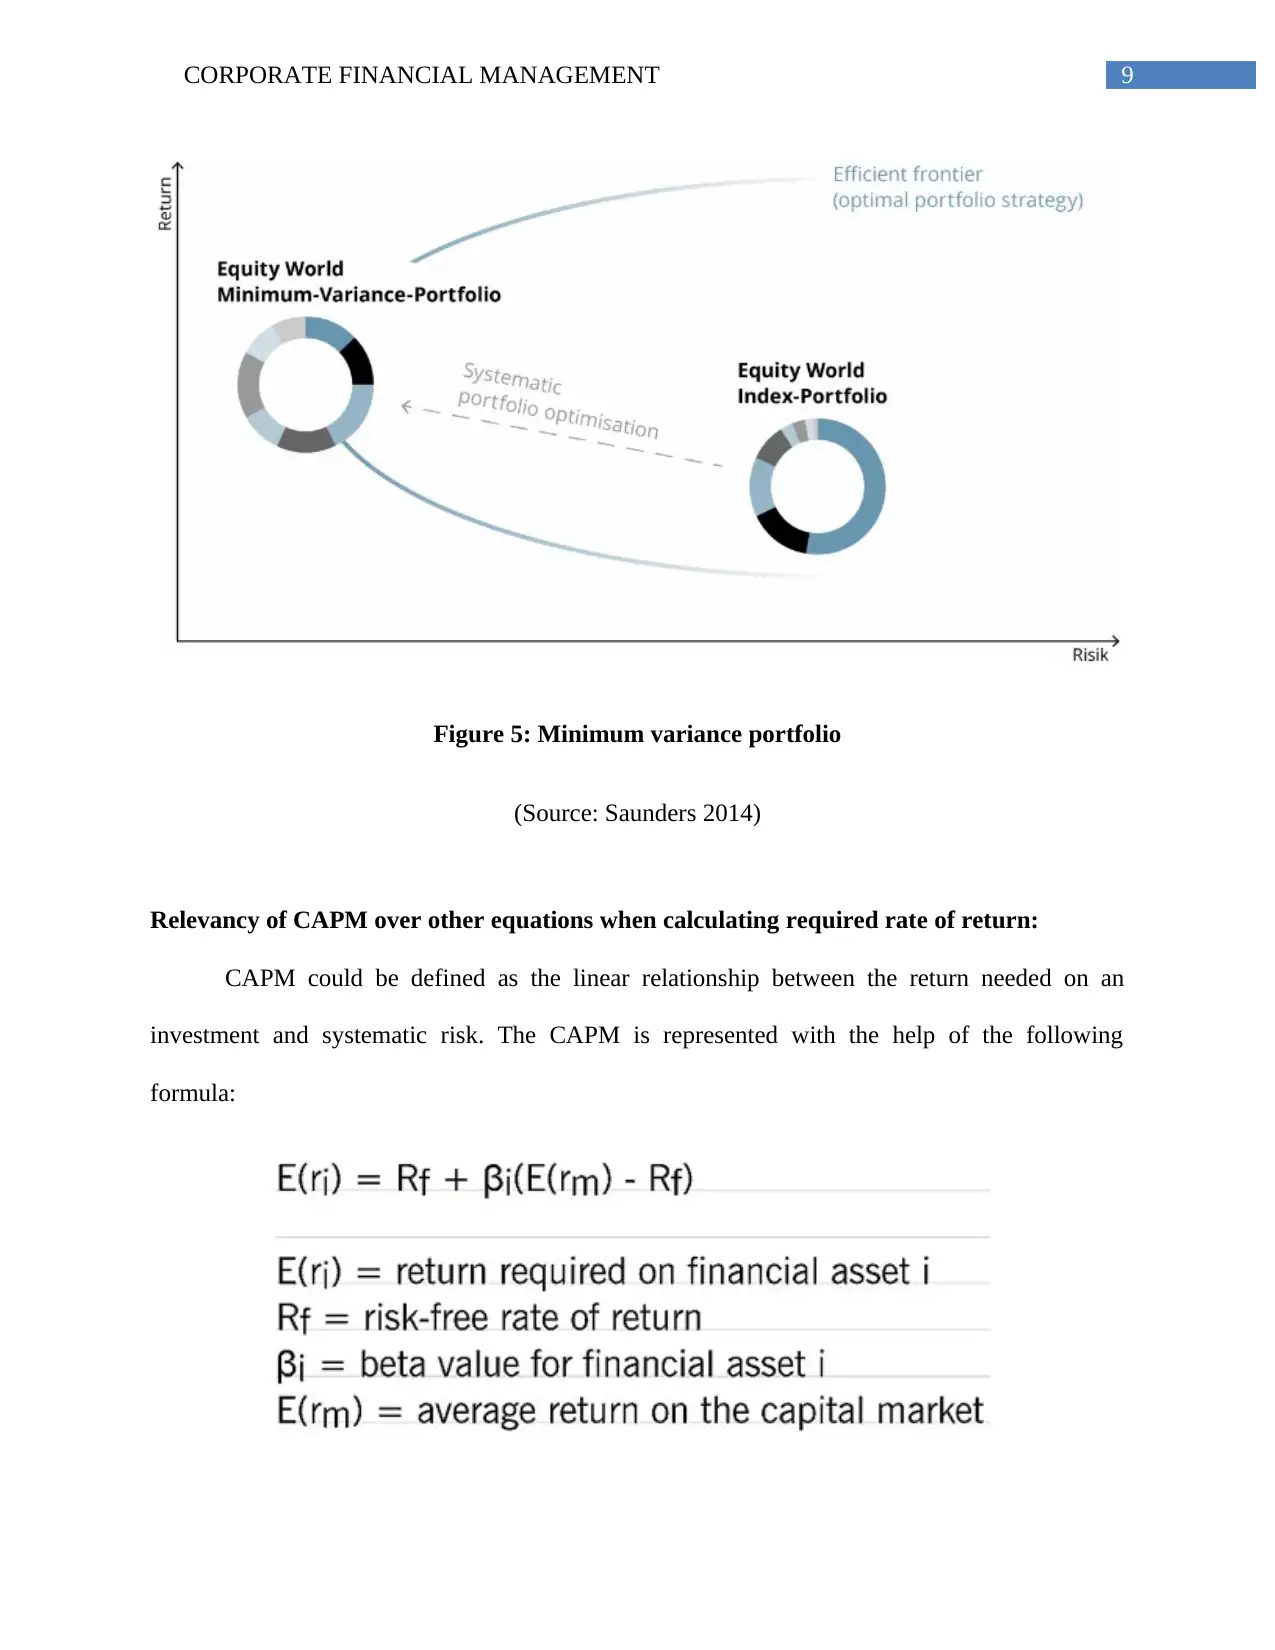
Importance of minimum variance portfolios:
In the words of Fracassi (2016), minimum variance portfolios ate the portfolios of stocks,
which combine to reduce the price volatility of the total portfolios. If the volatility of an
investment is higher, the market risk would be higher as well. Therefore, if an investor intends to
minimise risk, the individual is intending to minimise the ups and downs as well. The minimum
variance portfolios are beneficial in ascertaining the lower bond related to the efficient frontier.
Even though there are portfolios on investment opportunity to the right and below the portfolios,
they are deemed to be inefficient (Gullifer and Payne 2015). This implies there is a portfolio
carrying same risk level; however, it provides a higher return. Hence, no rational investor would
like to invest in any portfolio, which is below the minimum variance portfolio. The systematic
portfolio optimisation enhances efficiency and diversification and the minimum variance
portfolios have the following importance:
Lower risk due to optimised diversification:
Since the minimum variance portfolio is near to the efficient frontier, the risk-return ratio,
also termed as Sharpe ratio, is better compared to the index. The optimised diversifications assist
Efficient and inefficient Efficient portfolio is defined in
CML.
Efficient as well as inefficient
portfolios are defined in SML.
Portfolio versus stock Risk or return associated with
efficient portfolios is
determined.
Risk or return associated with
individual stock is ascertained
(Ferran and Ho 2014).
Importance of minimum variance portfolios:
In the words of Fracassi (2016), minimum variance portfolios ate the portfolios of stocks,
which combine to reduce the price volatility of the total portfolios. If the volatility of an
investment is higher, the market risk would be higher as well. Therefore, if an investor intends to
minimise risk, the individual is intending to minimise the ups and downs as well. The minimum
variance portfolios are beneficial in ascertaining the lower bond related to the efficient frontier.
Even though there are portfolios on investment opportunity to the right and below the portfolios,
they are deemed to be inefficient (Gullifer and Payne 2015). This implies there is a portfolio
carrying same risk level; however, it provides a higher return. Hence, no rational investor would
like to invest in any portfolio, which is below the minimum variance portfolio. The systematic
portfolio optimisation enhances efficiency and diversification and the minimum variance
portfolios have the following importance:
Lower risk due to optimised diversification:
Since the minimum variance portfolio is near to the efficient frontier, the risk-return ratio,
also termed as Sharpe ratio, is better compared to the index. The optimised diversifications assist
8CORPORATE FINANCIAL MANAGEMENT
in lower volatility of portfolio and minimised losses during market corrections (Mulherin, Netter
and Poulsen 2018).
Greater return due to low volatility premium:
According to the research work of Williams and Dobelman (2017), the shares having
lower fluctuations in prices accomplish average returns, which exceed the expected returns.
There has been documentation of low volatility premium over the past 40 years. This could be
implemented optimally with the help of minimum variance portfolio, as correlations between
distinct investments are taken into account.
Estimations of minimum variance portfolios:
As commented by Peirson et al. (2014), minimum variance portfolio is the sole portfolio
lying on efficient frontier, which is reliant on risk parameters that could be modelled and
accordingly, estimations could be made from time to time by using econometric methods.
However, this portfolio does not need the return estimates.
Sustainability:
The investors often consider social, governance and environmental criteria in the process
of investment. Therefore, it is necessary for organisations to meet certain criteria for remaining
in the investment universe. Some of these criteria include complying with “UN Global
Compact”, ESG rating and green flag. Moreover, minimum variance portfolio considers
sustainability ratings at the total portfolio level for assisting the investors in their decision-
making process.
⊘ This is a preview!⊘
Do you want full access?
Subscribe today to unlock all pages.
Trusted by 1+ million students worldwide
9CORPORATE FINANCIAL MANAGEMENT
Figure 5: Minimum variance portfolio
(Source: Saunders 2014)
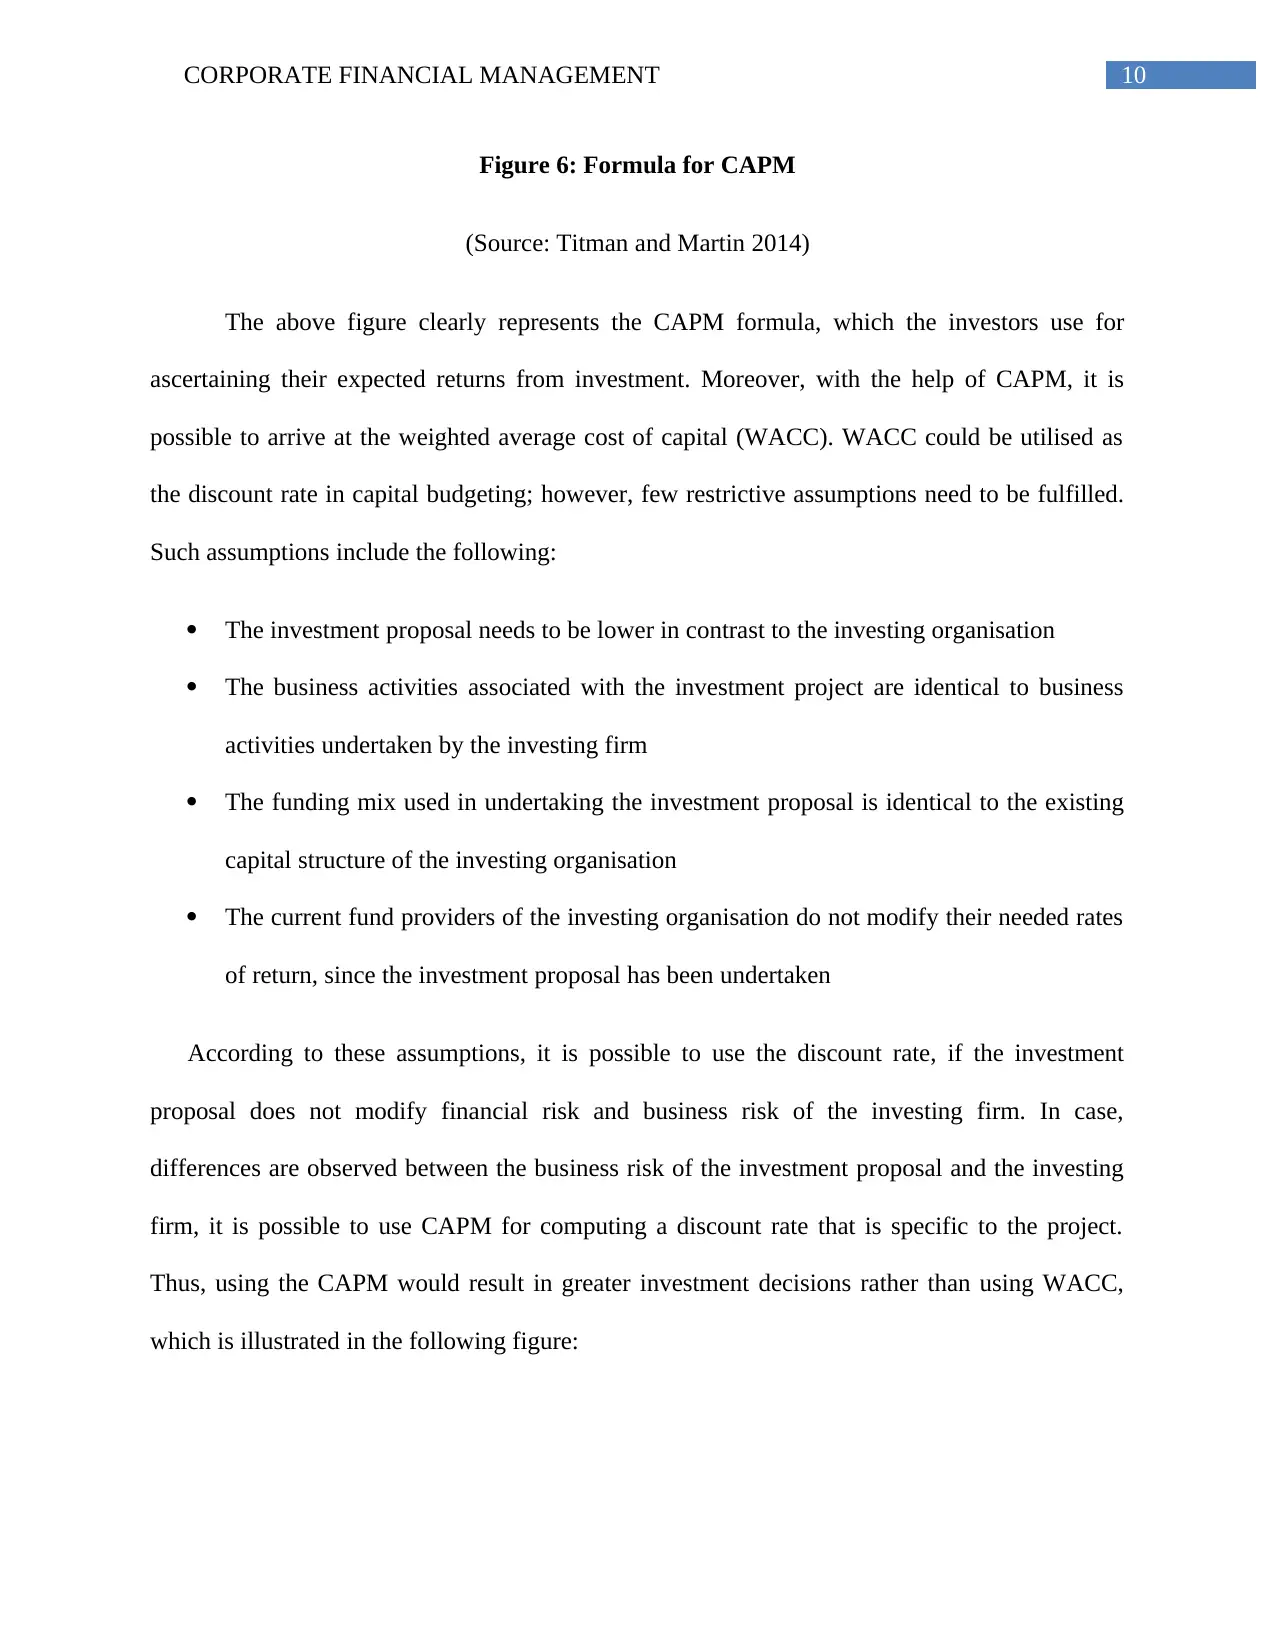
Relevancy of CAPM over other equations when calculating required rate of return:
CAPM could be defined as the linear relationship between the return needed on an
investment and systematic risk. The CAPM is represented with the help of the following
formula:
Figure 5: Minimum variance portfolio
(Source: Saunders 2014)
Relevancy of CAPM over other equations when calculating required rate of return:
CAPM could be defined as the linear relationship between the return needed on an
investment and systematic risk. The CAPM is represented with the help of the following
formula:
Paraphrase This Document
Need a fresh take? Get an instant paraphrase of this document with our AI Paraphraser
10CORPORATE FINANCIAL MANAGEMENT
Figure 6: Formula for CAPM
(Source: Titman and Martin 2014)
The above figure clearly represents the CAPM formula, which the investors use for
ascertaining their expected returns from investment. Moreover, with the help of CAPM, it is
possible to arrive at the weighted average cost of capital (WACC). WACC could be utilised as
the discount rate in capital budgeting; however, few restrictive assumptions need to be fulfilled.
Such assumptions include the following:
The investment proposal needs to be lower in contrast to the investing organisation
The business activities associated with the investment project are identical to business
activities undertaken by the investing firm
The funding mix used in undertaking the investment proposal is identical to the existing
capital structure of the investing organisation
The current fund providers of the investing organisation do not modify their needed rates
of return, since the investment proposal has been undertaken
According to these assumptions, it is possible to use the discount rate, if the investment
proposal does not modify financial risk and business risk of the investing firm. In case,
differences are observed between the business risk of the investment proposal and the investing
firm, it is possible to use CAPM for computing a discount rate that is specific to the project.
Thus, using the CAPM would result in greater investment decisions rather than using WACC,
which is illustrated in the following figure:
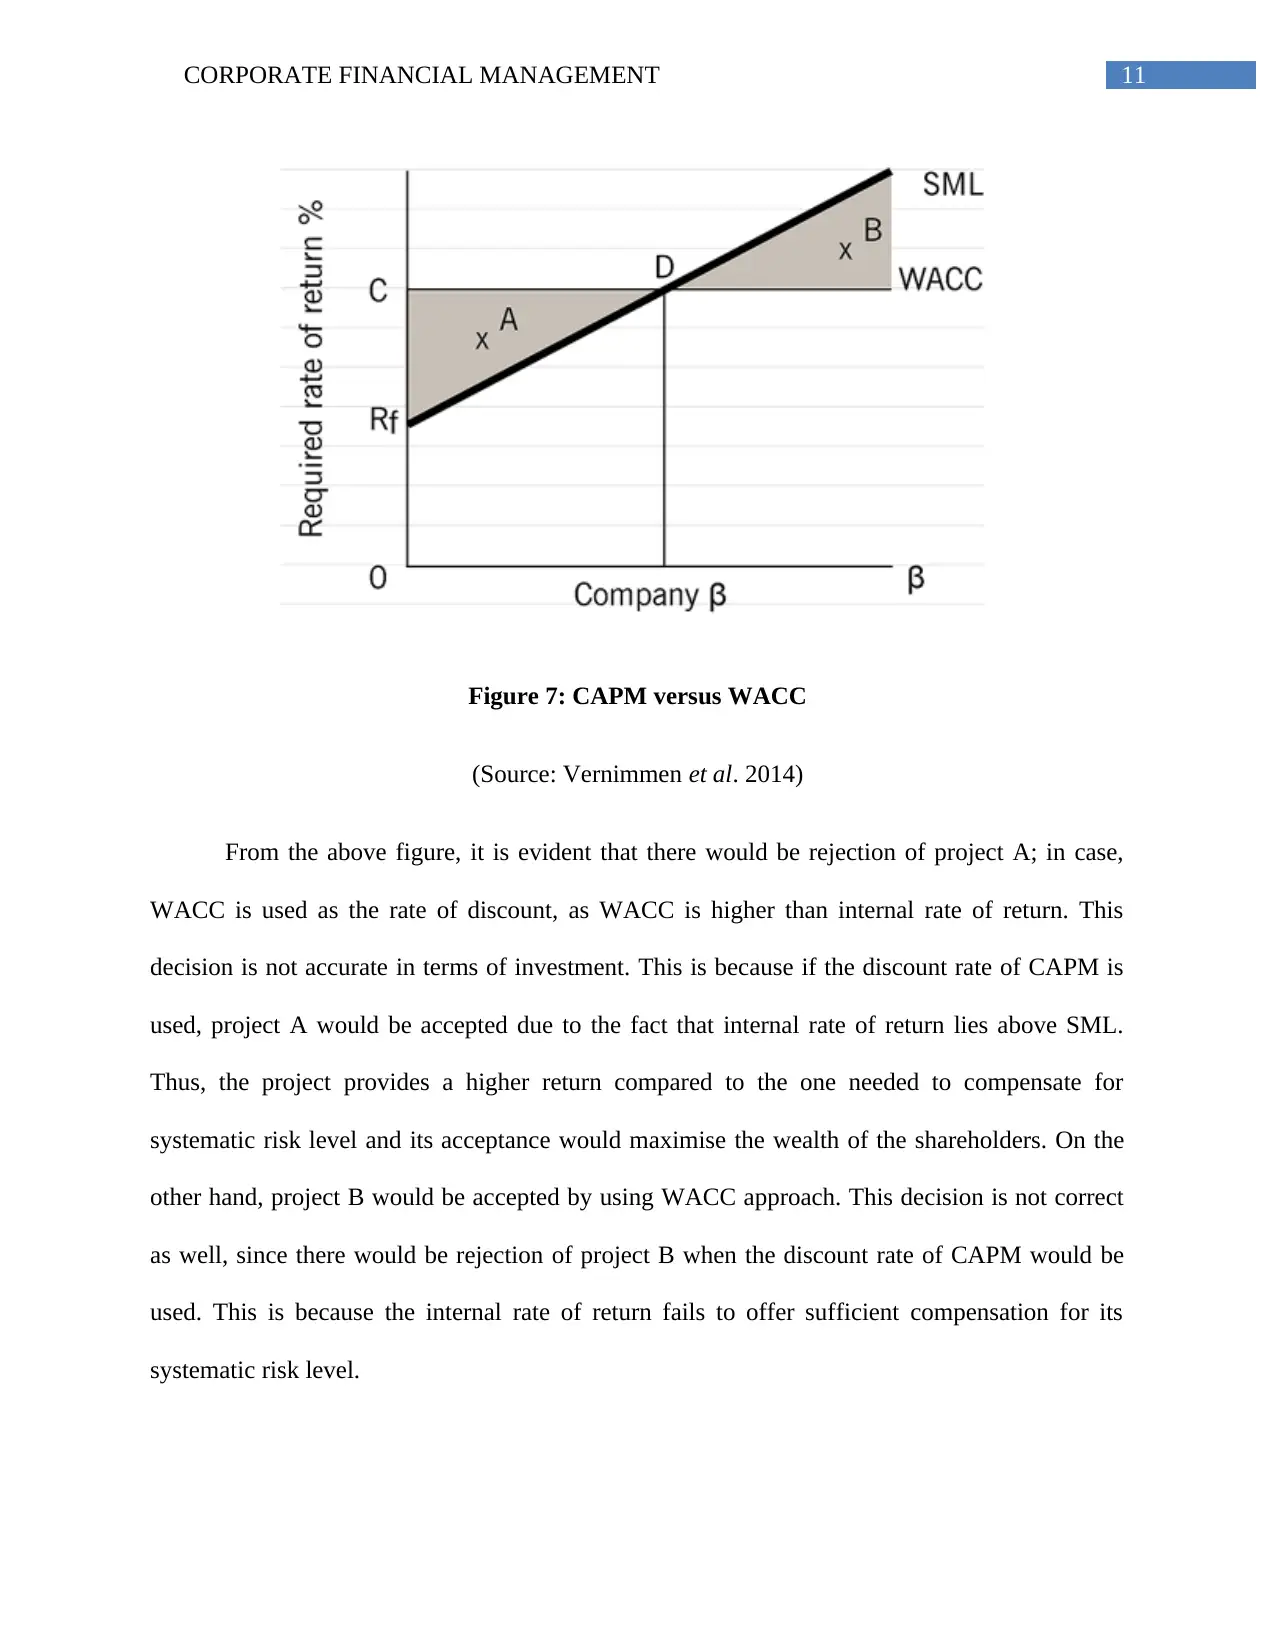
11CORPORATE FINANCIAL MANAGEMENT
Figure 7: CAPM versus WACC
(Source: Vernimmen et al. 2014)
From the above figure, it is evident that there would be rejection of project A; in case,
WACC is used as the rate of discount, as WACC is higher than internal rate of return. This
decision is not accurate in terms of investment. This is because if the discount rate of CAPM is
used, project A would be accepted due to the fact that internal rate of return lies above SML.
Thus, the project provides a higher return compared to the one needed to compensate for
systematic risk level and its acceptance would maximise the wealth of the shareholders. On the
other hand, project B would be accepted by using WACC approach. This decision is not correct
as well, since there would be rejection of project B when the discount rate of CAPM would be
used. This is because the internal rate of return fails to offer sufficient compensation for its
systematic risk level.
⊘ This is a preview!⊘
Do you want full access?
Subscribe today to unlock all pages.
Trusted by 1+ million students worldwide
1 out of 15
Related Documents


Your All-in-One AI-Powered Toolkit for Academic Success.
+13062052269
info@desklib.com
Available 24*7 on WhatsApp / Email
![[object Object]](/_next/static/media/star-bottom.7253800d.svg)
Unlock your academic potential
Copyright © 2020–2026 A2Z Services. All Rights Reserved. Developed and managed by ZUCOL.