Corporate Finance Project Report: SML, CML, MVP, and CAPM Analysis
VerifiedAdded on 2023/06/05
|11
|2772
|250
Report
AI Summary
This corporate finance report delves into the analysis of essential tools used in financial management, including the Security Market Line (SML), Capital Market Line (CML), Minimum Variance Portfolio (MVP), and the Capital Asset Pricing Model (CAPM). The report explains how the SML graphically represents the CAPM equation, illustrating the relationship between risk and return, while the CML focuses on efficient portfolios and the trade-off between risk and return. The MVP is explored as a method to minimize portfolio risk through asset allocation, and the CAPM equation is dissected to understand how risk-free rate, market risk premium, and beta contribute to expected return calculations. The analysis provides insights into how these tools aid in investment decisions and performance evaluation, crucial for financial analysts and investors. Desklib offers a wealth of resources, including past papers and solved assignments, to further assist students in mastering these concepts.
Running Head: Corporate Finance
1
Project Report: Corporate Finance
1
Project Report: Corporate Finance
Paraphrase This Document
Need a fresh take? Get an instant paraphrase of this document with our AI Paraphraser
Corporate Finance
2
Contents
Introduction.......................................................................................................................3
Security market line and capital market line....................................................................3
Minimum variance portfolio.............................................................................................6
CAPM equation................................................................................................................9
Conclusion......................................................................................................................10
References.......................................................................................................................11
Corporate Finance
3
Introduction:
Corporate finance is the part of the finance which deals with the capital structure and
various sources of funds through which the capital is raised by the business. The actions in
the corporate finance are taken by the managers in order to manage the value of the company
among the shareholders. In the report, the security market line, capital market line, minimum
variance portfolio and capital asset pricing model. It measures that how these tools help the
business to reach over conclusion about the performance of the business (Zabarankin,
Pavlikov and Uryasev, 2014). The main objat9ives of the report is to identify the different
tools of corporate finance and use them in proper way to improve the performance of the
investment and other factors of the business.
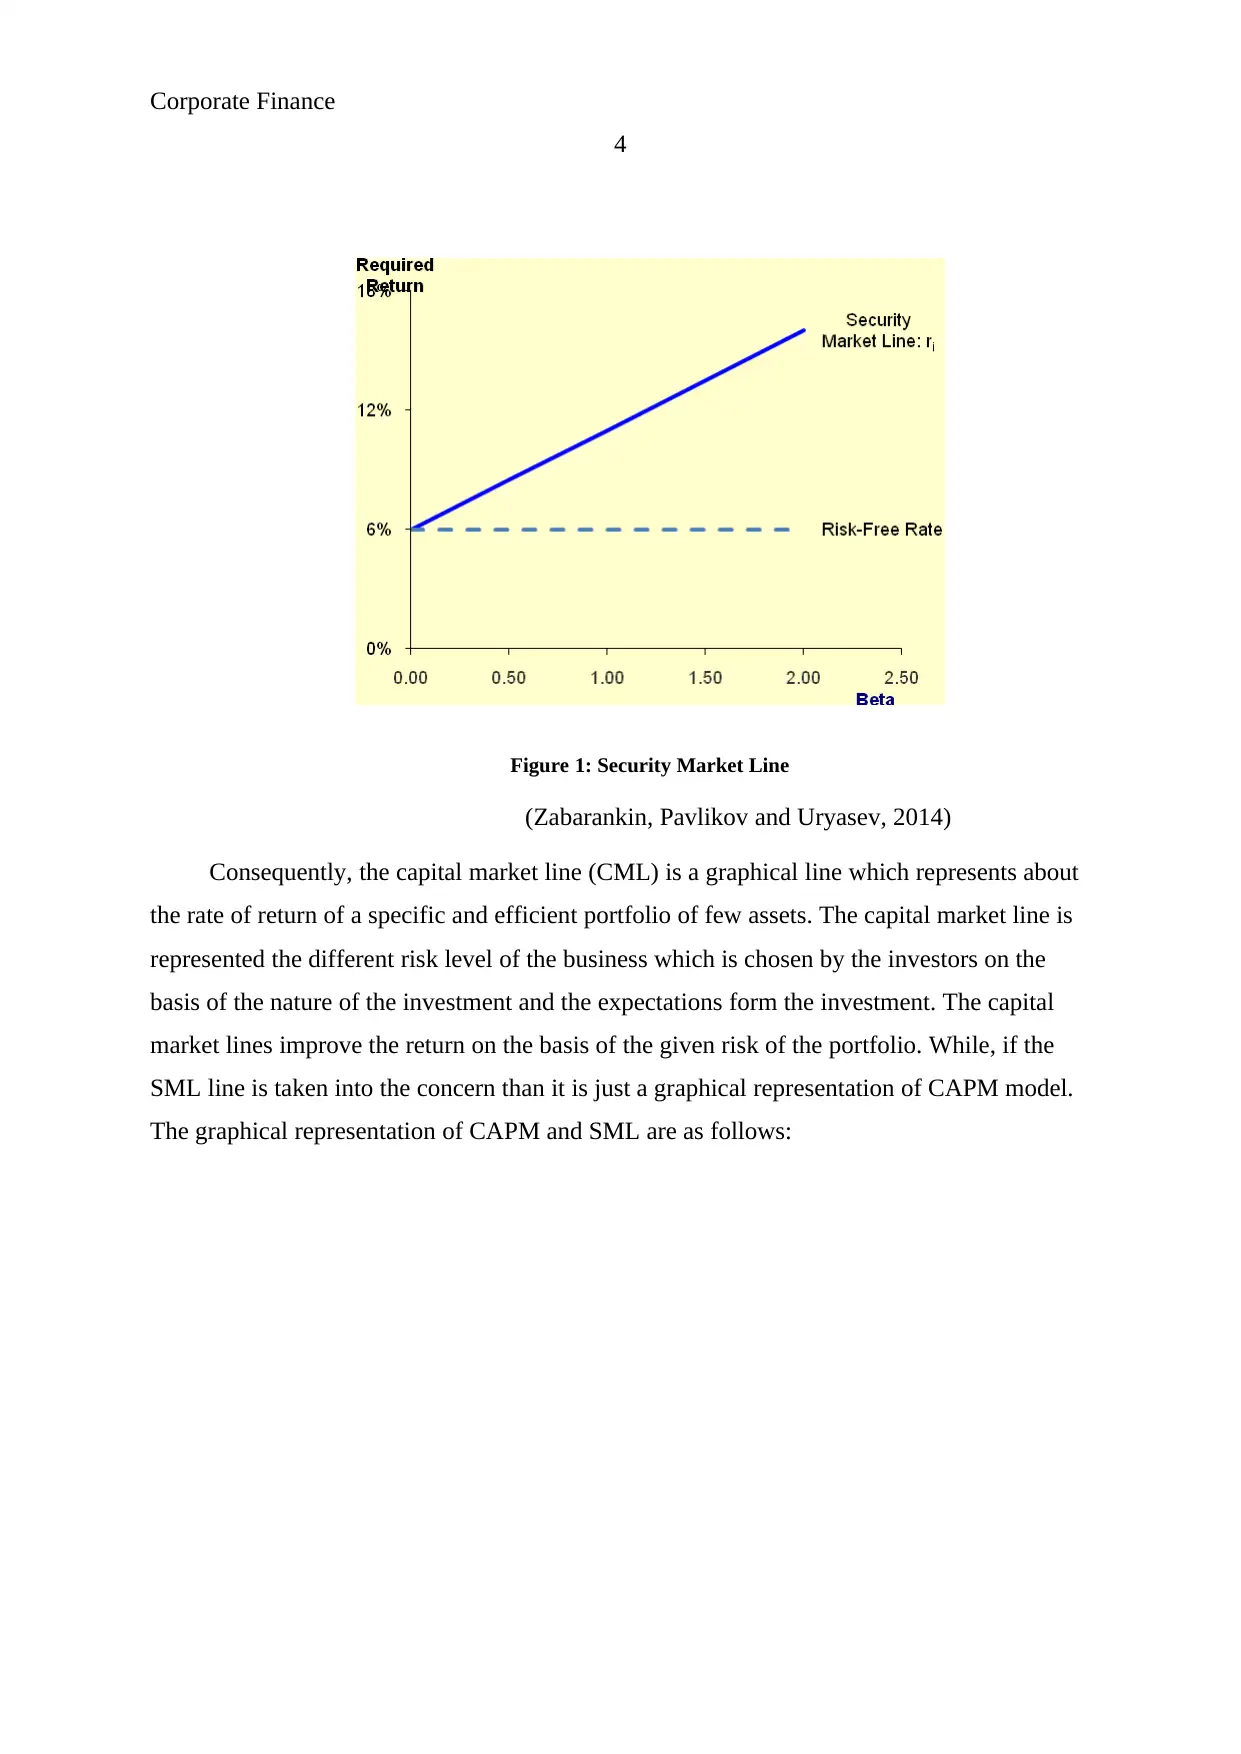
Security market line and capital market line:
Security market line i.e. SML represents the capital assets pricing model (CAPM)
equation in a graphical manner. It shown the risk and return on both the axis to reach over a
conclusion about the investment in a business. The systemic risk of the business is calculated
in the SML to identify the return level from that particular security. It describes that at what
evil of risk, how much return of the business would be. Generally, the more the associated
risk of an investment would be, the more the return from that stock would be. It also
represent in its graph about the opportunity cost of the investment. Below is the graphical
representation of security market line (Lumby and Jones, 2007).
Beta Security
Market
Line: ri
Risk-Free
Rate
0.00 6.0% 6%
0.50 8.5% 6%
1.00 11.0% 6%
1.50 13.5% 6%
2.00 16.0% 6%
3
Introduction:
Corporate finance is the part of the finance which deals with the capital structure and
various sources of funds through which the capital is raised by the business. The actions in
the corporate finance are taken by the managers in order to manage the value of the company
among the shareholders. In the report, the security market line, capital market line, minimum
variance portfolio and capital asset pricing model. It measures that how these tools help the
business to reach over conclusion about the performance of the business (Zabarankin,
Pavlikov and Uryasev, 2014). The main objat9ives of the report is to identify the different
tools of corporate finance and use them in proper way to improve the performance of the
investment and other factors of the business.
Security market line and capital market line:
Security market line i.e. SML represents the capital assets pricing model (CAPM)
equation in a graphical manner. It shown the risk and return on both the axis to reach over a
conclusion about the investment in a business. The systemic risk of the business is calculated
in the SML to identify the return level from that particular security. It describes that at what
evil of risk, how much return of the business would be. Generally, the more the associated
risk of an investment would be, the more the return from that stock would be. It also
represent in its graph about the opportunity cost of the investment. Below is the graphical
representation of security market line (Lumby and Jones, 2007).
Beta Security
Market
Line: ri
Risk-Free
Rate
0.00 6.0% 6%
0.50 8.5% 6%
1.00 11.0% 6%
1.50 13.5% 6%
2.00 16.0% 6%
⊘ This is a preview!⊘
Do you want full access?
Subscribe today to unlock all pages.
Trusted by 1+ million students worldwide
Corporate Finance
4
Figure 1: Security Market Line
(Zabarankin, Pavlikov and Uryasev, 2014)
Consequently, the capital market line (CML) is a graphical line which represents about
the rate of return of a specific and efficient portfolio of few assets. The capital market line is
represented the different risk level of the business which is chosen by the investors on the
basis of the nature of the investment and the expectations form the investment. The capital
market lines improve the return on the basis of the given risk of the portfolio. While, if the
SML line is taken into the concern than it is just a graphical representation of CAPM model.
The graphical representation of CAPM and SML are as follows:
Paraphrase This Document
Need a fresh take? Get an instant paraphrase of this document with our AI Paraphraser
Corporate Finance
5
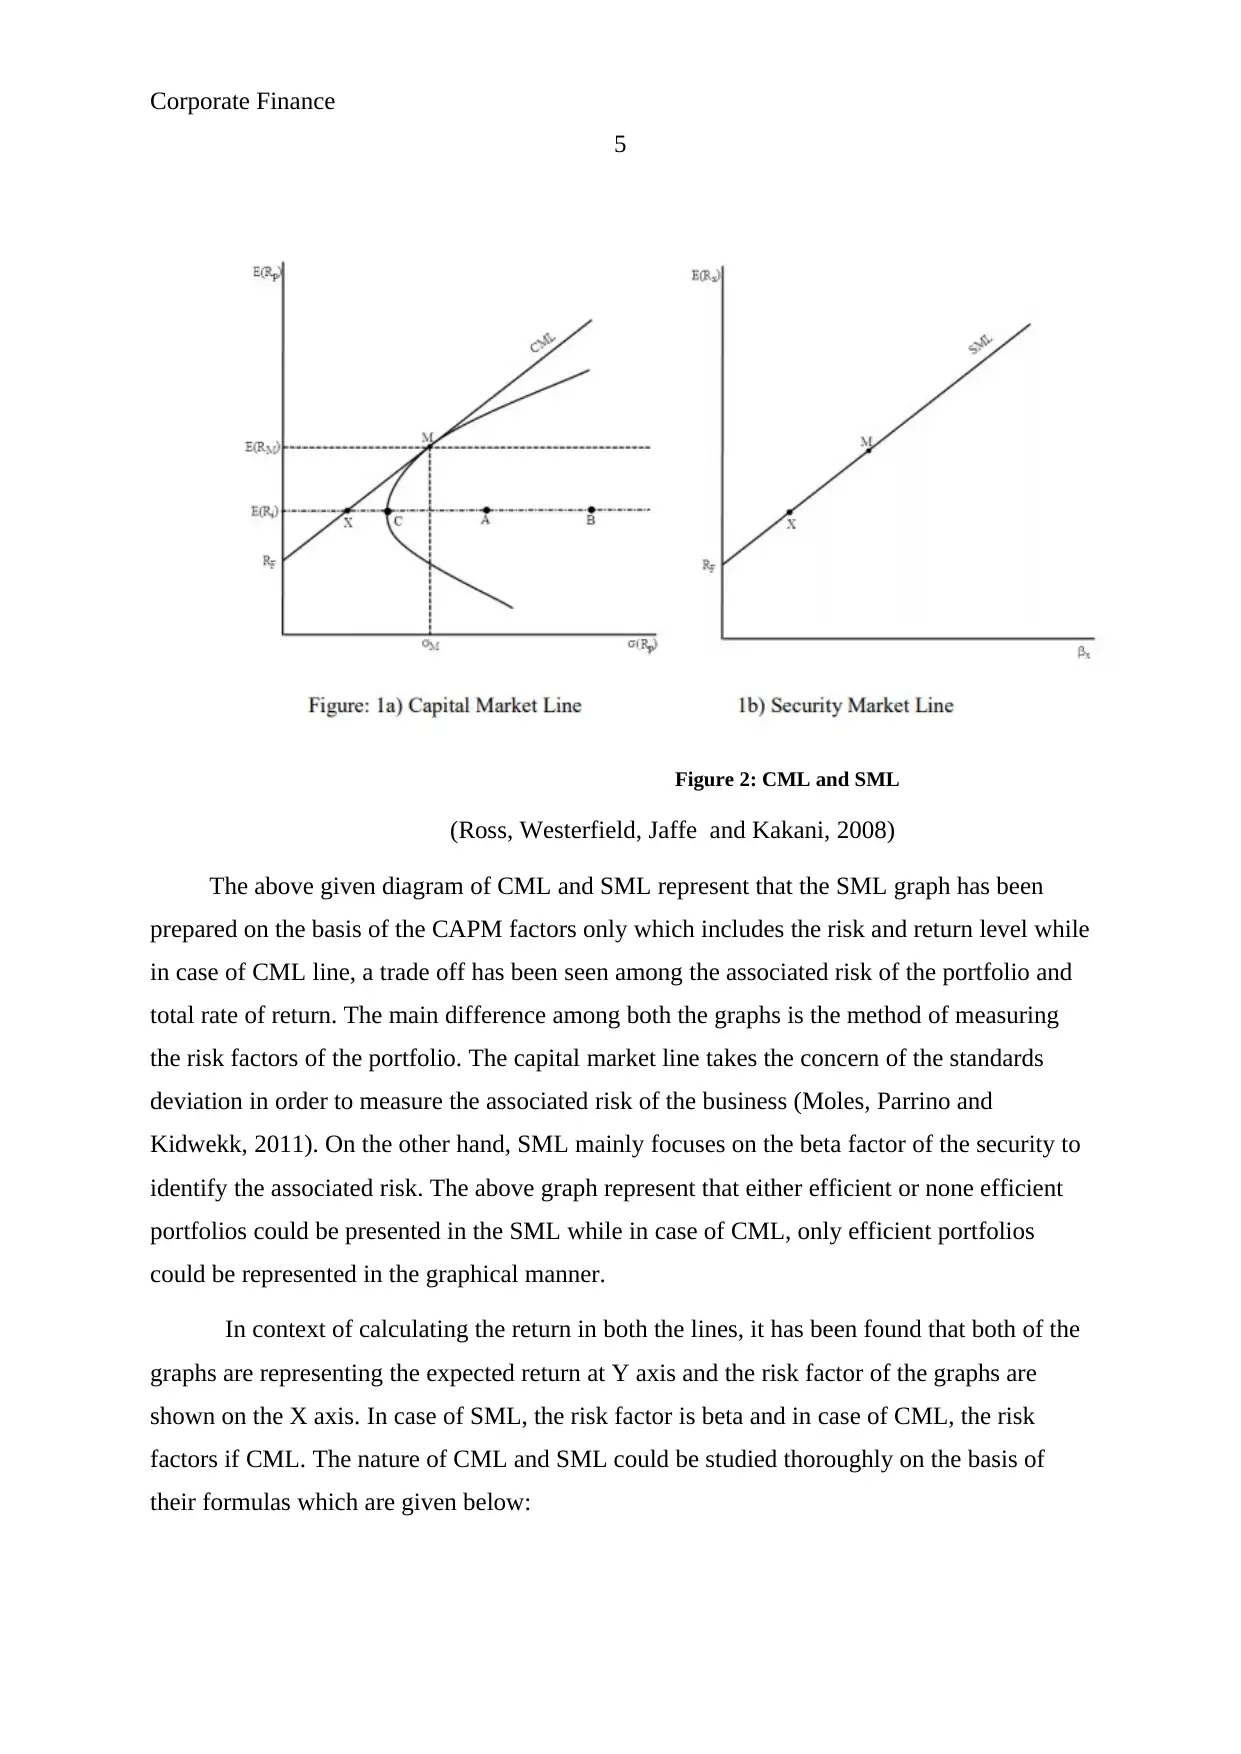
Figure 2: CML and SML
(Ross, Westerfield, Jaffe and Kakani, 2008)
The above given diagram of CML and SML represent that the SML graph has been
prepared on the basis of the CAPM factors only which includes the risk and return level while
in case of CML line, a trade off has been seen among the associated risk of the portfolio and
total rate of return. The main difference among both the graphs is the method of measuring
the risk factors of the portfolio. The capital market line takes the concern of the standards
deviation in order to measure the associated risk of the business (Moles, Parrino and
Kidwekk, 2011). On the other hand, SML mainly focuses on the beta factor of the security to
identify the associated risk. The above graph represent that either efficient or none efficient
portfolios could be presented in the SML while in case of CML, only efficient portfolios
could be represented in the graphical manner.
In context of calculating the return in both the lines, it has been found that both of the
graphs are representing the expected return at Y axis and the risk factor of the graphs are
shown on the X axis. In case of SML, the risk factor is beta and in case of CML, the risk
factors if CML. The nature of CML and SML could be studied thoroughly on the basis of
their formulas which are given below:
5
Figure 2: CML and SML
(Ross, Westerfield, Jaffe and Kakani, 2008)
The above given diagram of CML and SML represent that the SML graph has been
prepared on the basis of the CAPM factors only which includes the risk and return level while
in case of CML line, a trade off has been seen among the associated risk of the portfolio and
total rate of return. The main difference among both the graphs is the method of measuring
the risk factors of the portfolio. The capital market line takes the concern of the standards
deviation in order to measure the associated risk of the business (Moles, Parrino and
Kidwekk, 2011). On the other hand, SML mainly focuses on the beta factor of the security to
identify the associated risk. The above graph represent that either efficient or none efficient
portfolios could be presented in the SML while in case of CML, only efficient portfolios
could be represented in the graphical manner.
In context of calculating the return in both the lines, it has been found that both of the
graphs are representing the expected return at Y axis and the risk factor of the graphs are
shown on the X axis. In case of SML, the risk factor is beta and in case of CML, the risk
factors if CML. The nature of CML and SML could be studied thoroughly on the basis of
their formulas which are given below:
Corporate Finance
6
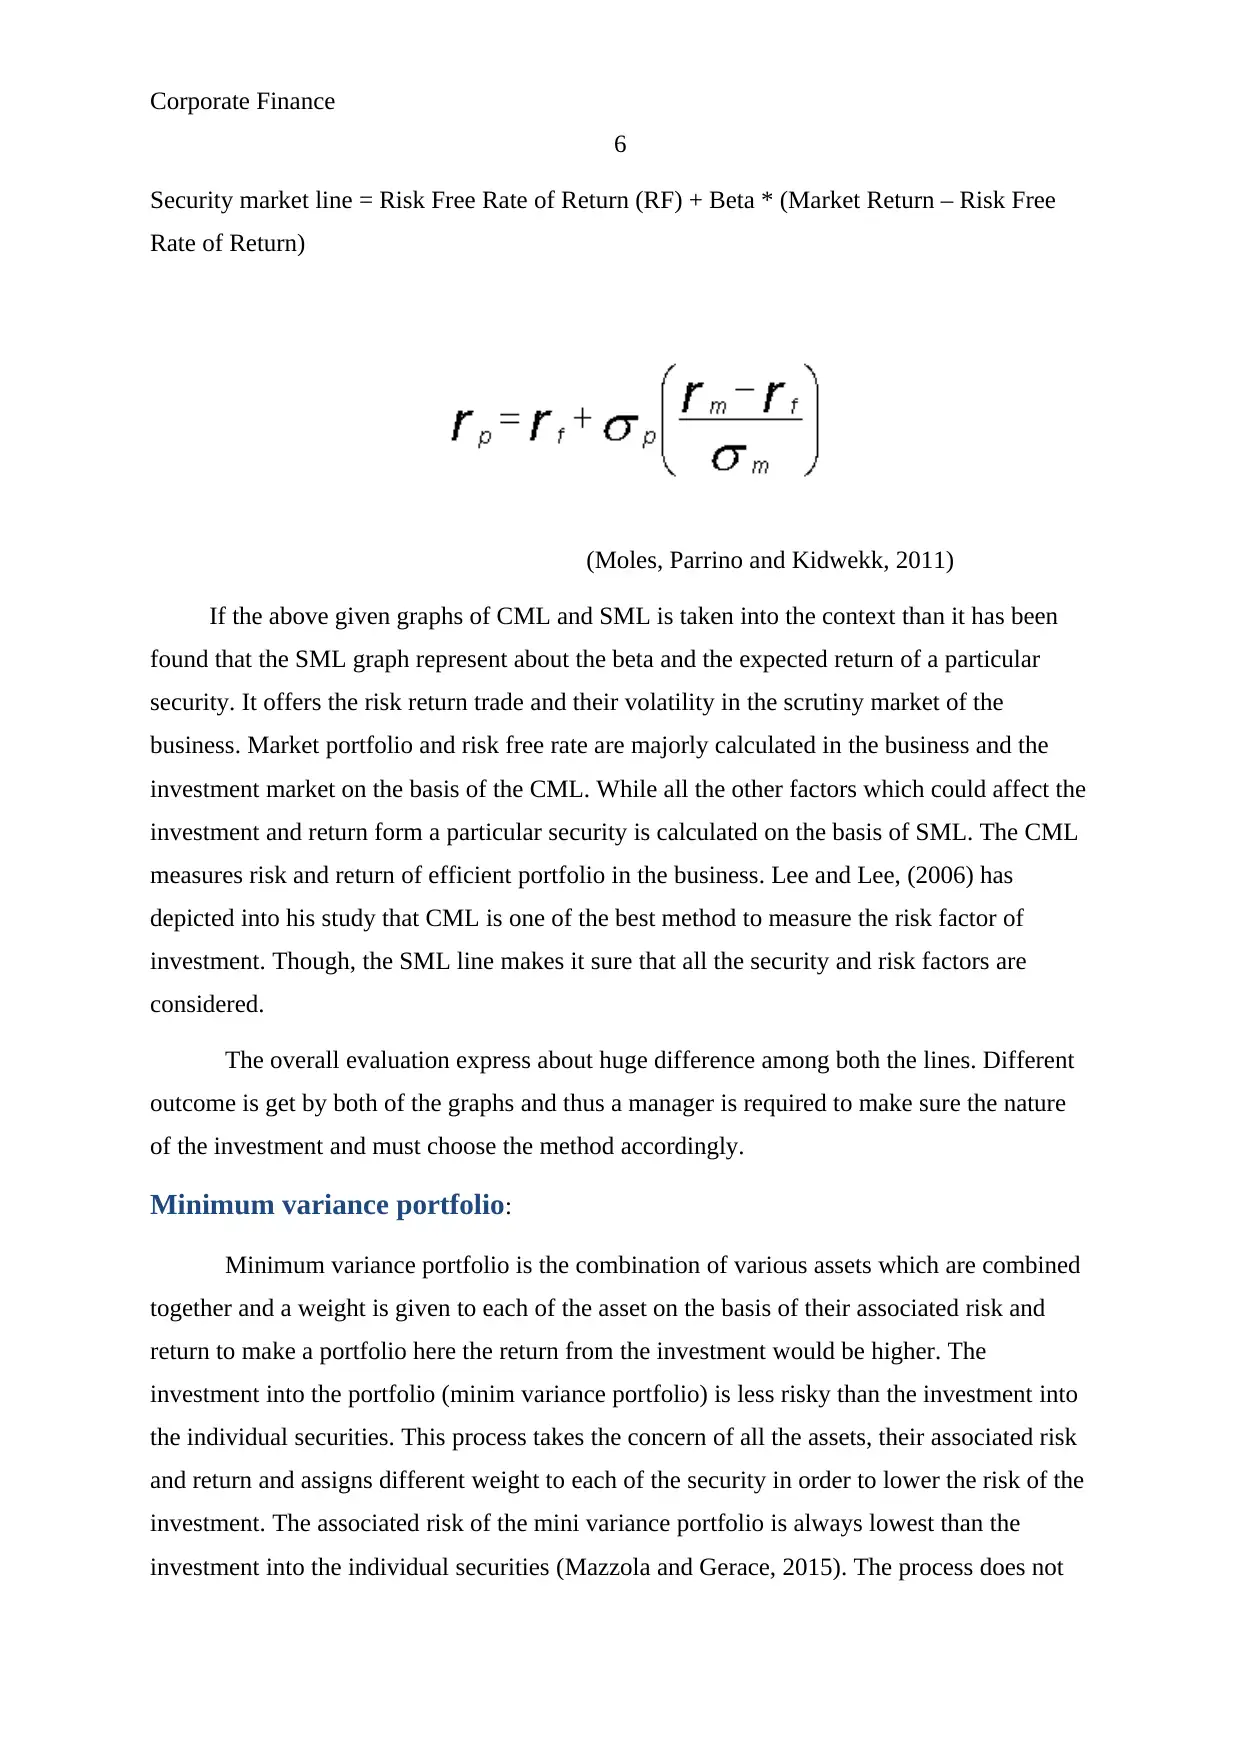
Security market line = Risk Free Rate of Return (RF) + Beta * (Market Return – Risk Free
Rate of Return)
(Moles, Parrino and Kidwekk, 2011)
If the above given graphs of CML and SML is taken into the context than it has been
found that the SML graph represent about the beta and the expected return of a particular
security. It offers the risk return trade and their volatility in the scrutiny market of the
business. Market portfolio and risk free rate are majorly calculated in the business and the
investment market on the basis of the CML. While all the other factors which could affect the
investment and return form a particular security is calculated on the basis of SML. The CML
measures risk and return of efficient portfolio in the business. Lee and Lee, (2006) has
depicted into his study that CML is one of the best method to measure the risk factor of
investment. Though, the SML line makes it sure that all the security and risk factors are
considered.
The overall evaluation express about huge difference among both the lines. Different
outcome is get by both of the graphs and thus a manager is required to make sure the nature
of the investment and must choose the method accordingly.
Minimum variance portfolio:
Minimum variance portfolio is the combination of various assets which are combined
together and a weight is given to each of the asset on the basis of their associated risk and
return to make a portfolio here the return from the investment would be higher. The
investment into the portfolio (minim variance portfolio) is less risky than the investment into
the individual securities. This process takes the concern of all the assets, their associated risk
and return and assigns different weight to each of the security in order to lower the risk of the
investment. The associated risk of the mini variance portfolio is always lowest than the
investment into the individual securities (Mazzola and Gerace, 2015). The process does not
6
Security market line = Risk Free Rate of Return (RF) + Beta * (Market Return – Risk Free
Rate of Return)
(Moles, Parrino and Kidwekk, 2011)
If the above given graphs of CML and SML is taken into the context than it has been
found that the SML graph represent about the beta and the expected return of a particular
security. It offers the risk return trade and their volatility in the scrutiny market of the
business. Market portfolio and risk free rate are majorly calculated in the business and the
investment market on the basis of the CML. While all the other factors which could affect the
investment and return form a particular security is calculated on the basis of SML. The CML
measures risk and return of efficient portfolio in the business. Lee and Lee, (2006) has
depicted into his study that CML is one of the best method to measure the risk factor of
investment. Though, the SML line makes it sure that all the security and risk factors are
considered.
The overall evaluation express about huge difference among both the lines. Different
outcome is get by both of the graphs and thus a manager is required to make sure the nature
of the investment and must choose the method accordingly.
Minimum variance portfolio:
Minimum variance portfolio is the combination of various assets which are combined
together and a weight is given to each of the asset on the basis of their associated risk and
return to make a portfolio here the return from the investment would be higher. The
investment into the portfolio (minim variance portfolio) is less risky than the investment into
the individual securities. This process takes the concern of all the assets, their associated risk
and return and assigns different weight to each of the security in order to lower the risk of the
investment. The associated risk of the mini variance portfolio is always lowest than the
investment into the individual securities (Mazzola and Gerace, 2015). The process does not
⊘ This is a preview!⊘
Do you want full access?
Subscribe today to unlock all pages.
Trusted by 1+ million students worldwide
Corporate Finance
7
depend on the return from the portfolio; the main motto of the process is to reduce the
associated risk level of the business.
MVP does not show its concern bout the single securities which associates the lower
risk. However, it takes the bunch of various stocks and assigns the different weight to them to
reduce the overall risk of the investment. The MVP process goes through various steps in
which the assets are chosen by the business firstly. Further, the risk, covariance, correlation,
return etc of the securities have been calculated in order to give a proper weight to each of the
asset. After measuring the risk and return of each of the assets of the investment, the weight
is given in order to reduce the overall associated risk of the portfolio (Ross, Westerfield and
Jaffe, 2007).
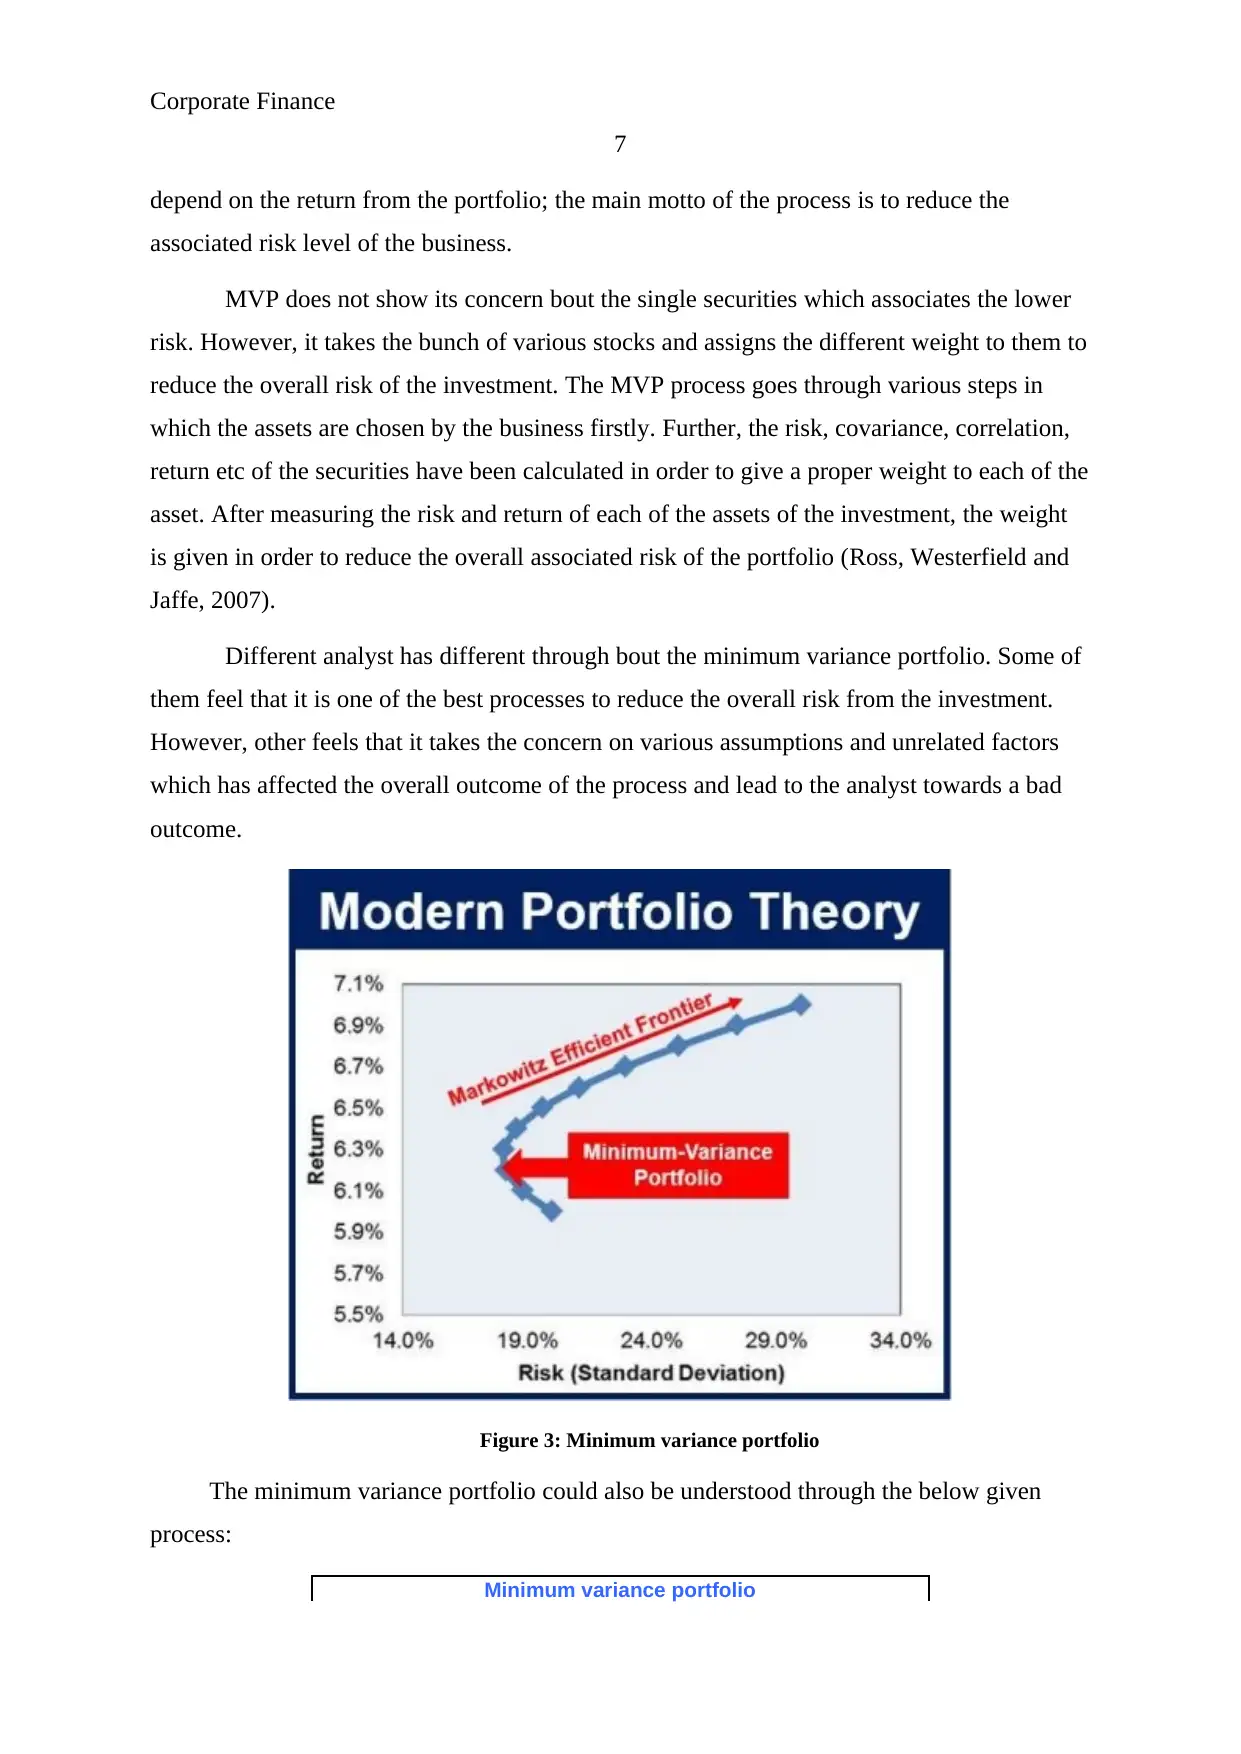
Different analyst has different through bout the minimum variance portfolio. Some of
them feel that it is one of the best processes to reduce the overall risk from the investment.
However, other feels that it takes the concern on various assumptions and unrelated factors
which has affected the overall outcome of the process and lead to the analyst towards a bad
outcome.
Figure 3: Minimum variance portfolio
The minimum variance portfolio could also be understood through the below given
process:
Minimum variance portfolio
7
depend on the return from the portfolio; the main motto of the process is to reduce the
associated risk level of the business.
MVP does not show its concern bout the single securities which associates the lower
risk. However, it takes the bunch of various stocks and assigns the different weight to them to
reduce the overall risk of the investment. The MVP process goes through various steps in
which the assets are chosen by the business firstly. Further, the risk, covariance, correlation,
return etc of the securities have been calculated in order to give a proper weight to each of the
asset. After measuring the risk and return of each of the assets of the investment, the weight
is given in order to reduce the overall associated risk of the portfolio (Ross, Westerfield and
Jaffe, 2007).
Different analyst has different through bout the minimum variance portfolio. Some of
them feel that it is one of the best processes to reduce the overall risk from the investment.
However, other feels that it takes the concern on various assumptions and unrelated factors
which has affected the overall outcome of the process and lead to the analyst towards a bad
outcome.
Figure 3: Minimum variance portfolio
The minimum variance portfolio could also be understood through the below given
process:
Minimum variance portfolio
Paraphrase This Document
Need a fresh take? Get an instant paraphrase of this document with our AI Paraphraser
Corporate Finance
8
Exp ret Std dev Cor(1,2) Cor(1,3) Cor(2,3)
Stock 1 0.06 0.15 0.30 0.35 0.38
Stock 2 0.05 0.20
Stock 3 0.08 0.25
Risk free 0.12
Covariance matrix
0.0225 0.0090 0.0131
0.0090 0.0400 0.0190
0.0131 0.0190 0.0625
Minimum variance portfolio
Weight 1 0.657
Weight 2 0.273
Weight 3 0.070
Exp ret 0.059
Std dev 0.135
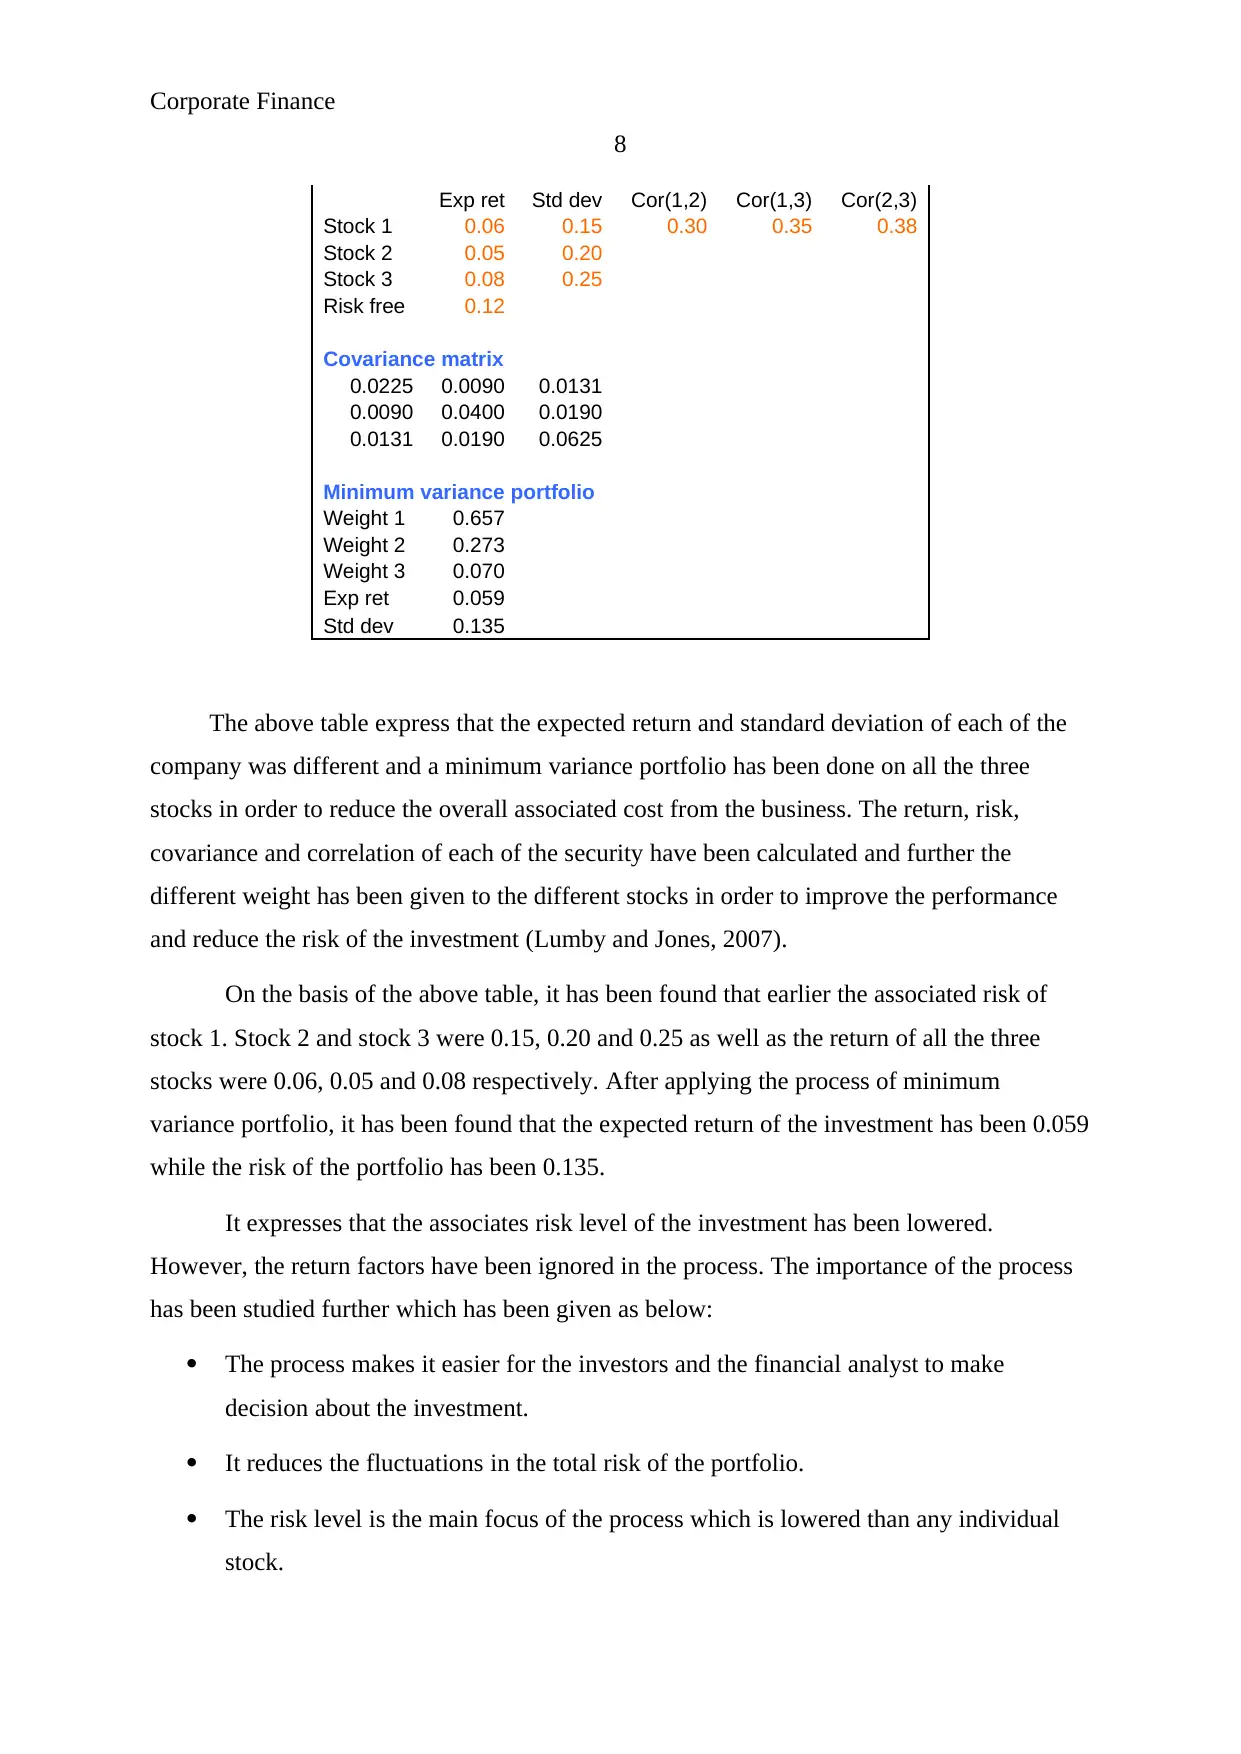
The above table express that the expected return and standard deviation of each of the
company was different and a minimum variance portfolio has been done on all the three
stocks in order to reduce the overall associated cost from the business. The return, risk,
covariance and correlation of each of the security have been calculated and further the
different weight has been given to the different stocks in order to improve the performance
and reduce the risk of the investment (Lumby and Jones, 2007).
On the basis of the above table, it has been found that earlier the associated risk of
stock 1. Stock 2 and stock 3 were 0.15, 0.20 and 0.25 as well as the return of all the three
stocks were 0.06, 0.05 and 0.08 respectively. After applying the process of minimum
variance portfolio, it has been found that the expected return of the investment has been 0.059
while the risk of the portfolio has been 0.135.
It expresses that the associates risk level of the investment has been lowered.
However, the return factors have been ignored in the process. The importance of the process
has been studied further which has been given as below:
The process makes it easier for the investors and the financial analyst to make
decision about the investment.
It reduces the fluctuations in the total risk of the portfolio.
The risk level is the main focus of the process which is lowered than any individual
stock.
8
Exp ret Std dev Cor(1,2) Cor(1,3) Cor(2,3)
Stock 1 0.06 0.15 0.30 0.35 0.38
Stock 2 0.05 0.20
Stock 3 0.08 0.25
Risk free 0.12
Covariance matrix
0.0225 0.0090 0.0131
0.0090 0.0400 0.0190
0.0131 0.0190 0.0625
Minimum variance portfolio
Weight 1 0.657
Weight 2 0.273
Weight 3 0.070
Exp ret 0.059
Std dev 0.135
The above table express that the expected return and standard deviation of each of the
company was different and a minimum variance portfolio has been done on all the three
stocks in order to reduce the overall associated cost from the business. The return, risk,
covariance and correlation of each of the security have been calculated and further the
different weight has been given to the different stocks in order to improve the performance
and reduce the risk of the investment (Lumby and Jones, 2007).
On the basis of the above table, it has been found that earlier the associated risk of
stock 1. Stock 2 and stock 3 were 0.15, 0.20 and 0.25 as well as the return of all the three
stocks were 0.06, 0.05 and 0.08 respectively. After applying the process of minimum
variance portfolio, it has been found that the expected return of the investment has been 0.059
while the risk of the portfolio has been 0.135.
It expresses that the associates risk level of the investment has been lowered.
However, the return factors have been ignored in the process. The importance of the process
has been studied further which has been given as below:
The process makes it easier for the investors and the financial analyst to make
decision about the investment.
It reduces the fluctuations in the total risk of the portfolio.
The risk level is the main focus of the process which is lowered than any individual
stock.
Corporate Finance
9
This is one of the advanced processes which take the concern on all the related factors
of the business (Ross, Westerfield, Jaffe and Kakani, 2008).
The process is useful for the investors to make decision.
Through studying the minimum variance portfolio process, it has been found that the
process is one of the significant approaches for the business to improve the performance and
reach over a conclusion about the investment.
CAPM equation:
CAPM is a model which is used by the investors and the financial analyst to identify
the expected return from the individual stock or a portfolio. It majorly takes the concern on
the risk free rate, market risk premium and beta of the company to evaluate that how much
return could be offered by the company to the shareholders, the CAPM represent the data in a
graphical manner with the help of SML (Anwar and Kumar, 2018). It always focuses on the
real figures to reach overall conclusion about the return of the stock and portfolio.
This fundamental tool also describe about the intrinsic value of the business on the
basis of that it could be identified that whether the stock of the company are undervalued or
overvalued. It identified the historical stock price of the business and identified the
fluctuations in the stock price (Bao, Diks and Li, 2018). On the basis of that, beta factor of
the company is measured and the other factors are taken on the basis of the country
performance and the economical level. The CAPM equation of the company is as follows:
r = kRF + b(kM - kRF)
Where,
r = required return
kRF = the risk-free rate
kM = the average market return
b = the beta coefficient of the security
(Campbell, Giglio, Polk and Turley, 2018)
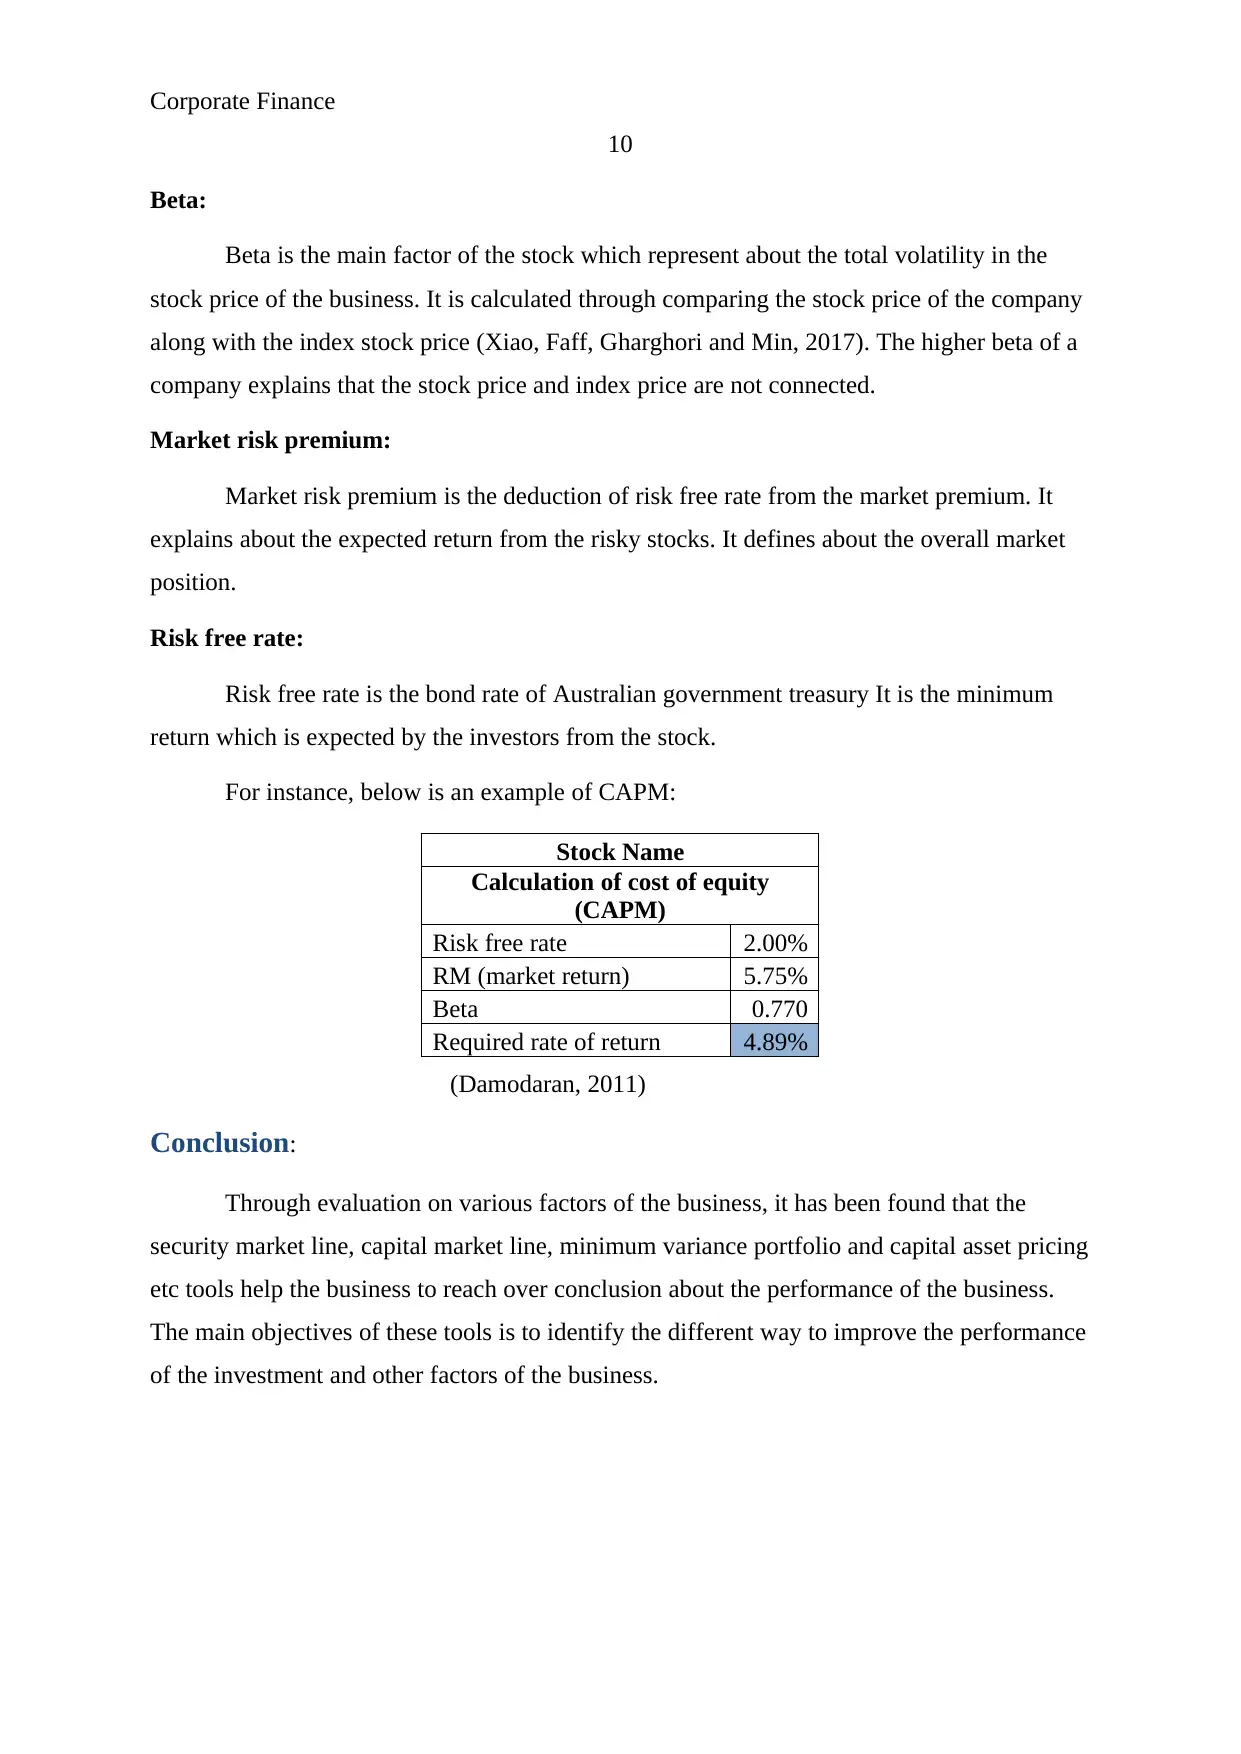
the equation explain that how the risk free rate, market risk premium and the beta of
the stock helps the investors and the analyst to identify the total return from the stock. The
explanation of each of the item is as follows:
9
This is one of the advanced processes which take the concern on all the related factors
of the business (Ross, Westerfield, Jaffe and Kakani, 2008).
The process is useful for the investors to make decision.
Through studying the minimum variance portfolio process, it has been found that the
process is one of the significant approaches for the business to improve the performance and
reach over a conclusion about the investment.
CAPM equation:
CAPM is a model which is used by the investors and the financial analyst to identify
the expected return from the individual stock or a portfolio. It majorly takes the concern on
the risk free rate, market risk premium and beta of the company to evaluate that how much
return could be offered by the company to the shareholders, the CAPM represent the data in a
graphical manner with the help of SML (Anwar and Kumar, 2018). It always focuses on the
real figures to reach overall conclusion about the return of the stock and portfolio.
This fundamental tool also describe about the intrinsic value of the business on the
basis of that it could be identified that whether the stock of the company are undervalued or
overvalued. It identified the historical stock price of the business and identified the
fluctuations in the stock price (Bao, Diks and Li, 2018). On the basis of that, beta factor of
the company is measured and the other factors are taken on the basis of the country
performance and the economical level. The CAPM equation of the company is as follows:
r = kRF + b(kM - kRF)
Where,
r = required return
kRF = the risk-free rate
kM = the average market return
b = the beta coefficient of the security
(Campbell, Giglio, Polk and Turley, 2018)
the equation explain that how the risk free rate, market risk premium and the beta of
the stock helps the investors and the analyst to identify the total return from the stock. The
explanation of each of the item is as follows:
⊘ This is a preview!⊘
Do you want full access?
Subscribe today to unlock all pages.
Trusted by 1+ million students worldwide
Corporate Finance
10
Beta:
Beta is the main factor of the stock which represent about the total volatility in the
stock price of the business. It is calculated through comparing the stock price of the company
along with the index stock price (Xiao, Faff, Gharghori and Min, 2017). The higher beta of a
company explains that the stock price and index price are not connected.
Market risk premium:
Market risk premium is the deduction of risk free rate from the market premium. It
explains about the expected return from the risky stocks. It defines about the overall market
position.
Risk free rate:
Risk free rate is the bond rate of Australian government treasury It is the minimum
return which is expected by the investors from the stock.
For instance, below is an example of CAPM:
Stock Name
Calculation of cost of equity
(CAPM)
Risk free rate 2.00%
RM (market return) 5.75%
Beta 0.770
Required rate of return 4.89%
(Damodaran, 2011)
Conclusion:
Through evaluation on various factors of the business, it has been found that the
security market line, capital market line, minimum variance portfolio and capital asset pricing
etc tools help the business to reach over conclusion about the performance of the business.
The main objectives of these tools is to identify the different way to improve the performance
of the investment and other factors of the business.
Paraphrase This Document
Need a fresh take? Get an instant paraphrase of this document with our AI Paraphraser
Corporate Finance
11
References:
Anwar, M. and Kumar, S., (2018) Sectoral Robustness of Asset Pricing Models: Evidence
from the Indian Capital Market. Indian Journal of Commerce and Management Studies, 9(2),
pp.42-50.
Bao, T., Diks, C. and Li, H., (2018) A generalized CAPM model with asymmetric power
distributed errors with an application to portfolio construction. Economic Modelling, 68,
pp.611-621.
Campbell, J.Y., Giglio, S., Polk, C. and Turley, R., (2018) Anintertemporal CAPM with
stochastic volatility. Journal of Financial Economics, 128(2), pp.207-233.
Damodaran, A, 2011, Applied corporate finance. 3rd edition, John Wiley & sons, USA.
Lee.C.F and Lee, A, C,.2006. Encyclopedia of finance. Springer science, new York.
Lumby,S and Jones,C,.2007, Corporate finance theory & practice, 7th edition, Thomson,
London.
Mazzola, P. and Gerace, D., (2015). A comparison between a dynamic and static approach to
asset management using CAPM models on the Australian securities market. Australasian
Accounting, Business and Finance Journal, 9(2), pp.43-58.
Moles, P. Parrino, R and Kidwekk, D,.2011. Corporate finance. European edition, John
Wiley &sons, United Kingdom.
Ross, A,. Westerfield, R,W,. Jaffe,J,.and Kakani,R,K,.2008. Corporate Finance. 8th edition,
Tata McGraw hill education private limited, New Delhi, India
Ross, S, A,. Westerfield, R, W,. And Jaffe, J,.2007. Corporate Finance. the McGraw-hill,
India
Xiao, Y., Faff, R., Gharghori, P. and Min, B.K., (2017) The Financial Performance of
Socially Responsible Investments: Insights from the Intertemporal CAPM. Journal of
Business Ethics, 146(2), pp.353-364.
Zabarankin, M., Pavlikov, K. and Uryasev, S. 2014. "Capital Asset Pricing Model with
drawdown measure", European Journal of Operational Research, 234 (2), pp. 508.
1 out of 11
Related Documents


Your All-in-One AI-Powered Toolkit for Academic Success.
+13062052269
info@desklib.com
Available 24*7 on WhatsApp / Email
![[object Object]](/_next/static/media/star-bottom.7253800d.svg)
Unlock your academic potential
Copyright © 2020–2026 A2Z Services. All Rights Reserved. Developed and managed by ZUCOL.