SEE717 - Smart Grid Systems Lab 4: Design, Simulate, Analyze DG Unit
VerifiedAdded on 2023/03/30
|9
|1478
|289
Practical Assignment
AI Summary
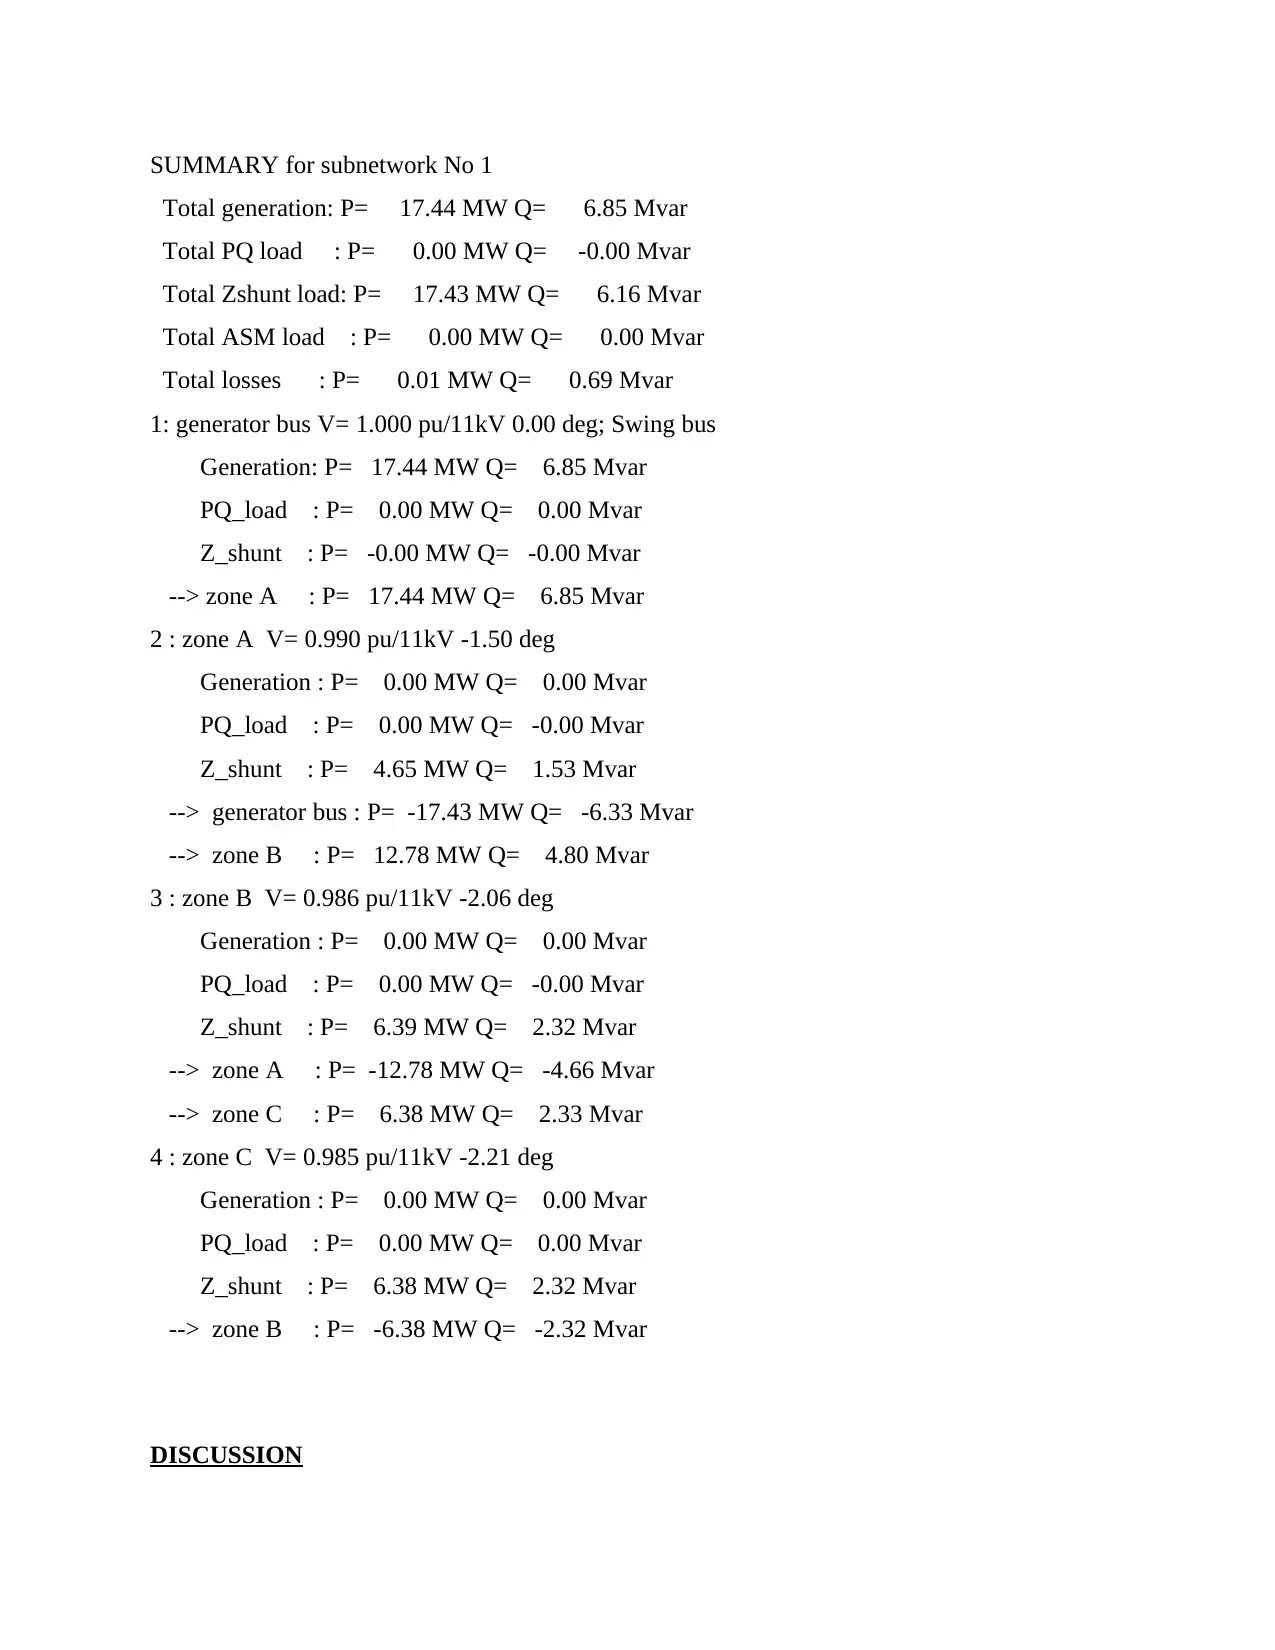
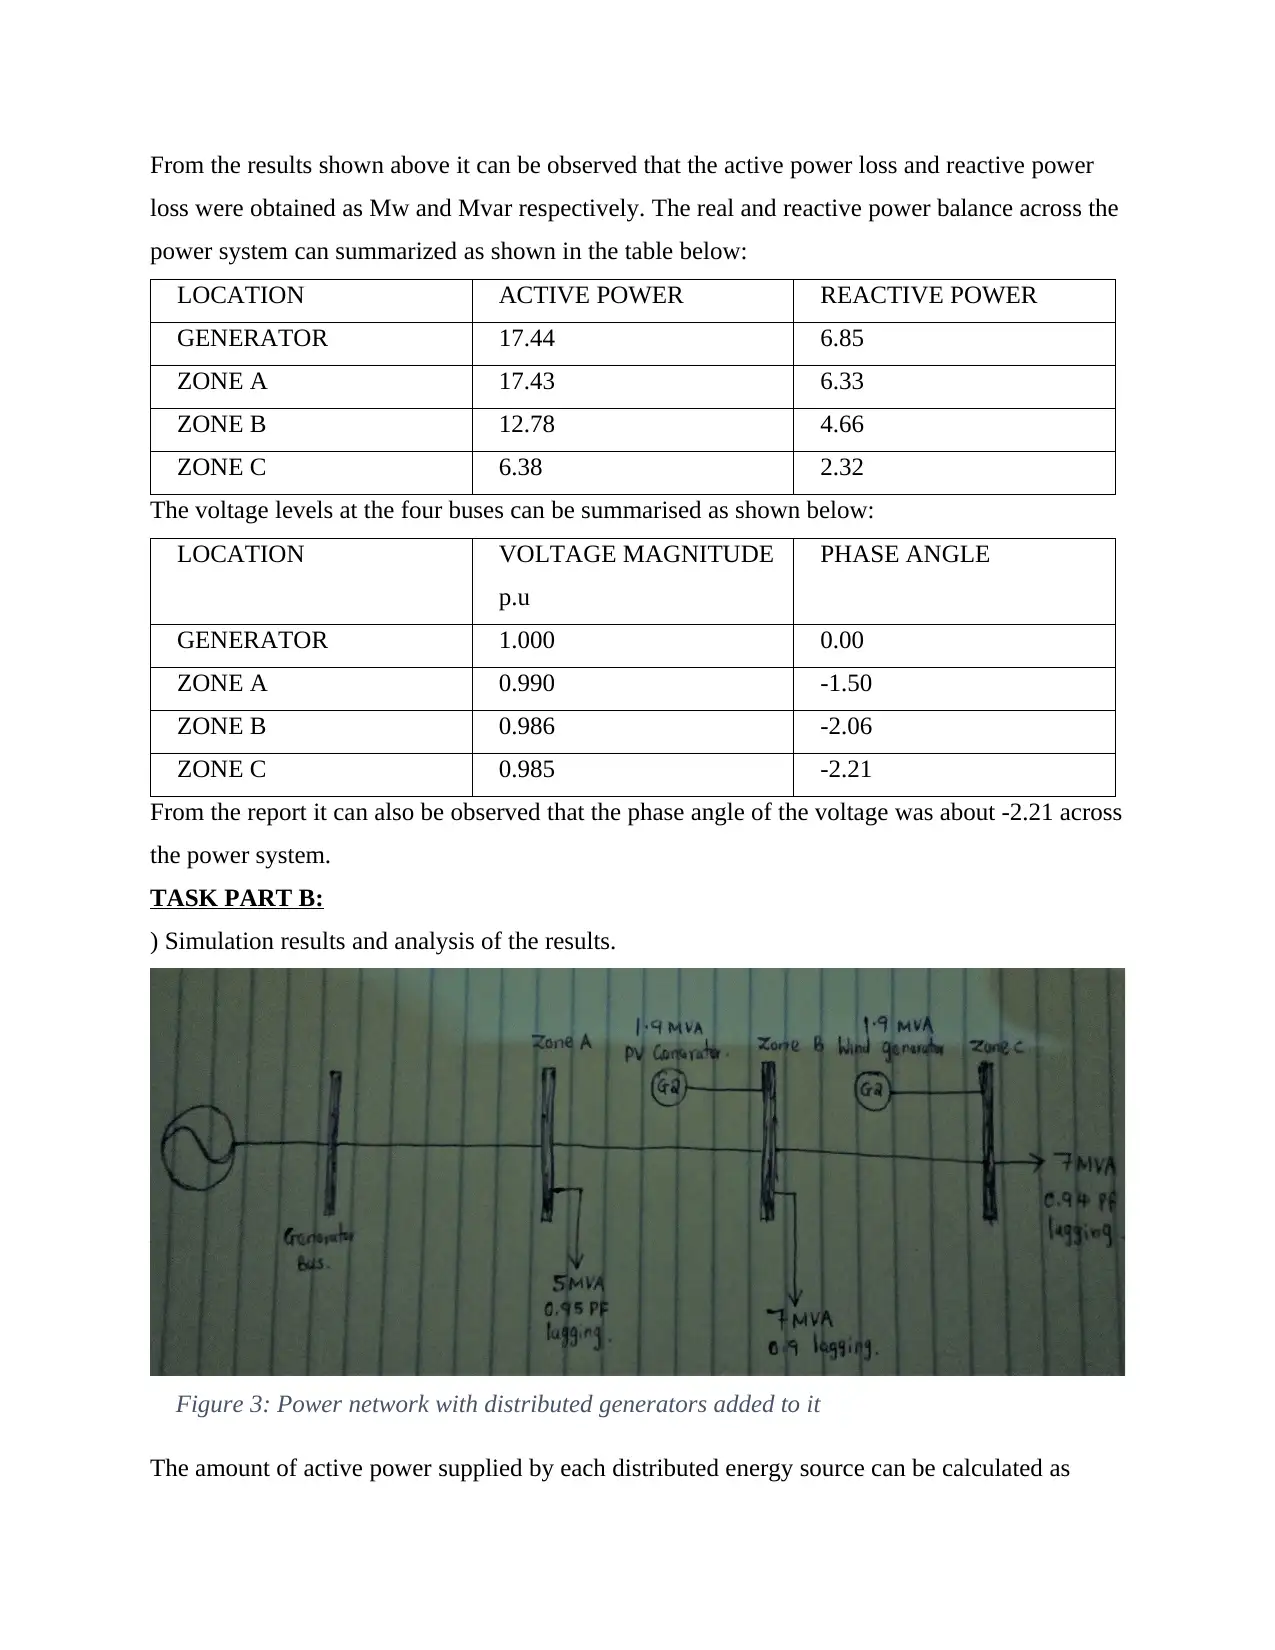
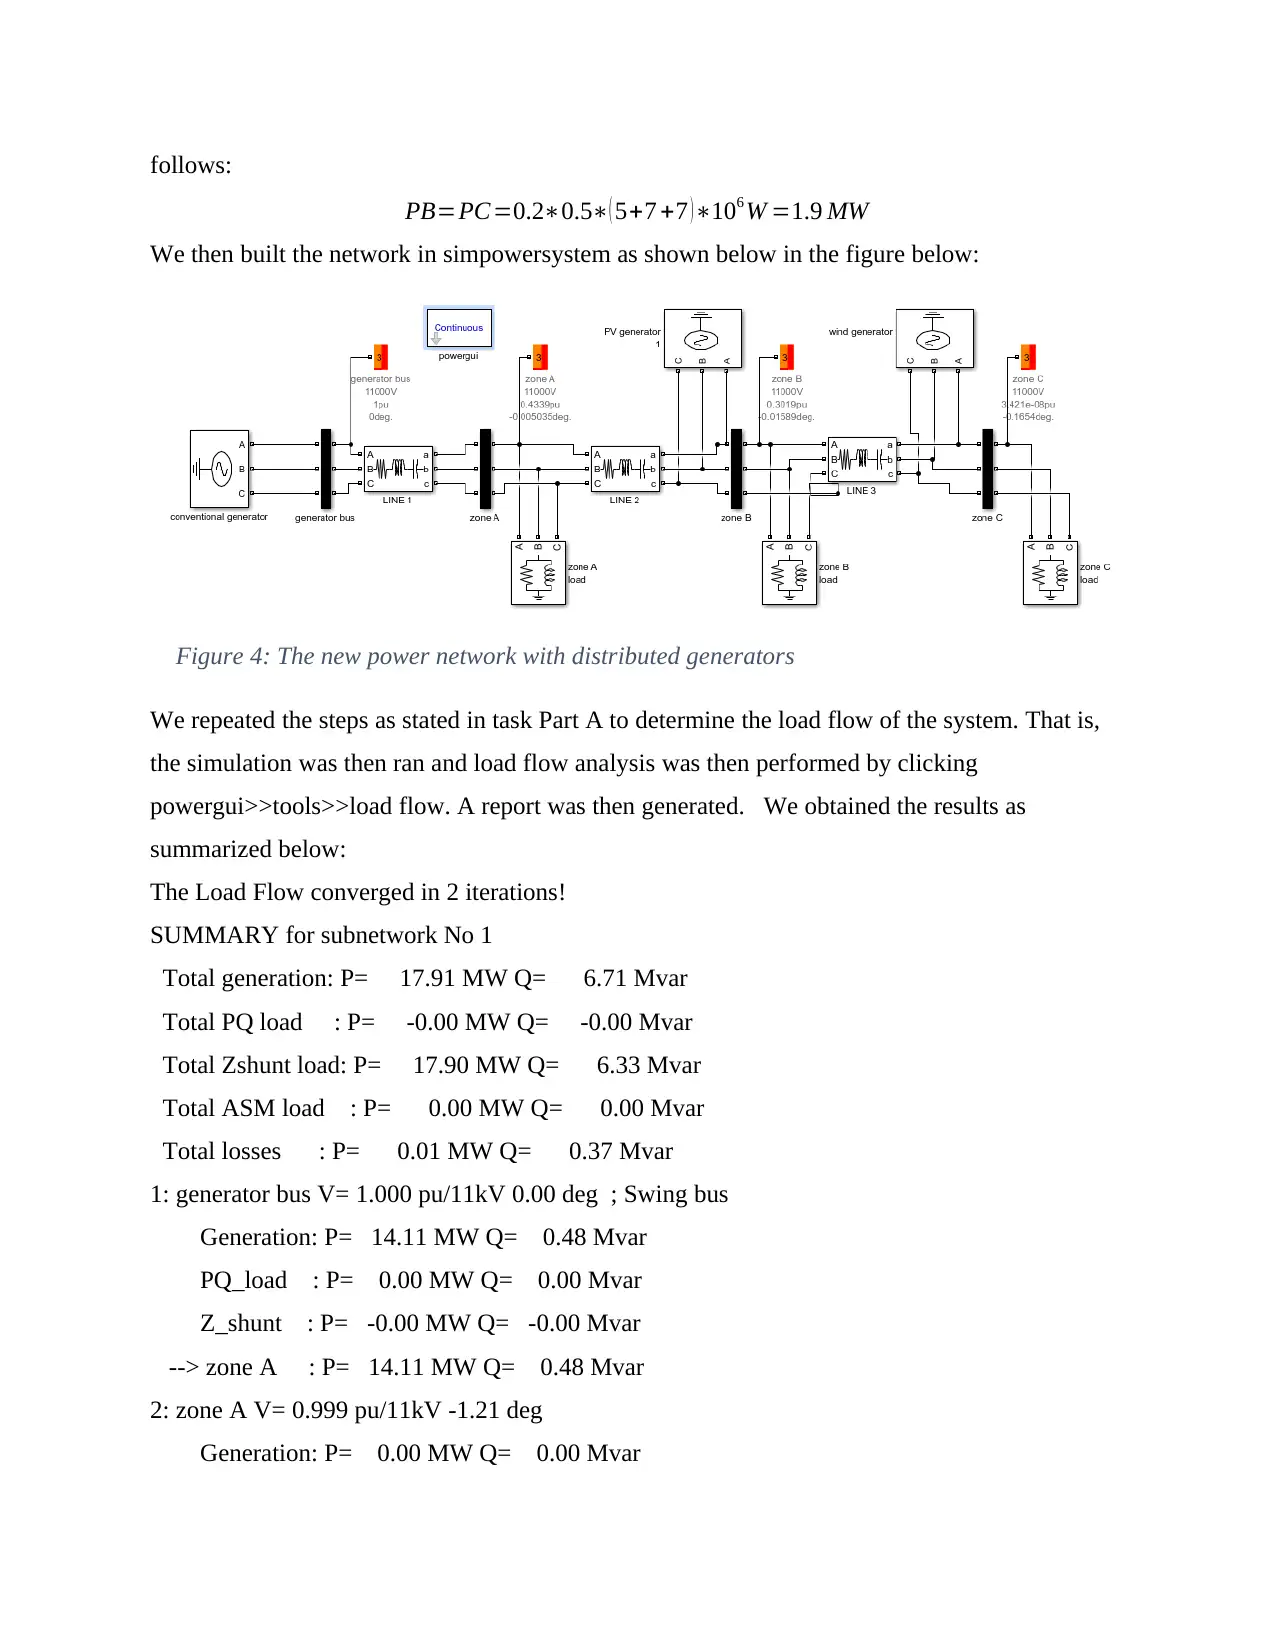
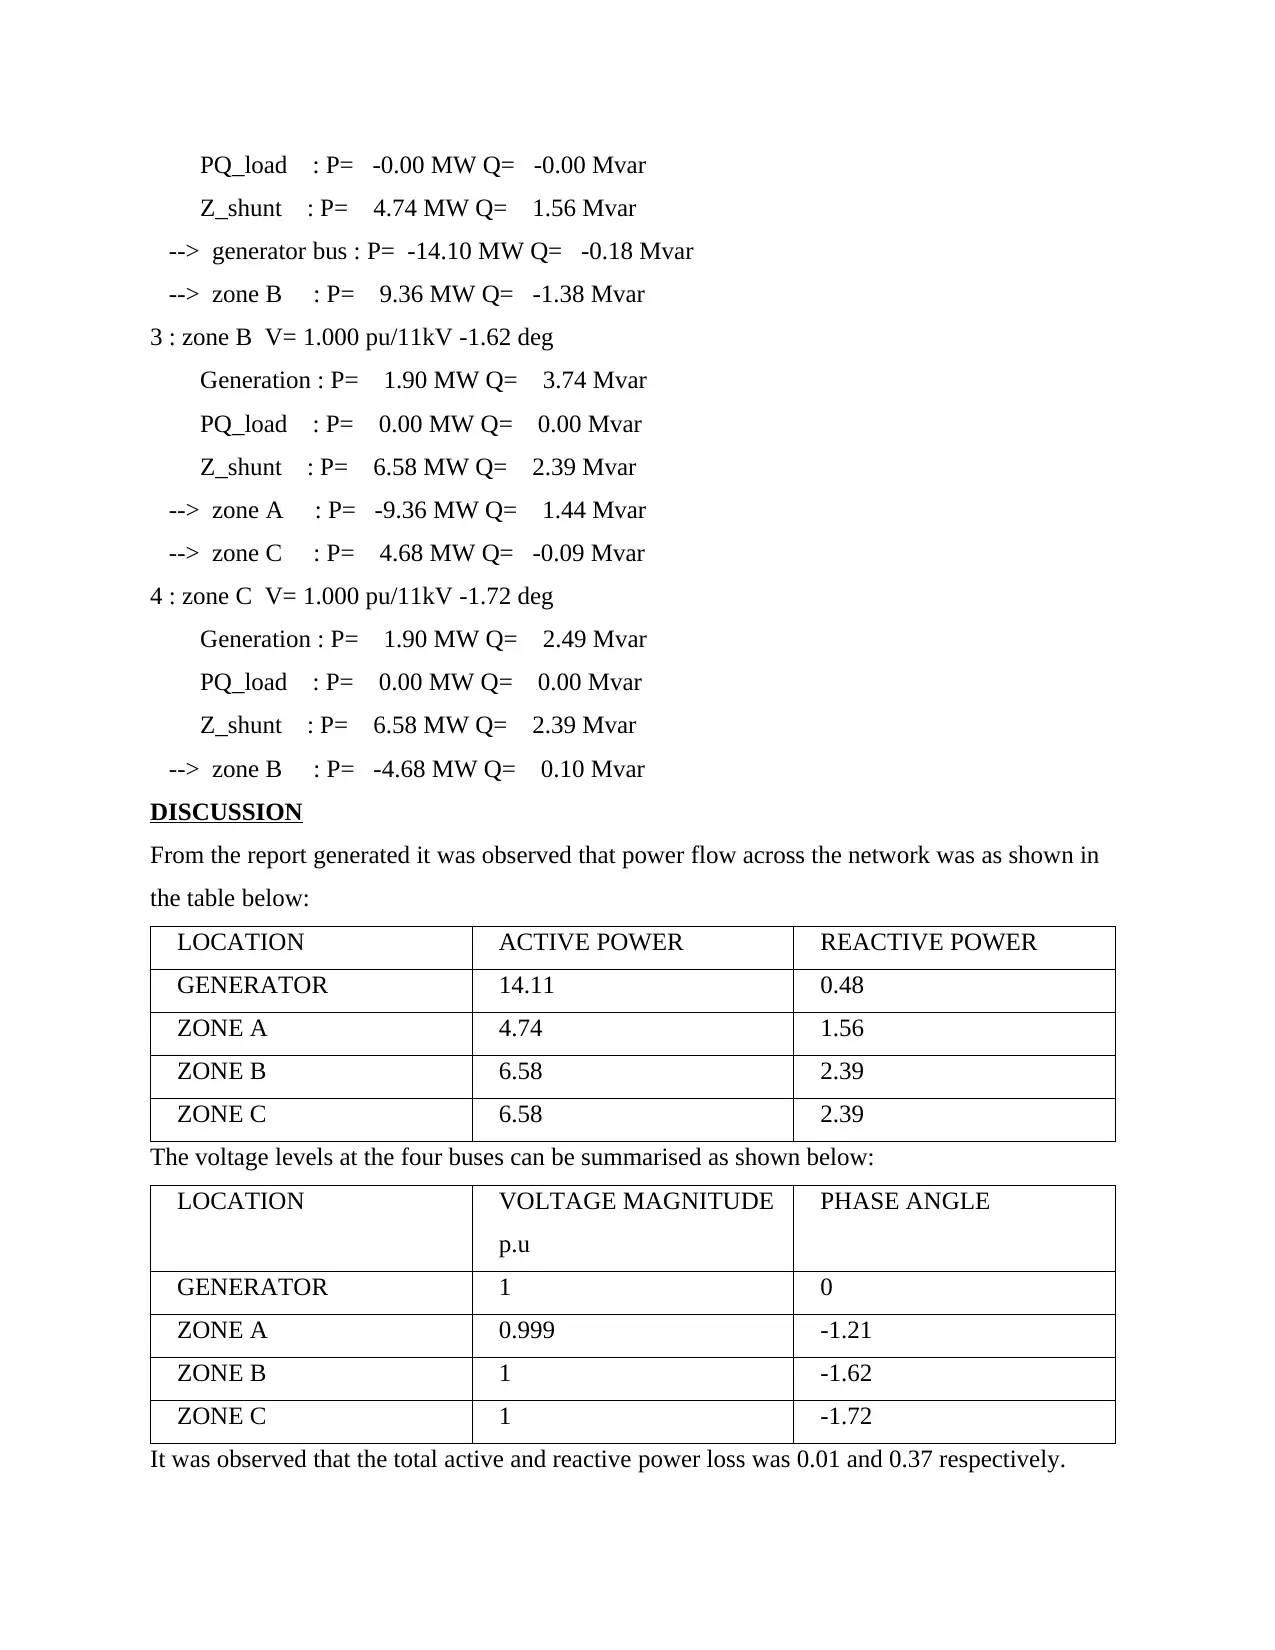
This assignment, part of SEE717 Smart Grid Systems, details the design and simulation of a Voltage Source Converter (VSC) interfaced Distributed Generation (DG) unit for a small smart grid. The student models a power network in SimPowerSystem, performs load flow analysis, and incorporates PV and wind generators to meet specific power demands, including loss minimization, renewable energy supply, and voltage regulation. The assignment involves detailed calculations, including line impedance and inductance, and presents simulation results, demonstrating the impact of DGs on power flow, voltage levels, and overall system performance. The student analyzes the results, comparing scenarios with and without distributed generation, and concludes that the design specifications are met, achieving the objectives of the lab assignment.

SEE717 – SMART GRID SYSTEMS
ASSIGNMENT NO: 4
NAME: FAREED
STUDENT ID: 218669759
Laboratory Work #4
OBJECTIVES OF THE LAB ASSIGNMENT
To design a VSC interfaced DG unit to supply real and reactive power to the grid.
ASSIGNMENT NO: 4
NAME: FAREED
STUDENT ID: 218669759
Laboratory Work #4
OBJECTIVES OF THE LAB ASSIGNMENT
To design a VSC interfaced DG unit to supply real and reactive power to the grid.
Paraphrase This Document
Need a fresh take? Get an instant paraphrase of this document with our AI Paraphraser

To Simulate and analyse the results.
INTRODUCTION
Minor scale generation units 1kW-50Mw that yield electricity adjacent to the users or that are
linked to the spread network are denoted to as distributed generators. In recent times, countless
research have been embarked on to learn the influence of distributed generators on the
nationwide grid. Over and above, new expertise have been thought up on which distributed
generation can realized. This is because distributed generation has a number of recipients. Some
of the dynamics that have steered to development of distributed generation or embedded
generators take account of:
Improved concentration in cogeneration and collective heat power generation.
Improved concentration in renewable generation.
Denationalization and new entrants in the power generation.
DESCRIPTION OF THE ASSIGNMENT
In this lab assignment we are required to model a small smart grid system as shown in figure 1
above in sim power system and perform load flow analysis on the power system. In the first part
we are going to perform load flow on the power system as it exist. In the second part of the
power system we will introduce PV and wind generators at zones B and C respectively to meet
the following demands:
Loss should be less than the existing case.
Twenty percent of the total real power load demand is required to be supplied by the
renewable energy resources.
The voltage magnitude at each of the zones are required to be maintained with in ±2% of
the rated or base voltage.
The voltage angle of the zones are required to be maintained such that at least stability
margin of 80 degrees is maintained.
TASK PART A

Detail description of the steps and calculations to complete this design.
Figure 1: One-line diagram of the power network
FORMULATION OF THE POWER SYSTEM
In our formulation we will assume that all the four buses are on the same voltage level that is
11kV. Our problem will be determine the load flow of the system in simpowersystem. We will
obtain the equivalent active and reactive ratings of the loads at zones A, B and C.
P=S∗cos θ=S∗power factor
Q= √ S2 −P2
The load values can be summarised as shown below:
ZONE LOAD APPARENT
POWER
MVA
POWER
FACTOR
LAGGING
ACTIVE
POWER MW
REACTIVE
POWER MVAR
A 5 0.95 4.75 1.561
B 7 0.94 6.58 2.388
C 7 0.94 6.58 2.388
The line impedance of the power system can be calculated as follows:
Vbasekv=11, Sbase MVA=100,
Zline=Zperkm∗Length of the line
Zact=Zpu∗Zbase
⊘ This is a preview!⊘
Do you want full access?
Subscribe today to unlock all pages.

Trusted by 1+ million students worldwide

Zbase=Vbasekv2
Sbase = 112
100 =1.21 Ω
The line parameters can be summarised as shown below:
LINE LINE
PARAMETERS in
(p.u.)
ACTUAL LINE
PARAMETERS
A 0.003+j0.15 0.00363+j0.1815
B 0.0015+j0.075 0.001815+j0.09075
C 0.0008+j0.04 0.000968+j0.0484
The line inductance can be calculated as:
f=50Hz
L= Xl
2∗π∗f
The line inductance were obtained as 0.5777, 0.2889 and 0.1541 mH for lines connecting Zones
A, zone B and zone C respectively.
We built the power in simpowersytem as shown below:
Figure 2: The small power network in simpowersystem
The simulation was then ran and load flow analysis was then performed by clicking
powergui>>tools>>load flow. A report was then generated. The results are as shown below.
SIMULATION RESULTS
The Load Flow converged in 1 iteration!
Paraphrase This Document
Need a fresh take? Get an instant paraphrase of this document with our AI Paraphraser

SUMMARY for subnetwork No 1
Total generation: P= 17.44 MW Q= 6.85 Mvar
Total PQ load : P= 0.00 MW Q= -0.00 Mvar
Total Zshunt load: P= 17.43 MW Q= 6.16 Mvar
Total ASM load : P= 0.00 MW Q= 0.00 Mvar
Total losses : P= 0.01 MW Q= 0.69 Mvar
1: generator bus V= 1.000 pu/11kV 0.00 deg; Swing bus
Generation: P= 17.44 MW Q= 6.85 Mvar
PQ_load : P= 0.00 MW Q= 0.00 Mvar
Z_shunt : P= -0.00 MW Q= -0.00 Mvar
--> zone A : P= 17.44 MW Q= 6.85 Mvar
2 : zone A V= 0.990 pu/11kV -1.50 deg
Generation : P= 0.00 MW Q= 0.00 Mvar
PQ_load : P= 0.00 MW Q= -0.00 Mvar
Z_shunt : P= 4.65 MW Q= 1.53 Mvar
--> generator bus : P= -17.43 MW Q= -6.33 Mvar
--> zone B : P= 12.78 MW Q= 4.80 Mvar
3 : zone B V= 0.986 pu/11kV -2.06 deg
Generation : P= 0.00 MW Q= 0.00 Mvar
PQ_load : P= 0.00 MW Q= -0.00 Mvar
Z_shunt : P= 6.39 MW Q= 2.32 Mvar
--> zone A : P= -12.78 MW Q= -4.66 Mvar
--> zone C : P= 6.38 MW Q= 2.33 Mvar
4 : zone C V= 0.985 pu/11kV -2.21 deg
Generation : P= 0.00 MW Q= 0.00 Mvar
PQ_load : P= 0.00 MW Q= 0.00 Mvar
Z_shunt : P= 6.38 MW Q= 2.32 Mvar
--> zone B : P= -6.38 MW Q= -2.32 Mvar
DISCUSSION

From the results shown above it can be observed that the active power loss and reactive power
loss were obtained as Mw and Mvar respectively. The real and reactive power balance across the
power system can summarized as shown in the table below:
LOCATION ACTIVE POWER REACTIVE POWER
GENERATOR 17.44 6.85
ZONE A 17.43 6.33
ZONE B 12.78 4.66
ZONE C 6.38 2.32
The voltage levels at the four buses can be summarised as shown below:
LOCATION VOLTAGE MAGNITUDE
p.u
PHASE ANGLE
GENERATOR 1.000 0.00
ZONE A 0.990 -1.50
ZONE B 0.986 -2.06
ZONE C 0.985 -2.21
From the report it can also be observed that the phase angle of the voltage was about -2.21 across
the power system.
TASK PART B:
) Simulation results and analysis of the results.
Figure 3: Power network with distributed generators added to it
The amount of active power supplied by each distributed energy source can be calculated as
⊘ This is a preview!⊘
Do you want full access?
Subscribe today to unlock all pages.

Trusted by 1+ million students worldwide

follows:
PB=PC=0.2∗0.5∗( 5+7 +7 )∗106 W =1.9 MW
We then built the network in simpowersystem as shown below in the figure below:
Figure 4: The new power network with distributed generators
We repeated the steps as stated in task Part A to determine the load flow of the system. That is,
the simulation was then ran and load flow analysis was then performed by clicking
powergui>>tools>>load flow. A report was then generated. We obtained the results as
summarized below:
The Load Flow converged in 2 iterations!
SUMMARY for subnetwork No 1
Total generation: P= 17.91 MW Q= 6.71 Mvar
Total PQ load : P= -0.00 MW Q= -0.00 Mvar
Total Zshunt load: P= 17.90 MW Q= 6.33 Mvar
Total ASM load : P= 0.00 MW Q= 0.00 Mvar
Total losses : P= 0.01 MW Q= 0.37 Mvar
1: generator bus V= 1.000 pu/11kV 0.00 deg ; Swing bus
Generation: P= 14.11 MW Q= 0.48 Mvar
PQ_load : P= 0.00 MW Q= 0.00 Mvar
Z_shunt : P= -0.00 MW Q= -0.00 Mvar
--> zone A : P= 14.11 MW Q= 0.48 Mvar
2: zone A V= 0.999 pu/11kV -1.21 deg
Generation: P= 0.00 MW Q= 0.00 Mvar
Paraphrase This Document
Need a fresh take? Get an instant paraphrase of this document with our AI Paraphraser

PQ_load : P= -0.00 MW Q= -0.00 Mvar
Z_shunt : P= 4.74 MW Q= 1.56 Mvar
--> generator bus : P= -14.10 MW Q= -0.18 Mvar
--> zone B : P= 9.36 MW Q= -1.38 Mvar
3 : zone B V= 1.000 pu/11kV -1.62 deg
Generation : P= 1.90 MW Q= 3.74 Mvar
PQ_load : P= 0.00 MW Q= 0.00 Mvar
Z_shunt : P= 6.58 MW Q= 2.39 Mvar
--> zone A : P= -9.36 MW Q= 1.44 Mvar
--> zone C : P= 4.68 MW Q= -0.09 Mvar
4 : zone C V= 1.000 pu/11kV -1.72 deg
Generation : P= 1.90 MW Q= 2.49 Mvar
PQ_load : P= 0.00 MW Q= 0.00 Mvar
Z_shunt : P= 6.58 MW Q= 2.39 Mvar
--> zone B : P= -4.68 MW Q= 0.10 Mvar
DISCUSSION
From the report generated it was observed that power flow across the network was as shown in
the table below:
LOCATION ACTIVE POWER REACTIVE POWER
GENERATOR 14.11 0.48
ZONE A 4.74 1.56
ZONE B 6.58 2.39
ZONE C 6.58 2.39
The voltage levels at the four buses can be summarised as shown below:
LOCATION VOLTAGE MAGNITUDE
p.u
PHASE ANGLE
GENERATOR 1 0
ZONE A 0.999 -1.21
ZONE B 1 -1.62
ZONE C 1 -1.72
It was observed that the total active and reactive power loss was 0.01 and 0.37 respectively.

From the report it can also be observed that the voltage was about -1.72 across the power system
which meets the demands of the installation of DGs. Therefore the design specifications all met
by incorporating distributed generators to the small power network.
CONCLUSION
In conclusion, we were able the design specifications of the smart grid system, therefore the
objectives of the experiment were met. Therefore we can conclude that the objectives of the lab
assignment were met.
⊘ This is a preview!⊘
Do you want full access?
Subscribe today to unlock all pages.

Trusted by 1+ million students worldwide
1 out of 9
Related Documents

Your All-in-One AI-Powered Toolkit for Academic Success.
+13062052269
info@desklib.com
Available 24*7 on WhatsApp / Email
Unlock your academic potential
Copyright © 2020–2025 A2Z Services. All Rights Reserved. Developed and managed by ZUCOL.