7211AFE Corporate Finance: Seek Ltd Financial Performance Review
VerifiedAdded on 2022/11/13
|17
|3599
|230
Case Study
AI Summary
This case study analyzes the financial performance of Seek Ltd, an Australian commercial and professional services firm, using financial statements and ratios from 2017 to 2018. The study employs an analytical approach, examining profitability, asset utilization, and capital structure. Key ratios like gross profit margin, return on total assets, return on equity, and debt-to-equity ratios are evaluated to assess the company's performance. The analysis reveals a decline in profitability from 2017 to 2018, attributed to increased operational expenses and a shift towards debt financing. The study also includes an analysis of the company's corporate governance structure and risk profiles. The conclusion highlights the strengths and weaknesses of Seek Ltd during the analyzed period, providing insights into its financial health and strategic decisions.

Review of financial performance
A Case Study of Seek Ltd
A Case Study of Seek Ltd
Paraphrase This Document
Need a fresh take? Get an instant paraphrase of this document with our AI Paraphraser
Executive Summary
The study tries to analyze financial statements of Seek Ltd and equally ration
the performance in terms of assets utilization, and overall profitability. The
study adopted an analytical approach, the study dwelled majorly on previous
and current performance of Seek Ltd which is an Australian Commercial &
Professional Services firm. The research entirely dependent on the historical
data available, for a period of two years (2017 to December 2018) from the
annual year report and audited financial information of the company that
was available from the ASX database through various organizations including
the Australian stocks exchange for periodic analysis. To be able to analyze
the performance of the company various items were evaluated with help of
financial ratios and accounting ratios. The research analyzed accounting
ratios and financial statement analysis was done to determine the overall
performance index of the firm, this included profitability ratios that had a
great influence on the overall financial performance of the firm. The following
ratios were looked at Gross profit margin (GPM). Return on total assets
(ROTA), Return on equity (ROE), debt to equity ratios, current ratio were all
analyzed. The analysis was done to the case of Seek Ltd. The study reveals
strengths and weakness of the company over the financial period 2017 to
2018. In the fiscal year 2017 performance was better than fiscal year 2018,
there was a significant decline in the profitability of the firm, this was
because of increased operational expenses, furthermore the company
restructured its capital financing, with more financing coming from increased
borrowings.
Keywords: Debt ratios, Liquidity Ratios, Profitability Ratios, Seek
Ltd
ii
Tables of Contents
Executive Summary.........................................................................................ii
List of tables....................................................................................................iv
1.0 Introduction...............................................................................................1
1.0.1 Corporate governance.........................................................................1
2.1 Risk and return..........................................................................................2
2.1.1 Analysis of the firm..............................................................................2
2.1.2 Working Average Cost Of Capital........................................................4
3.1 Companies performance............................................................................4
3.1.1 Profit margin........................................................................................4
3.1.2 Return on Total assets.........................................................................5
4.1 Competitive advantage and firm’s performance.......................................5
4.1.1 Performance Measures........................................................................5
5.1 Firms financing structure...........................................................................5
6.1 Dividends payout.......................................................................................6
References.......................................................................................................7
Appendices......................................................................................................8
Appendix 1 Income statement......................................................................8
Appendix 2 Balance Sheet..........................................................................10
iii
⊘ This is a preview!⊘
Do you want full access?
Subscribe today to unlock all pages.
Trusted by 1+ million students worldwide
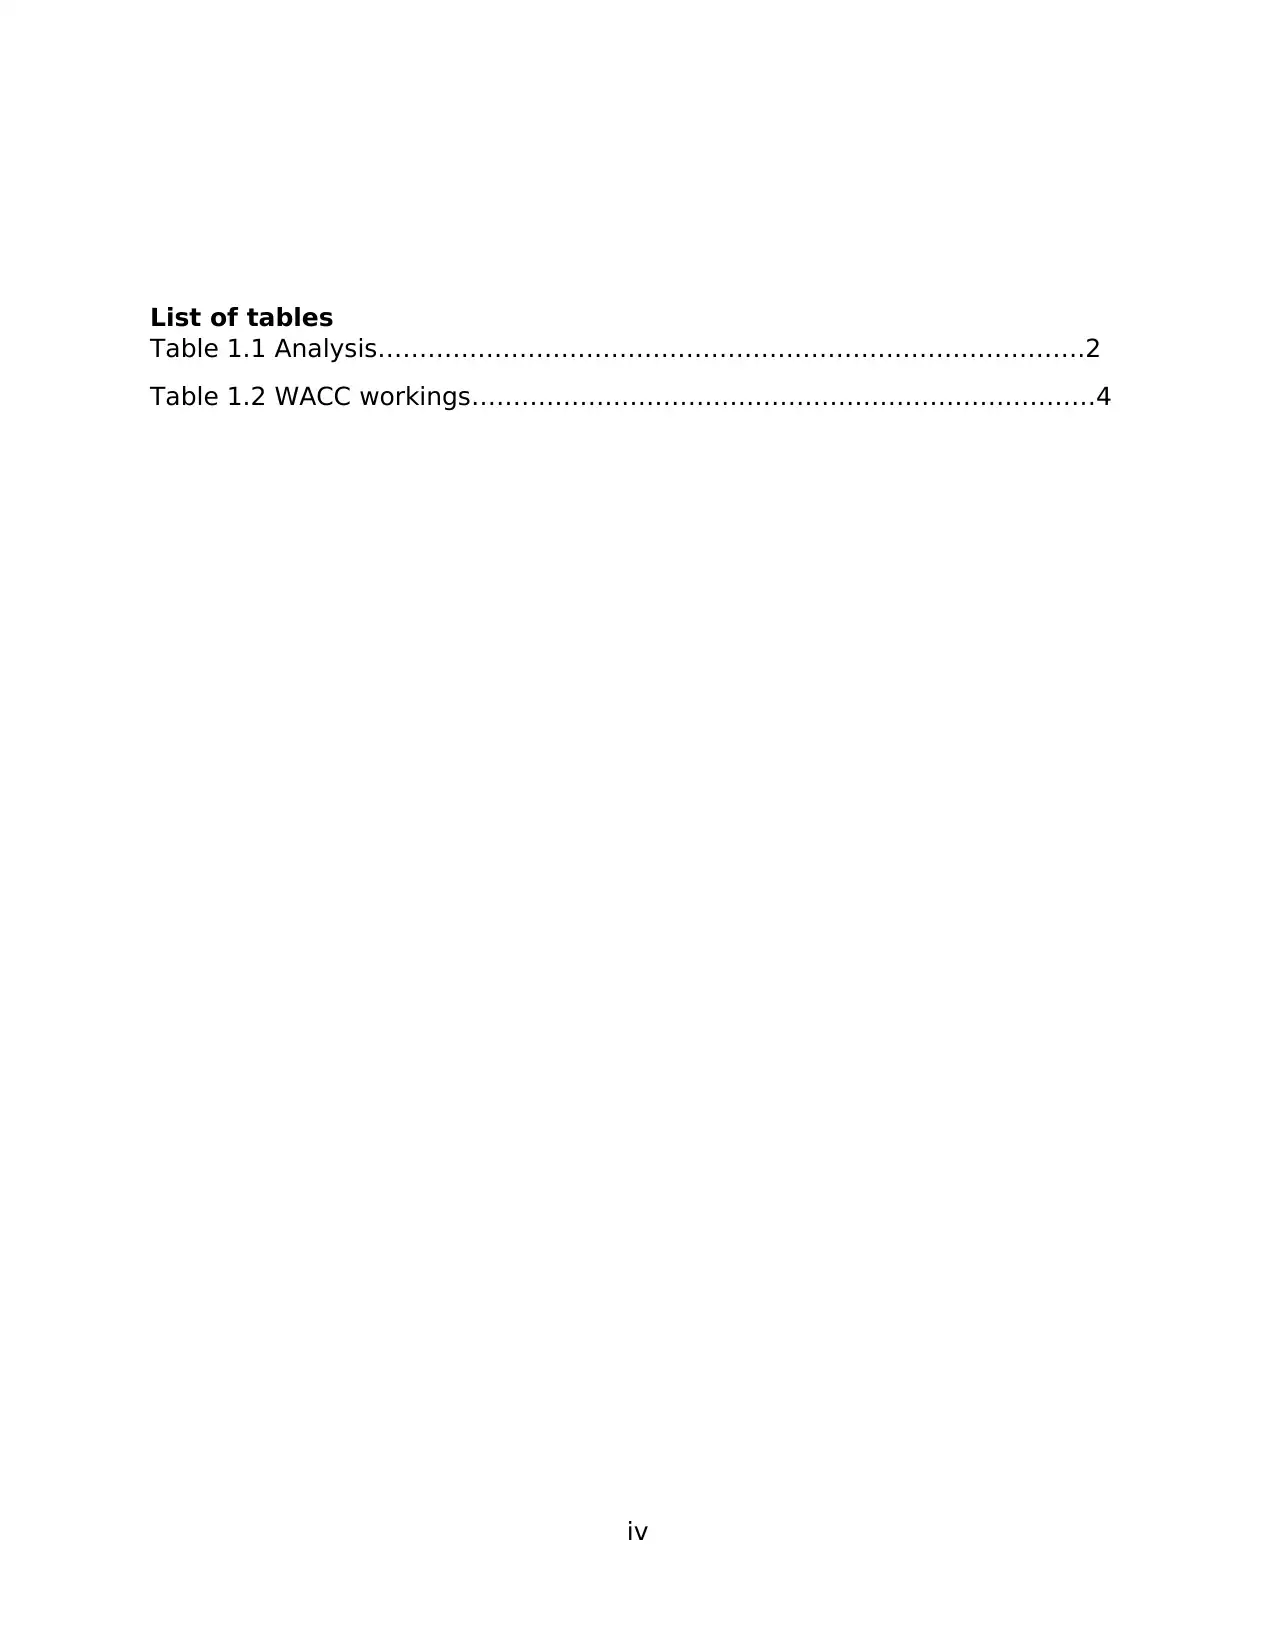
List of tables
Table 1.1 Analysis………………………………………………………………………….2
Table 1.2 WACC workings…………………………………………………………………4
iv
Table 1.1 Analysis………………………………………………………………………….2
Table 1.2 WACC workings…………………………………………………………………4
iv
Paraphrase This Document
Need a fresh take? Get an instant paraphrase of this document with our AI Paraphraser
1.0 Introduction
1.0.1 Corporate governance
Ownership separation and control in companies is a common thing in
modern day business atmosphere dependent on the number of firms listed in
the stock market exchange. Looking at the management structure of Seek
there is a separation between the owners and the top management. The
separation of the company’s management structure enables the
shareholders to be able to monitor the business and ensure that functions of
the business are running smoothly, this reduces the agency conflict.
(Fleming et al.,2005). The board size of Seek Ltd is optimal and the
composition are to be specifically categorized. According to Raheja (2006)
the board size and its composition should be made in an optimal way. The
management are responsible to report to the shareholders of the company
and provide adequate information, Seek Ltd has an independent director
independence policy that guarantees independence of the management and
thus there is for interference in the exercising of the objective judgement. As
disclosed the company ensures that the board of management reviews the
performance on a regular basis furthermore there is an appropriate policy on
appointment of new employees.
From the director’s composition the board has determined that none of the
directors should hold any relationships that possibly could interfere with the
independence to exercise their judgements. This ensure that there is no
potential conflict even with lenders of the firm as the company policy require
that none should have no relationship and any interest to avoid possible
conflicts that may arise in the exercising of their judgements. The company
also ensures that the directors are well remunerated but also ensure that
there is a cap to the maximum aggregate amount of fee that is payable to
the Non-Executive directors yearly, the amount was approved by the
shareholders in an AGM.
Access to information Seek introduced a continuous disclosure policy whose
main objective is to ensure that the leadership of the firm continuously
discloses sensitive information on the prices and complying with ASX listing
rules, this disclosure policy is reviewed annually by the management board.
Seek Ltd board of management has an ultimate responsibility of ensuring
that the firm complies with the continuous disclosure policy and obligations
determining whether confers with the ASX listing rules and the Act of the
Corporation Act, this ensures that the financial markets are notified of the on
the potentially price sensitive information without delay. The company also
has a Share trading Policy that seeks to provide guidance in dealings with
the media, external stakeholders and market analyst and complying always
to the obligations of disclosure.
2.1 Risk and return
There several risk profiles that impact Seek Ltd, these risks affect the
financial and the operating results of the company in one way or the other.
Seek ltd is exposed to several risks from factors internally to external factors.
Looking at the business models at the disposure the firm has adopted new
disruptive models of business that enable the company to be able to
compete the new entrants and preserve the market share or expand the
market share of the company. The company tries to mitigate the risk impact
through local and global monitoring of new and ever-changing trends. The
long interruptions in IT operations form a basis for cyber-attacks, the
company is trying to enhance the infrastructure to deal with the exposure. In
assessment of the risk capacity for individual risk profiles the firm must be
able to look at the combined factors that can be observed by a financial
advisor and be capture through a risk assessment tool (Hanna, et al, 2008).
Looking at the measures that are key to measuring performance we look at
the most crucial ratios in that can depict the general dealing made by a
commercial entity, where, investments are done, operational activities and
funds from both external sources and internal sources are well managed. It is
possible to stem both the equity returns and returns generated from the
capital employed. The analysis of the financial data is mainly based on
looking at financial reports and accounting information since the task of
examining, arbitrating and controlling a firm’s activities are far wider and
tougher than the mere handling of reported financial information. Ultimately
the performance and worth of any corporate must be judged in financial
terms which is articulated in both cashflows and future flows of moneys that
is expected. (Helfert ,2003)
2.1.1 Analysis of the firm.
Table 1.1 Analysis
2018 2017
2
⊘ This is a preview!⊘
Do you want full access?
Subscribe today to unlock all pages.
Trusted by 1+ million students worldwide
Revenue 1310.000 1052.000
Cost of sales 0.000 0.000
EBIT 174.700 437.300
EAT 90.800 362.000
Total equity 1637.300 2039.900
Total assets 3785.800 3683.000
5423.100 5722.900
avg total assets 2711.550 2861.450
equity ratio 0.432 0.554
net profit or loss 90.800 362.000
profit margin % 7% 34%
Return on Total Asset 0.064 0.153
return on equity 0.055 0.177
Debts equity ratio 1.312 0.805
debt ratio 0.568 0.446
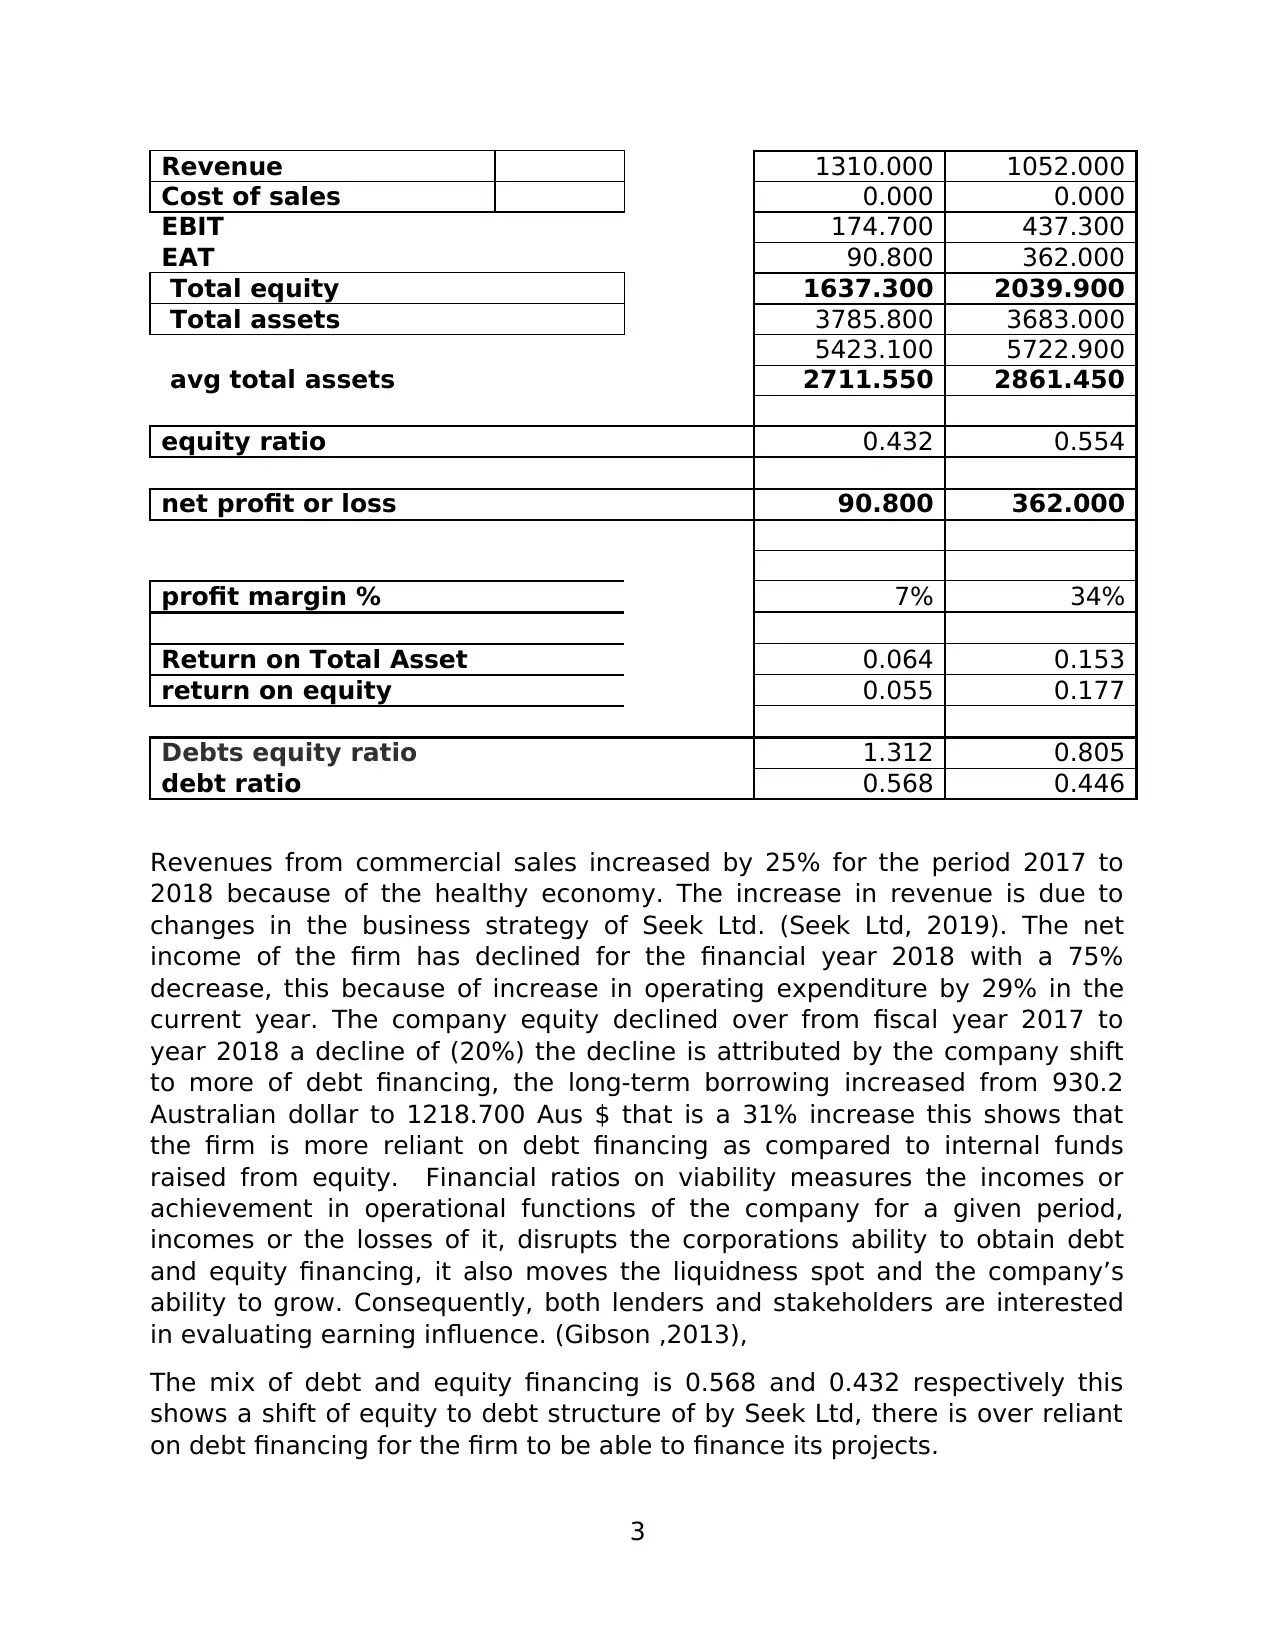
Revenues from commercial sales increased by 25% for the period 2017 to
2018 because of the healthy economy. The increase in revenue is due to
changes in the business strategy of Seek Ltd. (Seek Ltd, 2019). The net
income of the firm has declined for the financial year 2018 with a 75%
decrease, this because of increase in operating expenditure by 29% in the
current year. The company equity declined over from fiscal year 2017 to
year 2018 a decline of (20%) the decline is attributed by the company shift
to more of debt financing, the long-term borrowing increased from 930.2
Australian dollar to 1218.700 Aus $ that is a 31% increase this shows that
the firm is more reliant on debt financing as compared to internal funds
raised from equity. Financial ratios on viability measures the incomes or
achievement in operational functions of the company for a given period,
incomes or the losses of it, disrupts the corporations ability to obtain debt
and equity financing, it also moves the liquidness spot and the company’s
ability to grow. Consequently, both lenders and stakeholders are interested
in evaluating earning influence. (Gibson ,2013),
The mix of debt and equity financing is 0.568 and 0.432 respectively this
shows a shift of equity to debt structure of by Seek Ltd, there is over reliant
on debt financing for the firm to be able to finance its projects.
3
Cost of sales 0.000 0.000
EBIT 174.700 437.300
EAT 90.800 362.000
Total equity 1637.300 2039.900
Total assets 3785.800 3683.000
5423.100 5722.900
avg total assets 2711.550 2861.450
equity ratio 0.432 0.554
net profit or loss 90.800 362.000
profit margin % 7% 34%
Return on Total Asset 0.064 0.153
return on equity 0.055 0.177
Debts equity ratio 1.312 0.805
debt ratio 0.568 0.446
Revenues from commercial sales increased by 25% for the period 2017 to
2018 because of the healthy economy. The increase in revenue is due to
changes in the business strategy of Seek Ltd. (Seek Ltd, 2019). The net
income of the firm has declined for the financial year 2018 with a 75%
decrease, this because of increase in operating expenditure by 29% in the
current year. The company equity declined over from fiscal year 2017 to
year 2018 a decline of (20%) the decline is attributed by the company shift
to more of debt financing, the long-term borrowing increased from 930.2
Australian dollar to 1218.700 Aus $ that is a 31% increase this shows that
the firm is more reliant on debt financing as compared to internal funds
raised from equity. Financial ratios on viability measures the incomes or
achievement in operational functions of the company for a given period,
incomes or the losses of it, disrupts the corporations ability to obtain debt
and equity financing, it also moves the liquidness spot and the company’s
ability to grow. Consequently, both lenders and stakeholders are interested
in evaluating earning influence. (Gibson ,2013),
The mix of debt and equity financing is 0.568 and 0.432 respectively this
shows a shift of equity to debt structure of by Seek Ltd, there is over reliant
on debt financing for the firm to be able to finance its projects.
3
Paraphrase This Document
Need a fresh take? Get an instant paraphrase of this document with our AI Paraphraser
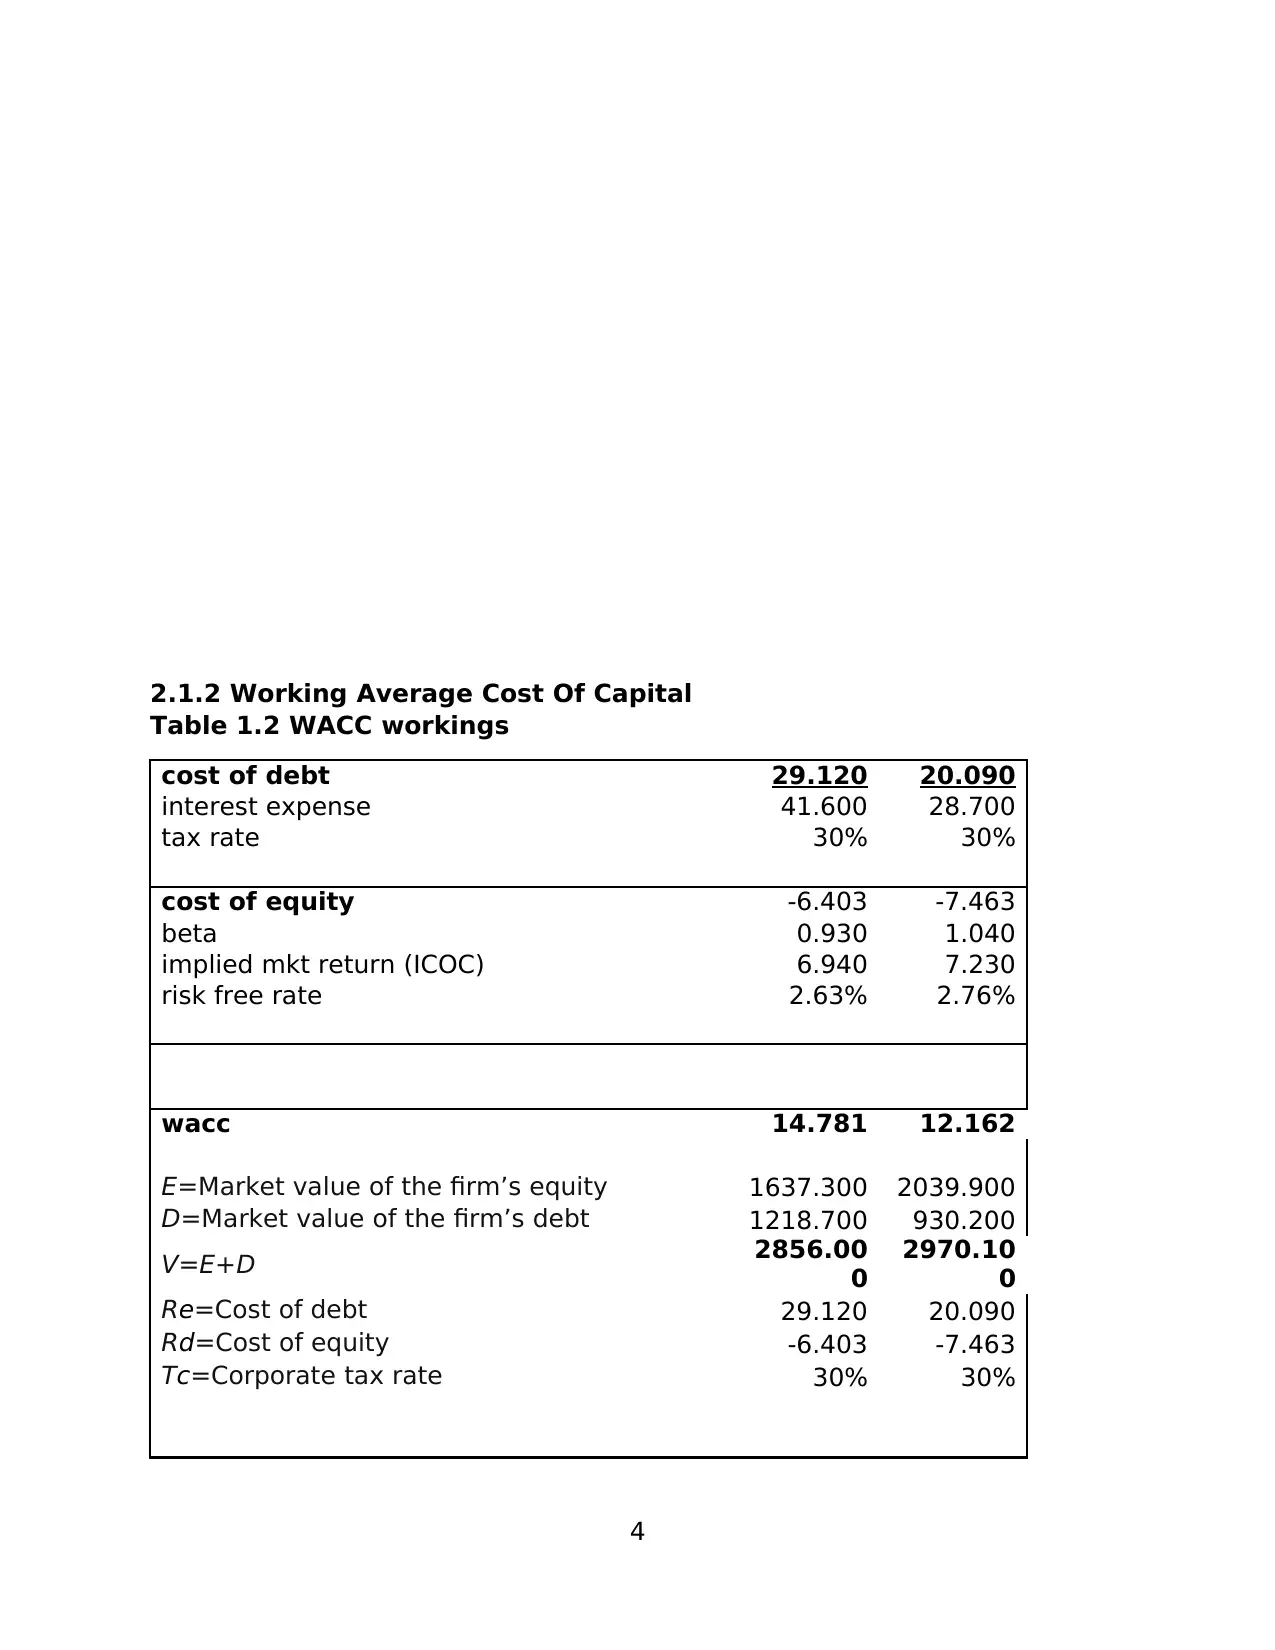
2.1.2 Working Average Cost Of Capital
Table 1.2 WACC workings
cost of debt 29.120 20.090
interest expense 41.600 28.700
tax rate 30% 30%
cost of equity -6.403 -7.463
beta 0.930 1.040
implied mkt return (ICOC) 6.940 7.230
risk free rate 2.63% 2.76%
wacc 14.781 12.162
E=Market value of the firm’s equity 1637.300 2039.900
D=Market value of the firm’s debt 1218.700 930.200
V=E+D 2856.00
0
2970.10
0
Re=Cost of debt 29.120 20.090
Rd=Cost of equity -6.403 -7.463
Tc=Corporate tax rate 30% 30%
4
The cost of capital is the choice that the firm selects for financing, thus it is a
very crucial variable to determining the appropriate capital structure. By
combining both equity and debt the company can have adequate funding
and that it is able to minimize the cost of capital. From 2017 to the year
2018 the cost of capital increased from 12.162 to 14.781, however much of
the market value of equity declined significantly and debt increased. The
cost of debt increased from 20.09 to 29.12 due the increase in the interest
expenses as SEEK ltd borrowings increased by 31%.
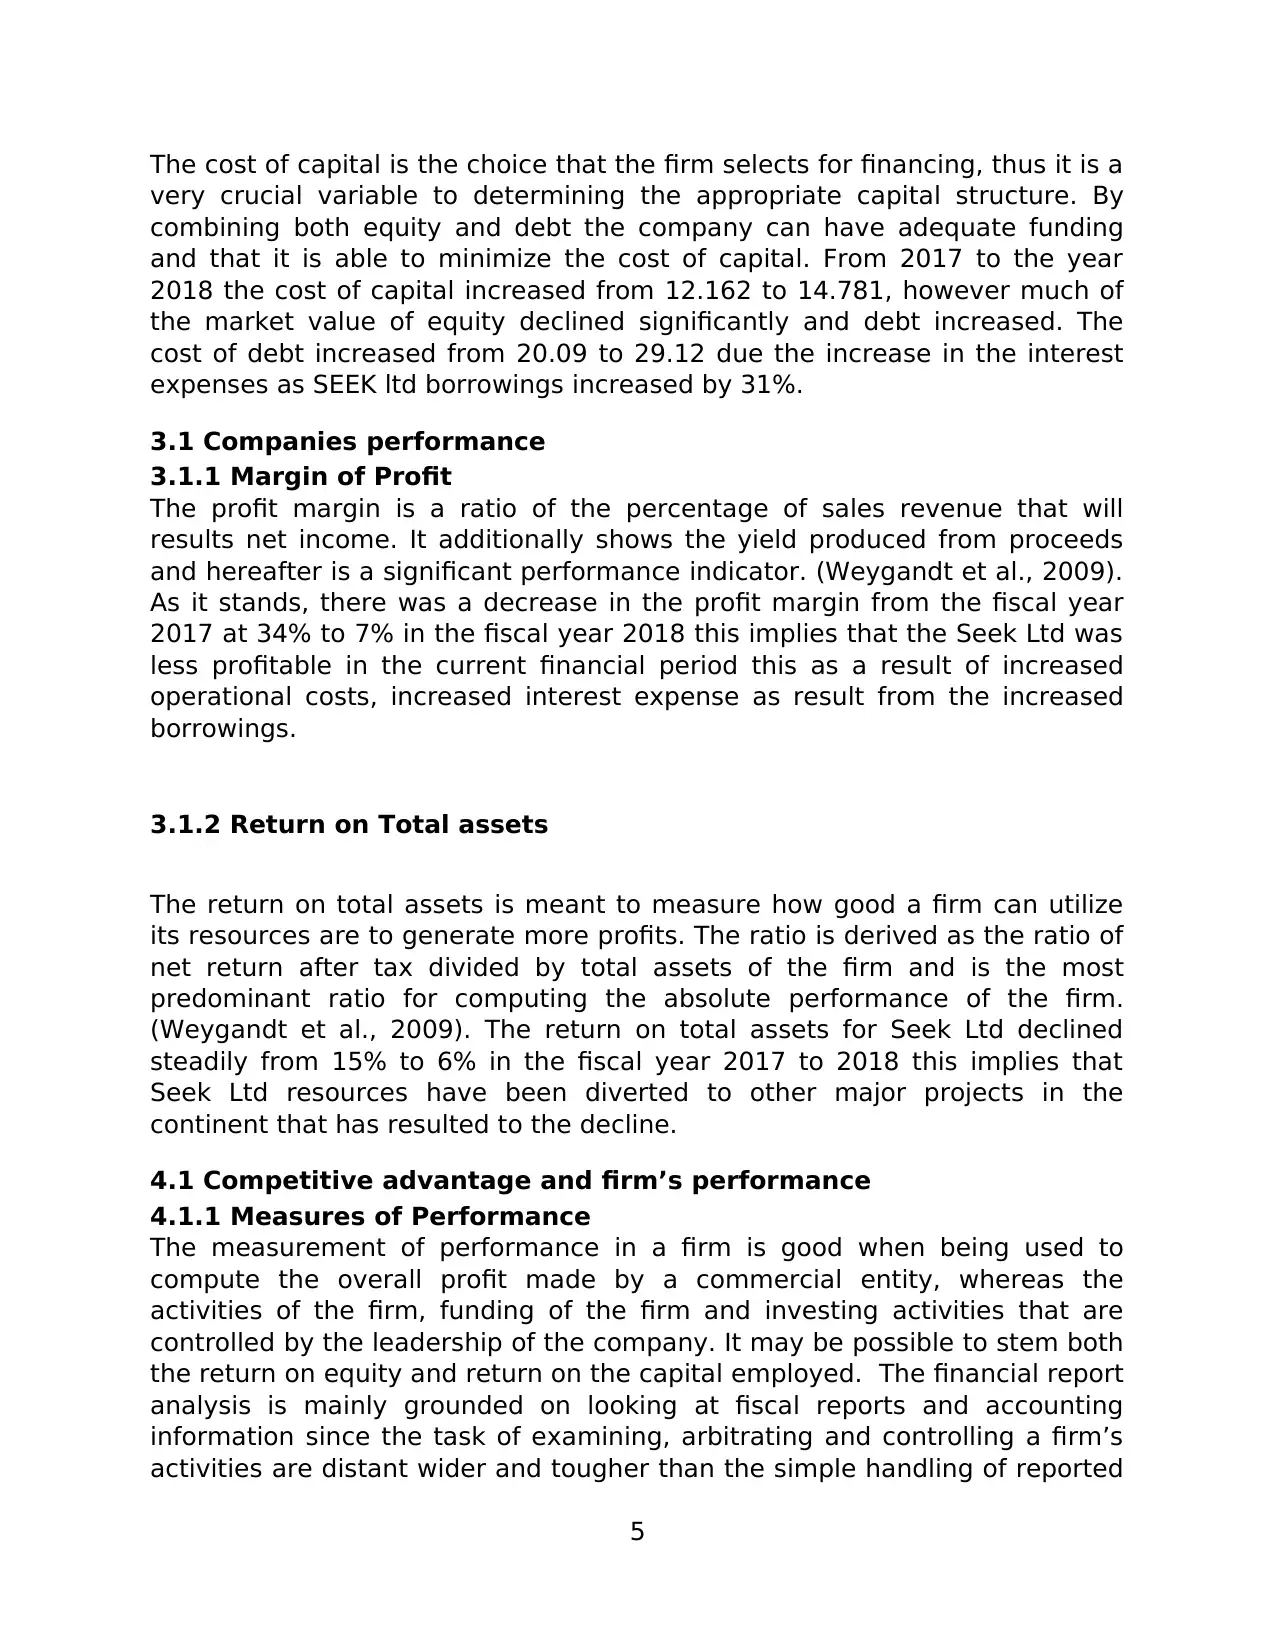
3.1 Companies performance
3.1.1 Margin of Profit
The profit margin is a ratio of the percentage of sales revenue that will
results net income. It additionally shows the yield produced from proceeds
and hereafter is a significant performance indicator. (Weygandt et al., 2009).
As it stands, there was a decrease in the profit margin from the fiscal year
2017 at 34% to 7% in the fiscal year 2018 this implies that the Seek Ltd was
less profitable in the current financial period this as a result of increased
operational costs, increased interest expense as result from the increased
borrowings.
3.1.2 Return on Total assets
The return on total assets is meant to measure how good a firm can utilize
its resources are to generate more profits. The ratio is derived as the ratio of
net return after tax divided by total assets of the firm and is the most
predominant ratio for computing the absolute performance of the firm.
(Weygandt et al., 2009). The return on total assets for Seek Ltd declined
steadily from 15% to 6% in the fiscal year 2017 to 2018 this implies that
Seek Ltd resources have been diverted to other major projects in the
continent that has resulted to the decline.
4.1 Competitive advantage and firm’s performance
4.1.1 Measures of Performance
The measurement of performance in a firm is good when being used to
compute the overall profit made by a commercial entity, whereas the
activities of the firm, funding of the firm and investing activities that are
controlled by the leadership of the company. It may be possible to stem both
the return on equity and return on the capital employed. The financial report
analysis is mainly grounded on looking at fiscal reports and accounting
information since the task of examining, arbitrating and controlling a firm’s
activities are distant wider and tougher than the simple handling of reported
5
very crucial variable to determining the appropriate capital structure. By
combining both equity and debt the company can have adequate funding
and that it is able to minimize the cost of capital. From 2017 to the year
2018 the cost of capital increased from 12.162 to 14.781, however much of
the market value of equity declined significantly and debt increased. The
cost of debt increased from 20.09 to 29.12 due the increase in the interest
expenses as SEEK ltd borrowings increased by 31%.
3.1 Companies performance
3.1.1 Margin of Profit
The profit margin is a ratio of the percentage of sales revenue that will
results net income. It additionally shows the yield produced from proceeds
and hereafter is a significant performance indicator. (Weygandt et al., 2009).
As it stands, there was a decrease in the profit margin from the fiscal year
2017 at 34% to 7% in the fiscal year 2018 this implies that the Seek Ltd was
less profitable in the current financial period this as a result of increased
operational costs, increased interest expense as result from the increased
borrowings.
3.1.2 Return on Total assets
The return on total assets is meant to measure how good a firm can utilize
its resources are to generate more profits. The ratio is derived as the ratio of
net return after tax divided by total assets of the firm and is the most
predominant ratio for computing the absolute performance of the firm.
(Weygandt et al., 2009). The return on total assets for Seek Ltd declined
steadily from 15% to 6% in the fiscal year 2017 to 2018 this implies that
Seek Ltd resources have been diverted to other major projects in the
continent that has resulted to the decline.
4.1 Competitive advantage and firm’s performance
4.1.1 Measures of Performance
The measurement of performance in a firm is good when being used to
compute the overall profit made by a commercial entity, whereas the
activities of the firm, funding of the firm and investing activities that are
controlled by the leadership of the company. It may be possible to stem both
the return on equity and return on the capital employed. The financial report
analysis is mainly grounded on looking at fiscal reports and accounting
information since the task of examining, arbitrating and controlling a firm’s
activities are distant wider and tougher than the simple handling of reported
5
⊘ This is a preview!⊘
Do you want full access?
Subscribe today to unlock all pages.
Trusted by 1+ million students worldwide
reports. (Helfert ,2003). Ultimately the financial performance and value of
any company is evaluated on financial grounds that is articulated in both
cashflows and future flows of cash.
It is important to analyze the cashflow statement and the possible changes
in overall assets and liabilities values that arises from financing activities
have been fully disclosed, shows the changes in the acquisitions and
exchanges.
5.1 Firms financing structure
According to Sinha (2012) he defines debt to equity ratio any credits that is
attributed to equity owners. Looking at Seek Ltd its ratio of debt has
increased significantly over the fiscal period from 0.446 in 2017 to 0.568 in
2018 this is as a result of the firm deciding to source more capital from debt,
the change to debt as a source of financing for the business operations
exposes the firm to financial risks. Also, the debt to equity ratio increased
from 0.805 to 1.312 this is as effect of Seek Ltd inducing more funds from
debt financing.
The company relies on long term debts this in return exposes Seek Ltd to the
impact of interest rate fluctuations and forex fluctuations in the market. The
fair value of its debt obligation in 2017 totaled A $ 930M compared to A $
1218.7M in 2018. The net increase in debt in the fiscal year 2018 was
primarily due to the reduction equity capital up from A $251M to A $269M in
the previous fiscal year, this shows that the firm was shifting its reliance
more on external financing as compared to internal financing. This increases
the financial risk exposure of the firm in terms of the interest rate risk, thus
the fluctuations in risk can impact the group results greatly.
The debt to equity ratio further discloses that the group uses more of debt to
finance its operations as compared to equity. Seek Ltd creates a hedge that
is natural through matching debt with underlying local currency earning
together with the investments, in circumstances where the natural hedge is
not possible the company creates a debt that is synthetic through use of
currency swaps to be able to hedge some underlying balance sheet
exposures and earnings. Further analysis into the firm financial structure it
shows the firm is dependent on more of debt financing.
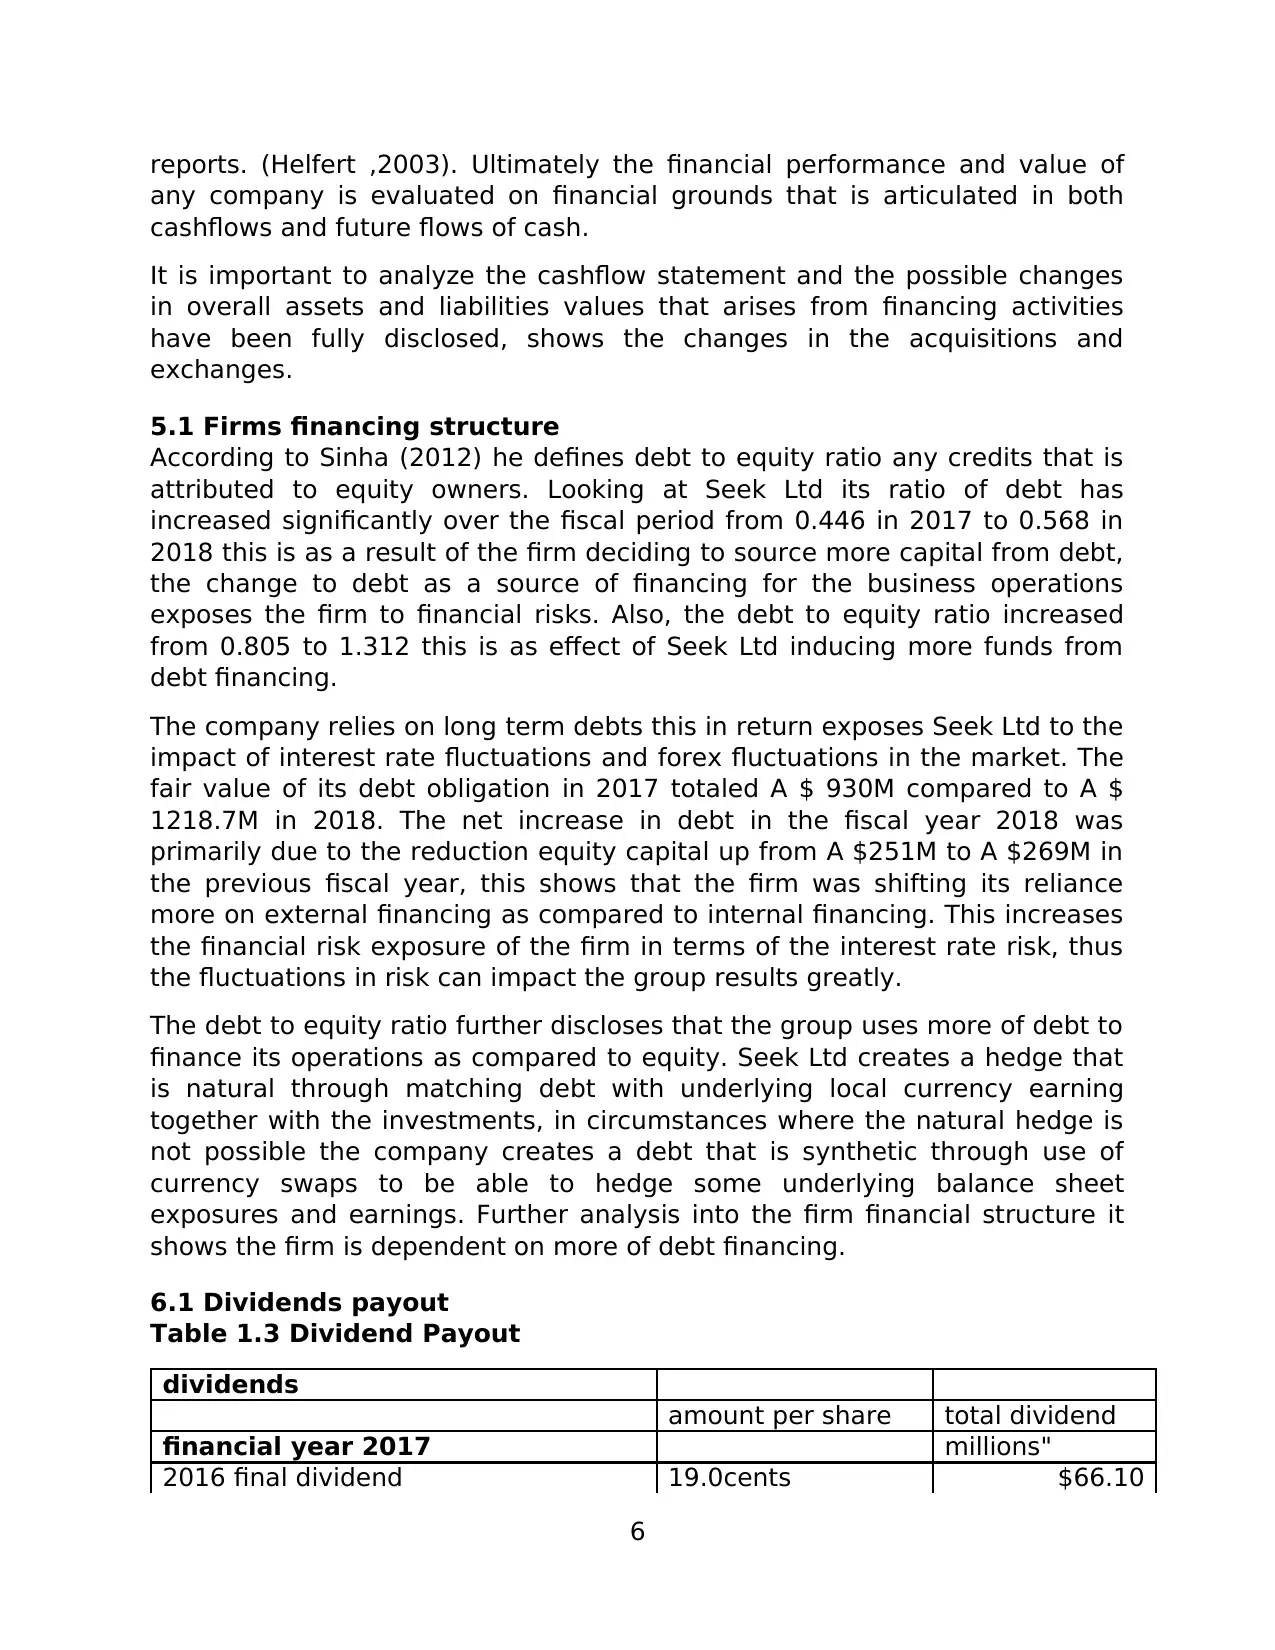
6.1 Dividends payout
Table 1.3 Dividend Payout
dividends
amount per share total dividend
financial year 2017 millions"
2016 final dividend 19.0cents $66.10
6
any company is evaluated on financial grounds that is articulated in both
cashflows and future flows of cash.
It is important to analyze the cashflow statement and the possible changes
in overall assets and liabilities values that arises from financing activities
have been fully disclosed, shows the changes in the acquisitions and
exchanges.
5.1 Firms financing structure
According to Sinha (2012) he defines debt to equity ratio any credits that is
attributed to equity owners. Looking at Seek Ltd its ratio of debt has
increased significantly over the fiscal period from 0.446 in 2017 to 0.568 in
2018 this is as a result of the firm deciding to source more capital from debt,
the change to debt as a source of financing for the business operations
exposes the firm to financial risks. Also, the debt to equity ratio increased
from 0.805 to 1.312 this is as effect of Seek Ltd inducing more funds from
debt financing.
The company relies on long term debts this in return exposes Seek Ltd to the
impact of interest rate fluctuations and forex fluctuations in the market. The
fair value of its debt obligation in 2017 totaled A $ 930M compared to A $
1218.7M in 2018. The net increase in debt in the fiscal year 2018 was
primarily due to the reduction equity capital up from A $251M to A $269M in
the previous fiscal year, this shows that the firm was shifting its reliance
more on external financing as compared to internal financing. This increases
the financial risk exposure of the firm in terms of the interest rate risk, thus
the fluctuations in risk can impact the group results greatly.
The debt to equity ratio further discloses that the group uses more of debt to
finance its operations as compared to equity. Seek Ltd creates a hedge that
is natural through matching debt with underlying local currency earning
together with the investments, in circumstances where the natural hedge is
not possible the company creates a debt that is synthetic through use of
currency swaps to be able to hedge some underlying balance sheet
exposures and earnings. Further analysis into the firm financial structure it
shows the firm is dependent on more of debt financing.
6.1 Dividends payout
Table 1.3 Dividend Payout
dividends
amount per share total dividend
financial year 2017 millions"
2016 final dividend 19.0cents $66.10
6
Paraphrase This Document
Need a fresh take? Get an instant paraphrase of this document with our AI Paraphraser
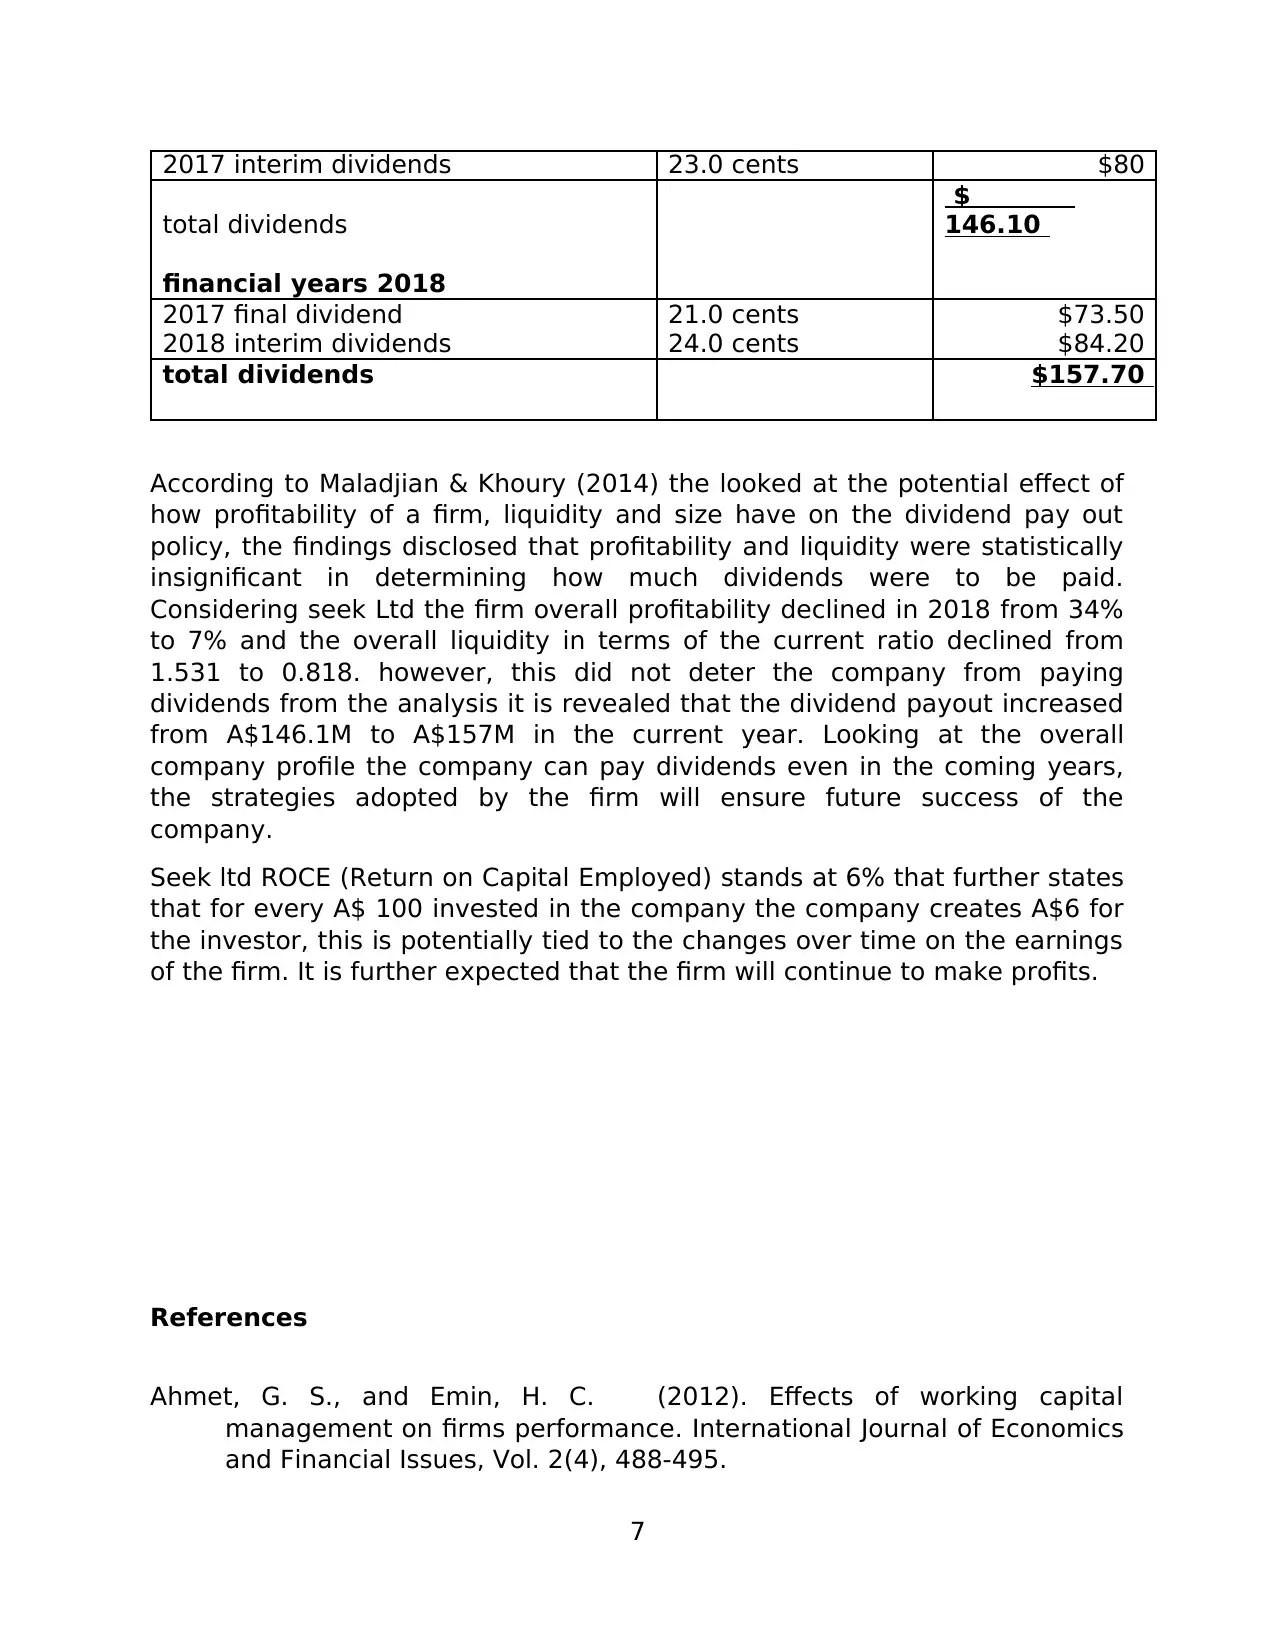
2017 interim dividends 23.0 cents $80
total dividends
$
146.10
financial years 2018
2017 final dividend 21.0 cents $73.50
2018 interim dividends 24.0 cents $84.20
total dividends $157.70
According to Maladjian & Khoury (2014) the looked at the potential effect of
how profitability of a firm, liquidity and size have on the dividend pay out
policy, the findings disclosed that profitability and liquidity were statistically
insignificant in determining how much dividends were to be paid.
Considering seek Ltd the firm overall profitability declined in 2018 from 34%
to 7% and the overall liquidity in terms of the current ratio declined from
1.531 to 0.818. however, this did not deter the company from paying
dividends from the analysis it is revealed that the dividend payout increased
from A$146.1M to A$157M in the current year. Looking at the overall
company profile the company can pay dividends even in the coming years,
the strategies adopted by the firm will ensure future success of the
company.
Seek ltd ROCE (Return on Capital Employed) stands at 6% that further states
that for every A$ 100 invested in the company the company creates A$6 for
the investor, this is potentially tied to the changes over time on the earnings
of the firm. It is further expected that the firm will continue to make profits.
References
Ahmet, G. S., and Emin, H. C. (2012). Effects of working capital
management on firms performance. International Journal of Economics
and Financial Issues, Vol. 2(4), 488-495.
7
Fleming, G., Heaney, R., & McCosker, R. (2005). Agency Cost and Ownership
Structure in Australia, Pacific-Basin Finance Journal 13, 29-52
Gibson, S. and Charles, H. (2013). Financial Statement Analysis. South-
Western Cengage Learning, 13th Edition.
Hanna, S.D., Waller, W. and Finke, M. (2008). The concept of risk tolerance in
personal financial planning. Journal of Personal Finance, 7(1), 96-108.
doi: 10.2139/ssrn.1923409
Helfert, Erich A. (2003). Techniques of Financial Analysis: A Guide to Value
Creation. McGraw Hill, 11th Edition.
Maladjian, C and Khoury, ER. (2014) ‘Determinants of the Dividend Policy: An
Empirical Study on the Lebanese Listed Banks,’ International Journal of
Economics and Finance, 6(4), 240-256.
Raheja, C. G., 2006, Determinants of Board Size and Composition: A Theory
of Corporate Boards, Journal of Financial and Quantitative Analysis,
40(2): 283-306.
Sinha, G. (2012), In: Ghosh AK, editor. Financial Statement Analysis. Eastern
Economy Edition. New York: Prentice Hall of India Private Limited.
Weygandt, Jerry J., Donlad E. Kieso, Kimmel P. D. (2009). Accounting
Principles. 9th. Edition, John Wiley & Inc
Appendices
Appendix 1 Income statement
8
⊘ This is a preview!⊘
Do you want full access?
Subscribe today to unlock all pages.
Trusted by 1+ million students worldwide
1 out of 17
Related Documents


Your All-in-One AI-Powered Toolkit for Academic Success.
+13062052269
info@desklib.com
Available 24*7 on WhatsApp / Email
![[object Object]](/_next/static/media/star-bottom.7253800d.svg)
Unlock your academic potential
Copyright © 2020–2026 A2Z Services. All Rights Reserved. Developed and managed by ZUCOL.