Asia Pacific College: Sensitivity Analysis in Project Development
VerifiedAdded on 2023/06/10
|21
|3636
|395
Report
AI Summary
This report presents a sensitivity analysis conducted for Futuristic Construction Pty Ltd.'s New Sydney Atrium Mall project, focusing on the project's economic viability under varying economic conditions. The analysis identifies key variables such as revenue from parking lot fees and examines the impact of best, neutral, and worst-case economic scenarios on the project's Net Present Value (NPV) and Internal Rate of Return (IRR). Break-even analysis is performed for each scenario to determine the point at which the project becomes profitable. The report concludes with an evaluation of the project's overall feasibility and provides insights for decision-making, emphasizing the importance of considering potential risks and uncertainties. The analysis uses data provided by NSW Investment Corporation and considers factors like construction costs, loan payments, and revenue sharing agreements to assess the project's financial performance under different circumstances.
Contents
INTRODUCTION............................................................................................................................................................................................2
IDENTIFIED THE KEY VARIABLES –.......................................................................................................................................................4
INVESTIGATION OF RESULT OF PROBABLE ADVERSE CHANGES –...............................................................................................5
FOR DECISION MAKING AND EVALUATION OF PROJECT –.............................................................................................................5
SENSITIVITY ANALYSIS OF THE COMPANY –......................................................................................................................................6
ORIGINAL COST AND BENEFIT OF THE PROJECT -.............................................................................................................................6
ECONOMIC CONDITION WISE ANALYSIS:.............................................................................................................................................8
BEST ECONOMIC CONDITION VALUATIONS -......................................................................................................................................8
BREAK EVEN ANALYSIS -..........................................................................................................................................................................9
NEUTRAL ECONOMIC CONDITION:.......................................................................................................................................................10
BREAK EVEN ANALYSIS -........................................................................................................................................................................11
Worst Economic Condition -..........................................................................................................................................................................13
BREAK EVEN ANALYSIS -........................................................................................................................................................................13
ANALYSIS –.................................................................................................................................................................................................14
ANALYSIS OF BEST ECONOMIC CONDITIONS –.................................................................................................................................15
ANALYSIS OF NEUTRAL ECONOMIC CONDITIONS –........................................................................................................................15
Paraphrase This Document
Need a fresh take? Get an instant paraphrase of this document with our AI Paraphraser
ANALYSIS OF WORST ECONOMIC CONDITIONS –............................................................................................................................15
CONCLUSION..............................................................................................................................................................................................16
REFERENCE –..............................................................................................................................................................................................17
INTRODUCTION
Futuristic Construction Pty Ltd. has won the bid for the construction of the New Sydney Atrium Mall. The mall will be constructed by
Futuristic Co. under a Design-Bid-Build basis for NSW Investment Corporation, a venture of the NSW Government formed along the
lines of the Queensland Investment Corporation. As a result, Futuristic Co. has projected the costs of building and transferring the project
at $ 1 , 54 , 640.00 . Upon the completion of the building phase of the project ( January 2018- December 2018), the ownership of the
Mall will be transferred a 100% to NSW Investment Corporation. According to the contract, the highest amount that the NSW
Investment Corporation would be willing to pay is 1,20,000 during the build phase of the project. In addition to this, the NSW will offer
33% of the Pre-tax revenues accrued from the parking lot of the mall in the form of parking lot fees. This revenue sharing will continue
for five years, beginning in the first year of the operation of the mall. The tentative date for the operation of the mall is 1st January 2019.
Futuristic construction must obtain a loan in order to fulfil the deficit that would occur during the construction phase of the project.
According to Futuristic, the loan payment will be a recurring cost that Futuristic Co. will have to incur during the next five years.
However, the revenues collected from the parking lot will be more than sufficient , not only to be able to pay off the recurring costs but
also, to make the project economically viable. This report contains a sensitivity analysis to understand the viability of the project.
SENSITIVITY ANALYSIS
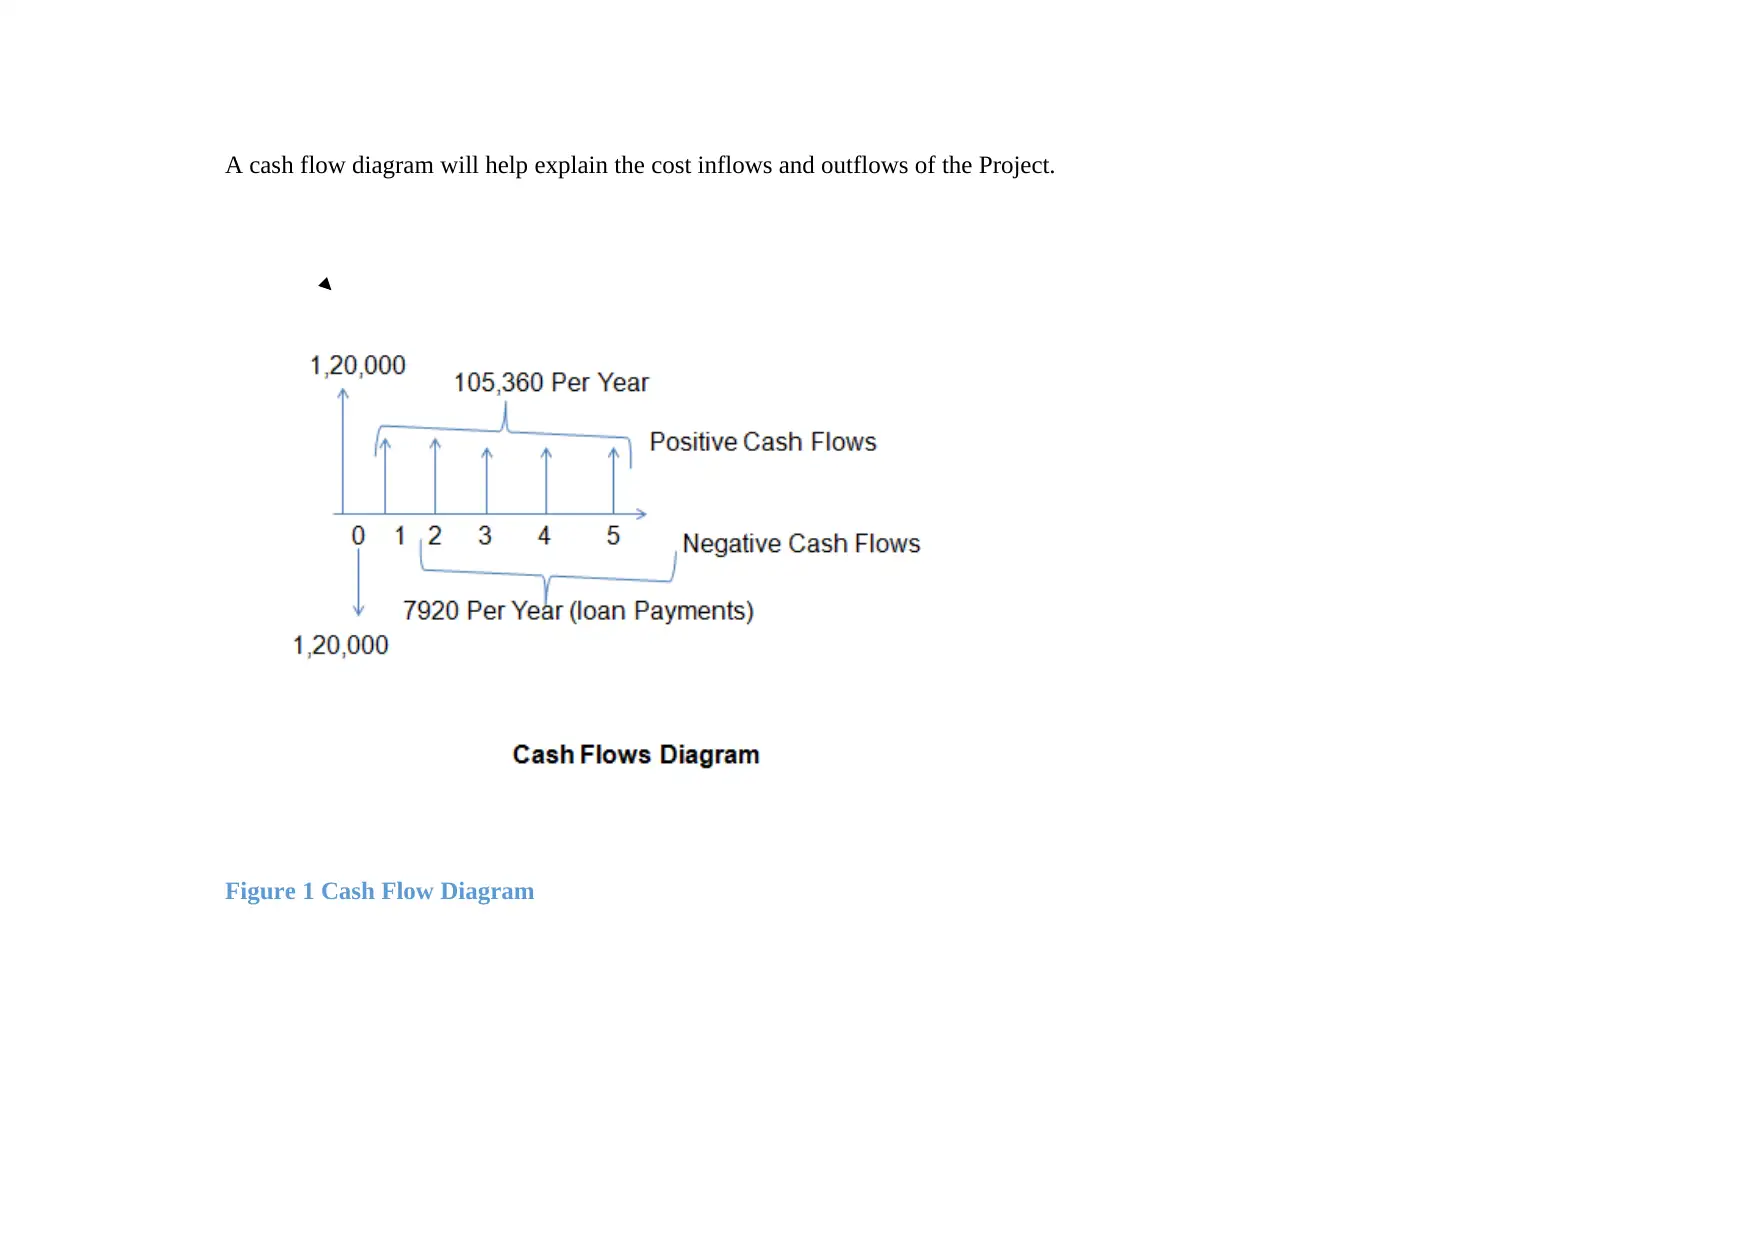
A cash flow diagram will help explain the cost inflows and outflows of the Project.
Figure 1 Cash Flow Diagram
Figure 1 Cash Flow Diagram
⊘ This is a preview!⊘
Do you want full access?
Subscribe today to unlock all pages.
Trusted by 1+ million students worldwide
The financial and economic benefit for cost analysis of investment project is based on forecast of quantifiable variables based on the
approximately predicted forecast the value of these variables estimated and which cover a long time of period. The value of these
variables for the most probable outcomes scenario or influenced by a great number of factors and the real value can be differ
considerably from forecasted value depending on future development. The main purpose of the sensitivity analysis is to investigate the
effect of the changes in project variable on forecasted based lines. It helps into following purposes –
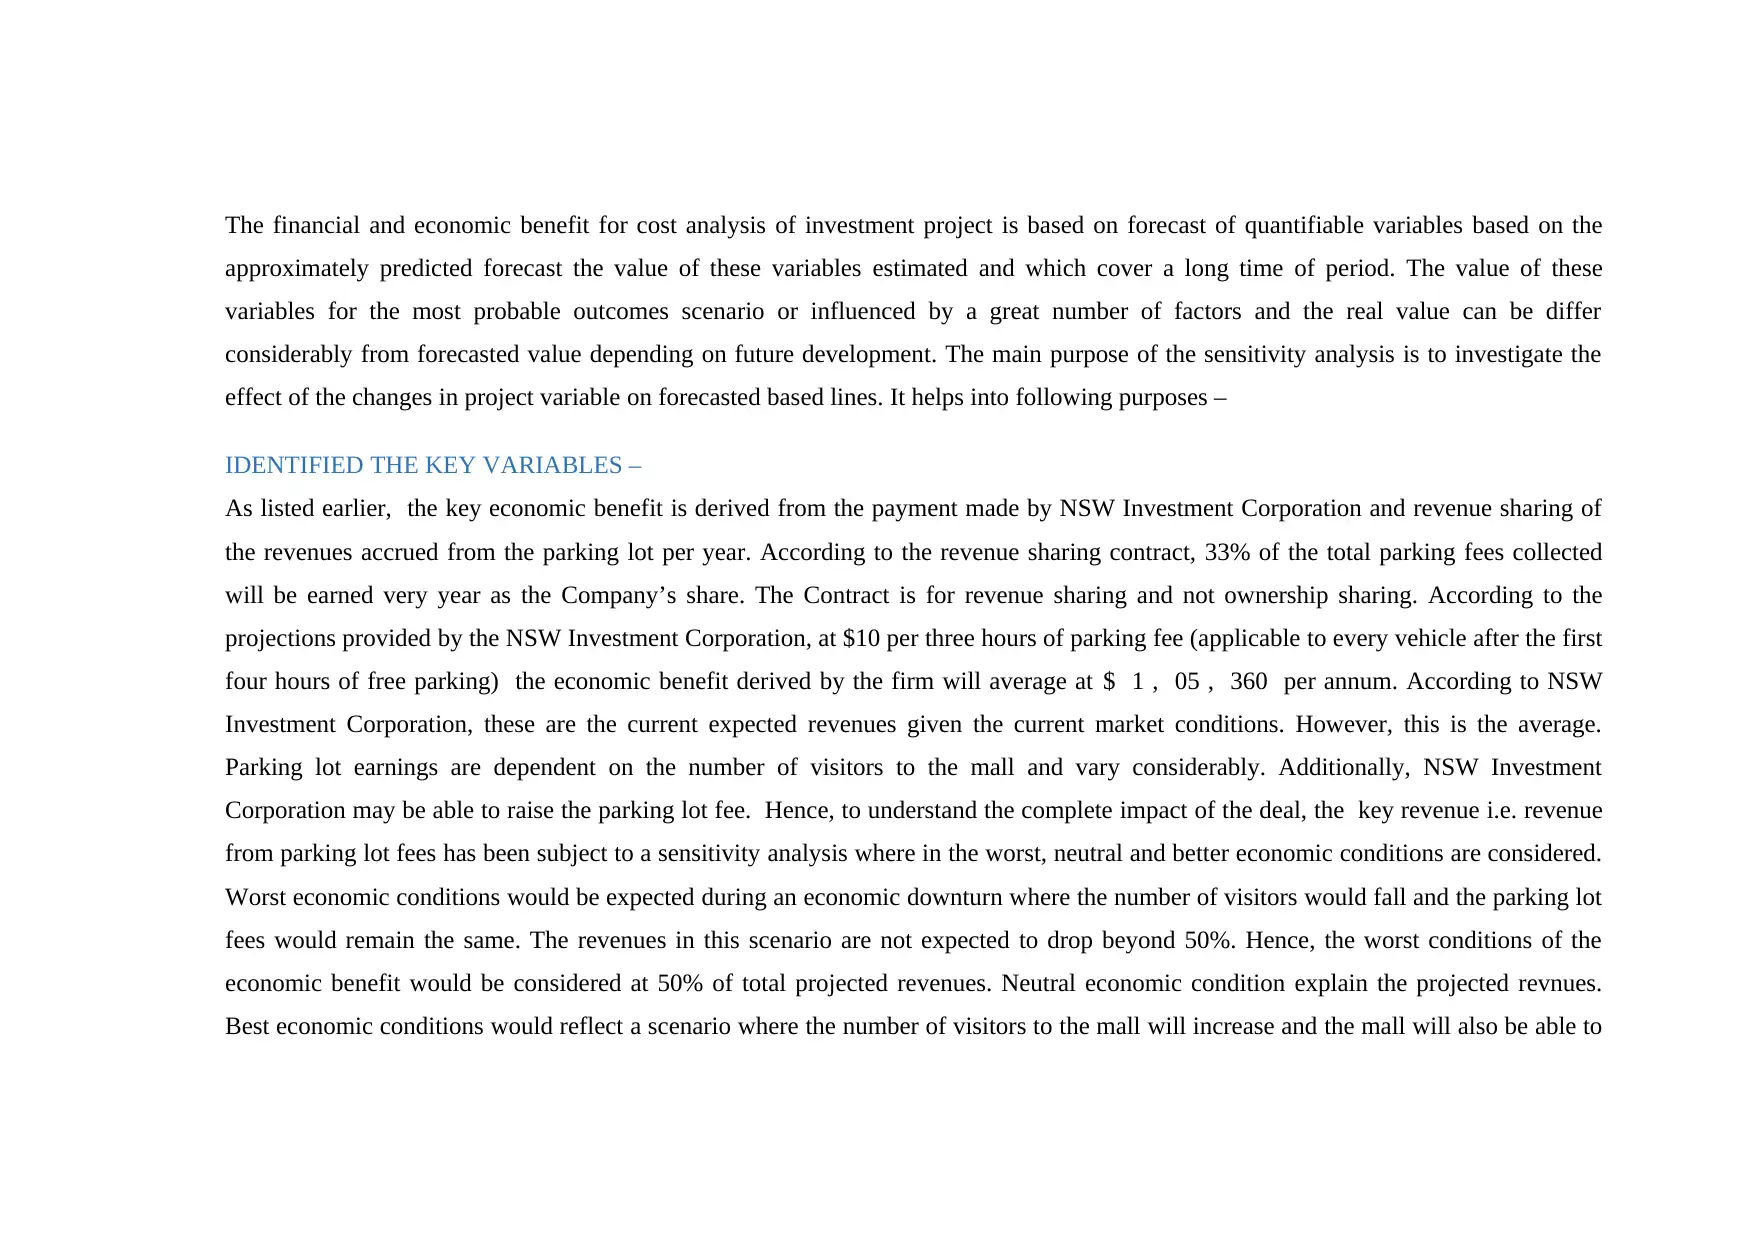
IDENTIFIED THE KEY VARIABLES –
As listed earlier, the key economic benefit is derived from the payment made by NSW Investment Corporation and revenue sharing of
the revenues accrued from the parking lot per year. According to the revenue sharing contract, 33% of the total parking fees collected
will be earned very year as the Company’s share. The Contract is for revenue sharing and not ownership sharing. According to the
projections provided by the NSW Investment Corporation, at $10 per three hours of parking fee (applicable to every vehicle after the first
four hours of free parking) the economic benefit derived by the firm will average at $ 1 , 05 , 360 per annum. According to NSW
Investment Corporation, these are the current expected revenues given the current market conditions. However, this is the average.
Parking lot earnings are dependent on the number of visitors to the mall and vary considerably. Additionally, NSW Investment
Corporation may be able to raise the parking lot fee. Hence, to understand the complete impact of the deal, the key revenue i.e. revenue
from parking lot fees has been subject to a sensitivity analysis where in the worst, neutral and better economic conditions are considered.
Worst economic conditions would be expected during an economic downturn where the number of visitors would fall and the parking lot
fees would remain the same. The revenues in this scenario are not expected to drop beyond 50%. Hence, the worst conditions of the
economic benefit would be considered at 50% of total projected revenues. Neutral economic condition explain the projected revnues.
Best economic conditions would reflect a scenario where the number of visitors to the mall will increase and the mall will also be able to
approximately predicted forecast the value of these variables estimated and which cover a long time of period. The value of these
variables for the most probable outcomes scenario or influenced by a great number of factors and the real value can be differ
considerably from forecasted value depending on future development. The main purpose of the sensitivity analysis is to investigate the
effect of the changes in project variable on forecasted based lines. It helps into following purposes –
IDENTIFIED THE KEY VARIABLES –
As listed earlier, the key economic benefit is derived from the payment made by NSW Investment Corporation and revenue sharing of
the revenues accrued from the parking lot per year. According to the revenue sharing contract, 33% of the total parking fees collected
will be earned very year as the Company’s share. The Contract is for revenue sharing and not ownership sharing. According to the
projections provided by the NSW Investment Corporation, at $10 per three hours of parking fee (applicable to every vehicle after the first
four hours of free parking) the economic benefit derived by the firm will average at $ 1 , 05 , 360 per annum. According to NSW
Investment Corporation, these are the current expected revenues given the current market conditions. However, this is the average.
Parking lot earnings are dependent on the number of visitors to the mall and vary considerably. Additionally, NSW Investment
Corporation may be able to raise the parking lot fee. Hence, to understand the complete impact of the deal, the key revenue i.e. revenue
from parking lot fees has been subject to a sensitivity analysis where in the worst, neutral and better economic conditions are considered.
Worst economic conditions would be expected during an economic downturn where the number of visitors would fall and the parking lot
fees would remain the same. The revenues in this scenario are not expected to drop beyond 50%. Hence, the worst conditions of the
economic benefit would be considered at 50% of total projected revenues. Neutral economic condition explain the projected revnues.
Best economic conditions would reflect a scenario where the number of visitors to the mall will increase and the mall will also be able to
Paraphrase This Document
Need a fresh take? Get an instant paraphrase of this document with our AI Paraphraser
increase the parking lot fees. Under any scenario, the revenues are not expected to be more than 200% of the projections. Hence, 200% is
considered as the best case scenario.
INVESTIGATION OF RESULT OF PROBABLE ADVERSE CHANGES –
To investigate the result of probable adverse changes in the key variables are so much important its purpose in sensitivity analysis is to
find the correct variable numbers on different economic condition for the project which gives the actual number of project analysis for
the sensitivity analysis and make the correct decision making.
FOR DECISION MAKING AND EVALUATION OF PROJECT –
For the decision making sensitivity analysis is used and decision maker and senior manager to find the variance of the cost benefit of the
project on different economic condition of the project and economy. So that if we will help them to make a plan in advance for the
preparation of adverse economic condition for the project.
In the sensitivity analysis we can find the value of project and cash inflows and out flows in different economic condition and the
decision makers are able to generate the correct and different net present value and internal rate of return of the project and different
phase of the economy and project. This ultimately helps decision makers and higher management to find out the easiest and correct way
of evaluation of the project and they are able to find that project should be accepted or project should not be accepted. Sensitivity analysis
usually impacts the cash inflows and benefit of the company because cost are mostly similar in all economic conditions of the project
duration. This helps into calculation of net correct value of the project and what could be the highest required rate of return for the
investors to IRR.
SENSITIVITY ANALYSIS OF THE COMPANY –
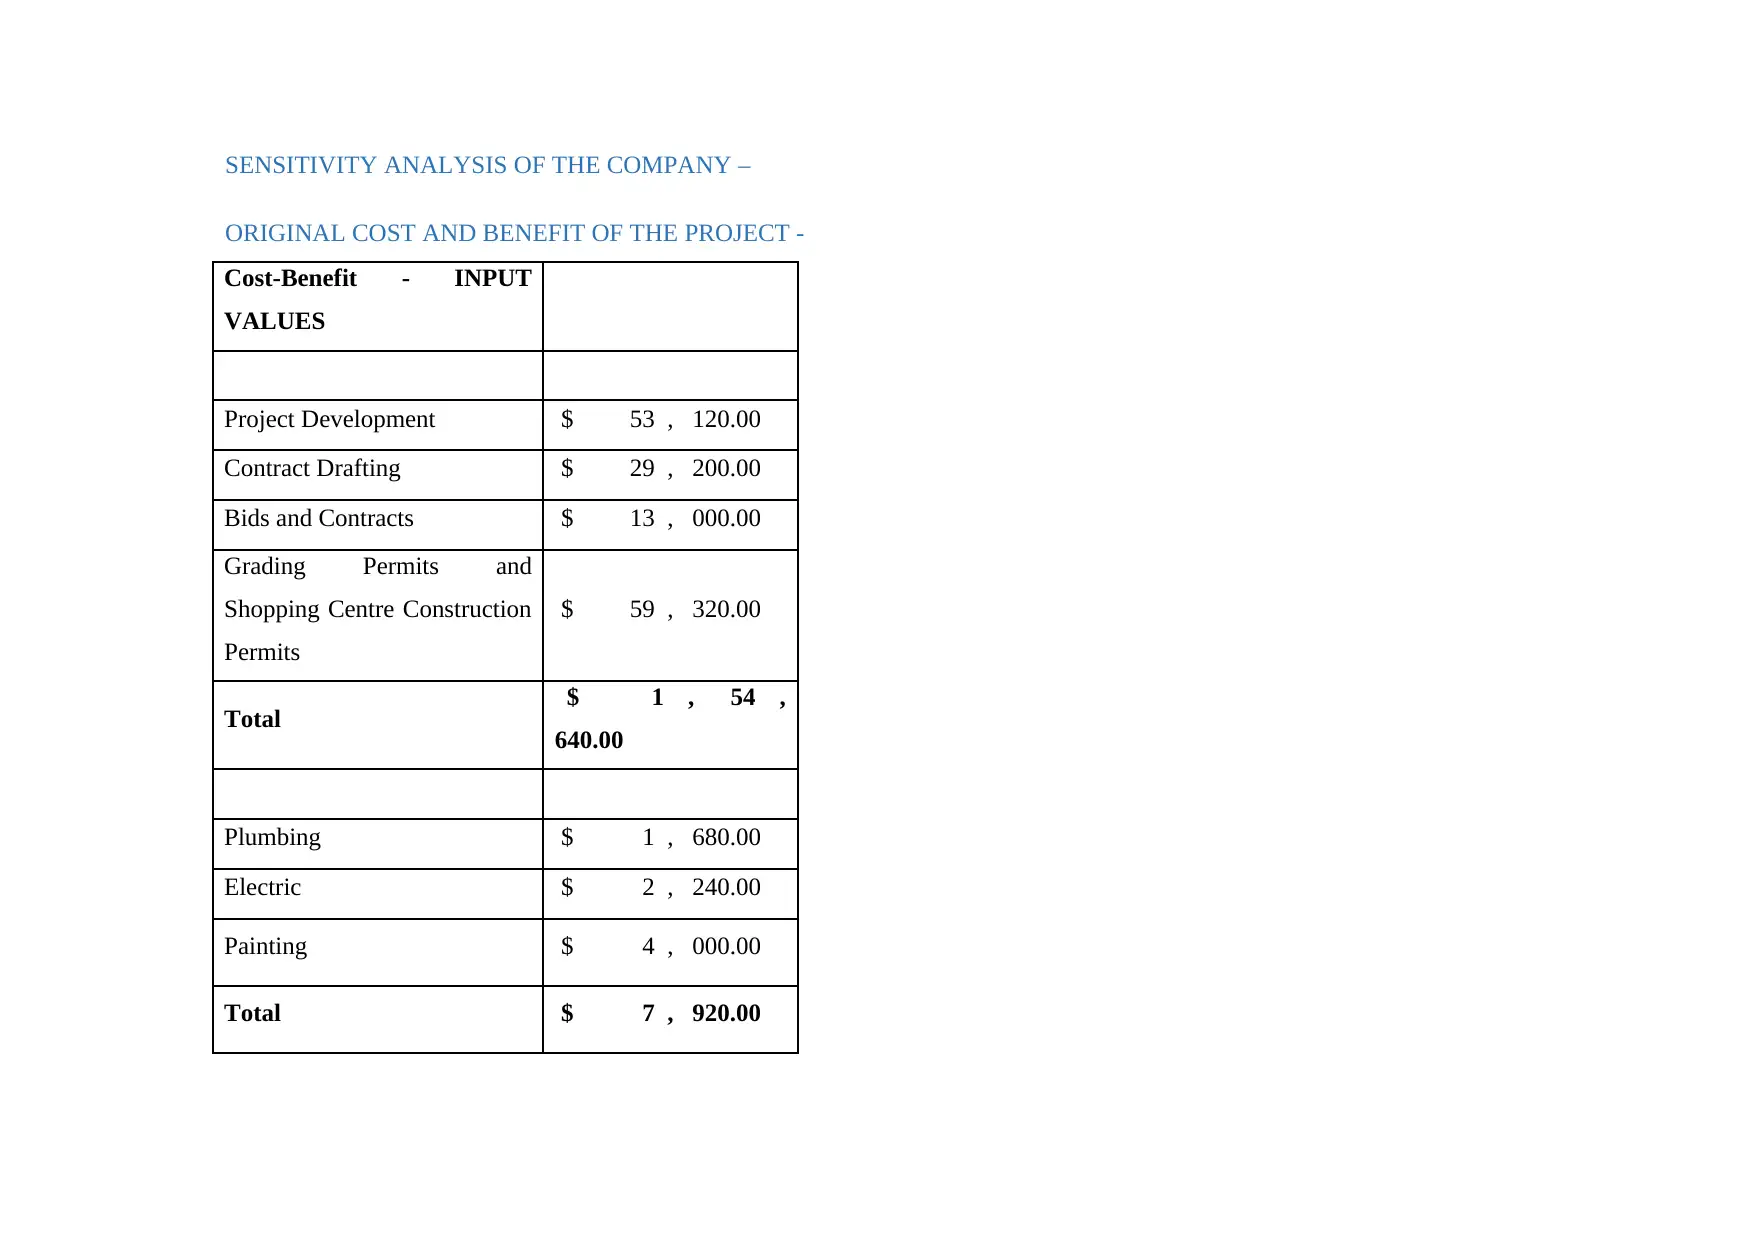
ORIGINAL COST AND BENEFIT OF THE PROJECT -
Cost-Benefit - INPUT
VALUES
Project Development $ 53 , 120.00
Contract Drafting $ 29 , 200.00
Bids and Contracts $ 13 , 000.00
Grading Permits and
Shopping Centre Construction
Permits
$ 59 , 320.00
Total $ 1 , 54 ,
640.00
Plumbing $ 1 , 680.00
Electric $ 2 , 240.00
Painting $ 4 , 000.00
Total $ 7 , 920.00
⊘ This is a preview!⊘
Do you want full access?
Subscribe today to unlock all pages.
Trusted by 1+ million students worldwide
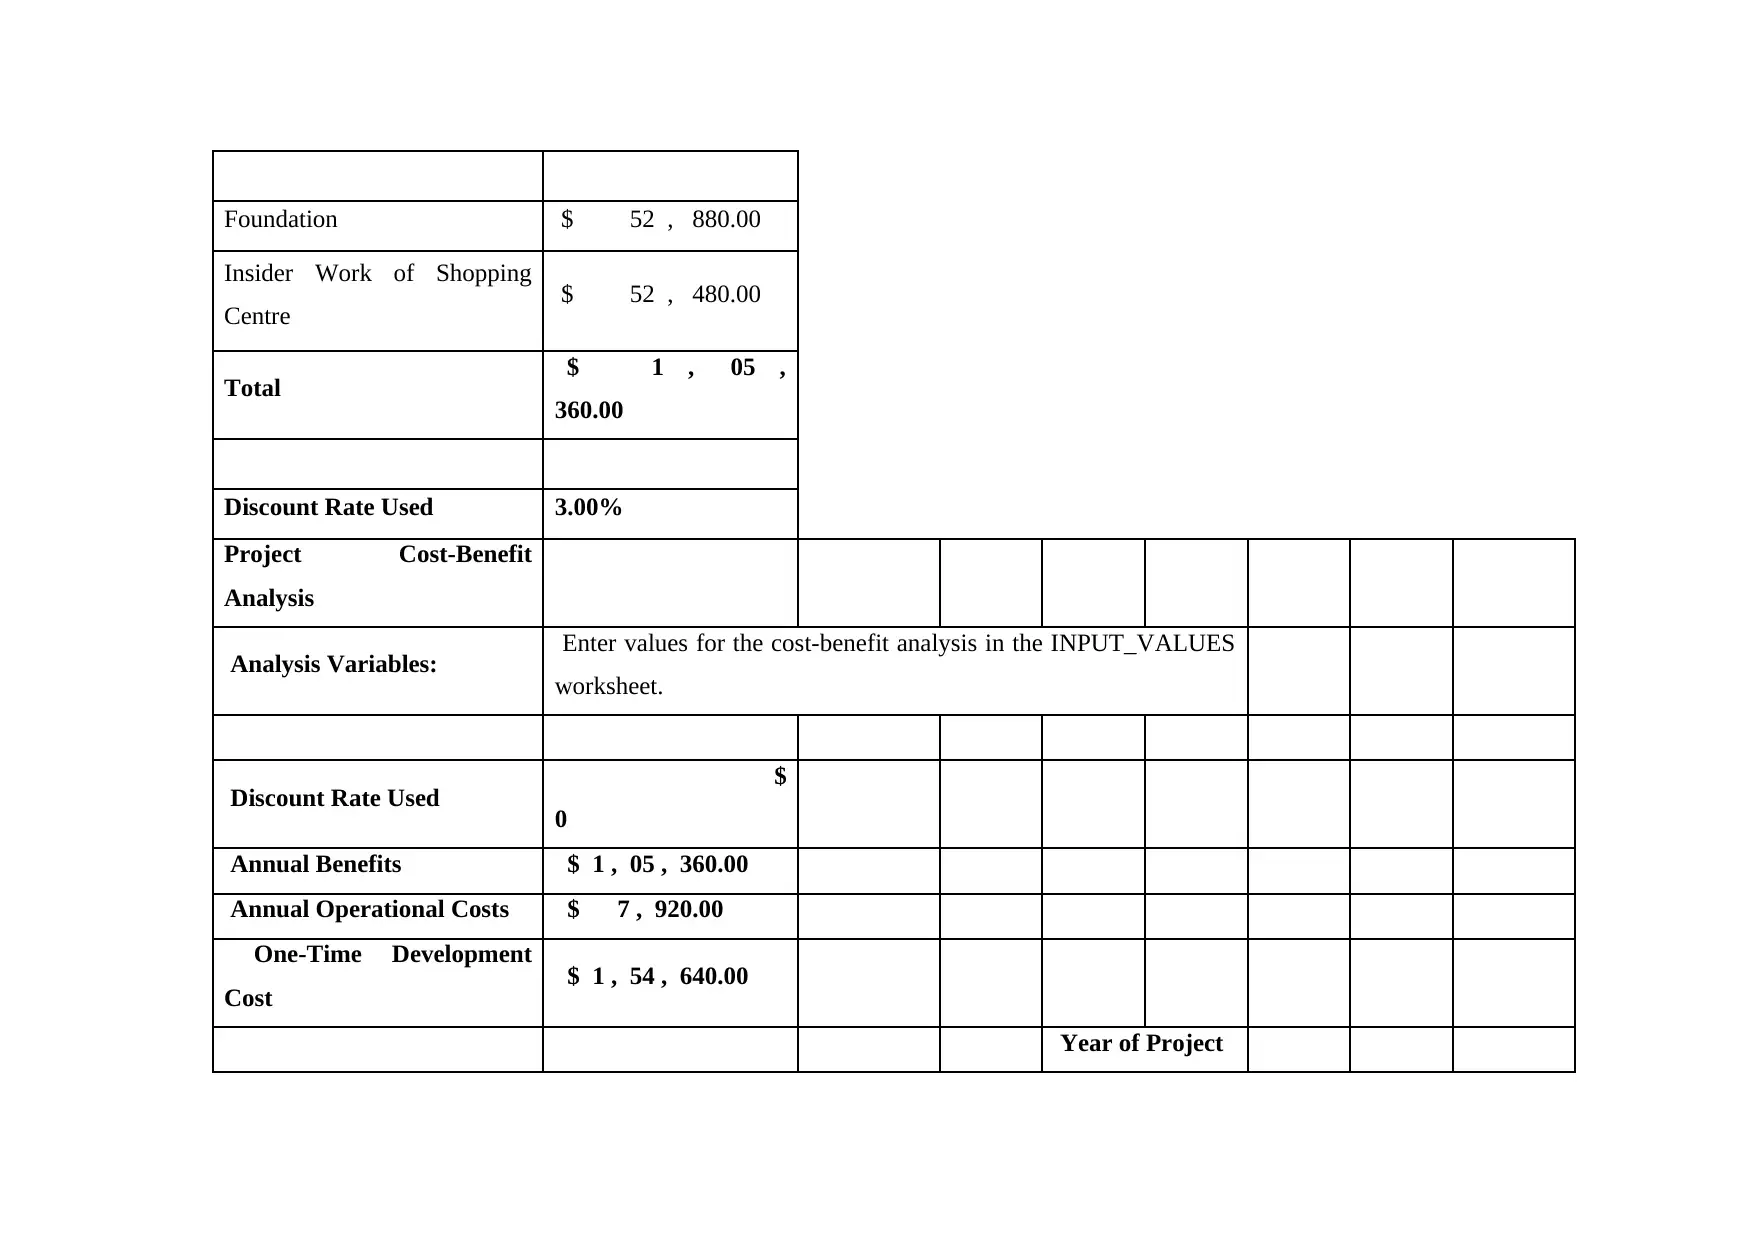
Foundation $ 52 , 880.00
Insider Work of Shopping
Centre $ 52 , 480.00
Total $ 1 , 05 ,
360.00
Discount Rate Used 3.00%
Project Cost-Benefit
Analysis
Analysis Variables: Enter values for the cost-benefit analysis in the INPUT_VALUES
worksheet.
Discount Rate Used $
0
Annual Benefits $ 1 , 05 , 360.00
Annual Operational Costs $ 7 , 920.00
One-Time Development
Cost $ 1 , 54 , 640.00
Year of Project
Paraphrase This Document
Need a fresh take? Get an instant paraphrase of this document with our AI Paraphraser
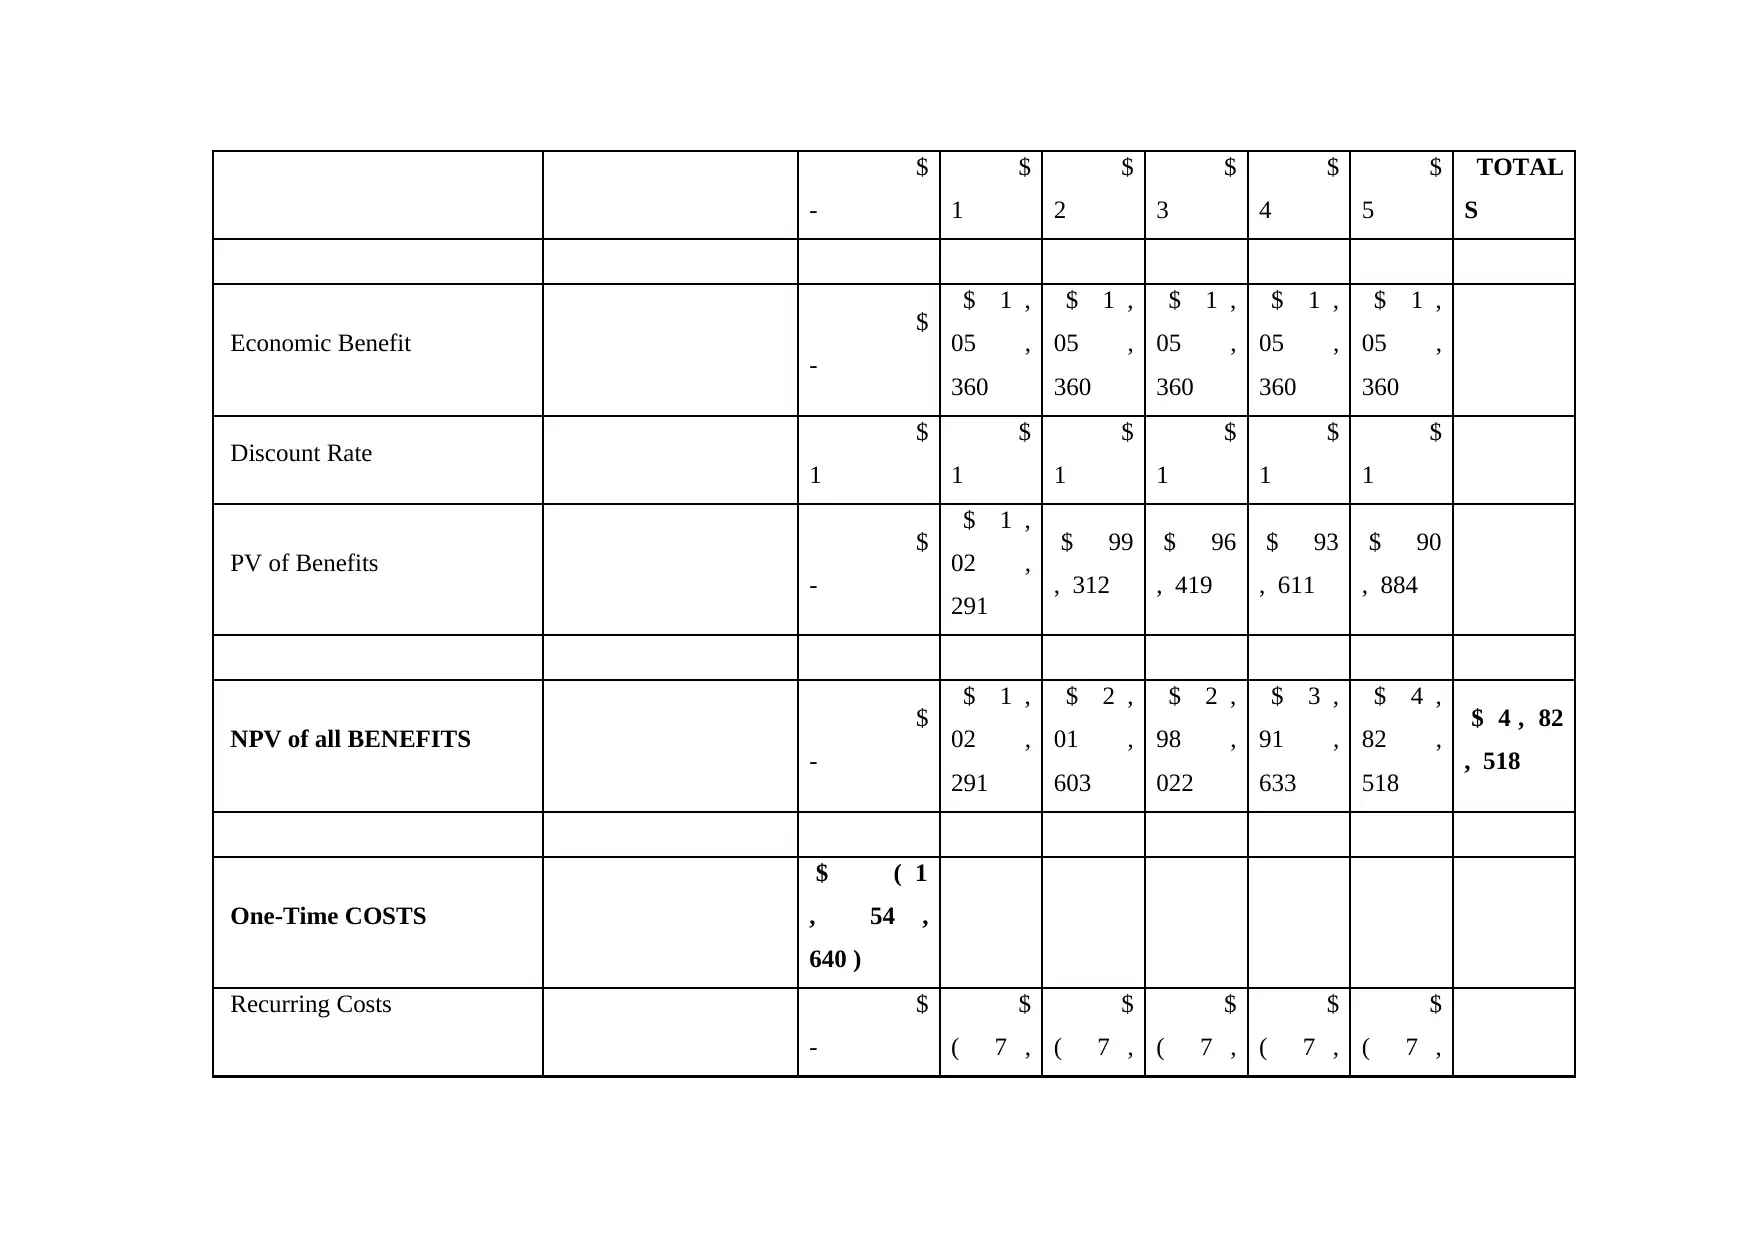
$
-
$
1
$
2
$
3
$
4
$
5
TOTAL
S
Economic Benefit $
-
$ 1 ,
05 ,
360
$ 1 ,
05 ,
360
$ 1 ,
05 ,
360
$ 1 ,
05 ,
360
$ 1 ,
05 ,
360
Discount Rate $
1
$
1
$
1
$
1
$
1
$
1
PV of Benefits $
-
$ 1 ,
02 ,
291
$ 99
, 312
$ 96
, 419
$ 93
, 611
$ 90
, 884
NPV of all BENEFITS $
-
$ 1 ,
02 ,
291
$ 2 ,
01 ,
603
$ 2 ,
98 ,
022
$ 3 ,
91 ,
633
$ 4 ,
82 ,
518
$ 4 , 82
, 518
One-Time COSTS
$ ( 1
, 54 ,
640 )
Recurring Costs $
-
$
( 7 ,
$
( 7 ,
$
( 7 ,
$
( 7 ,
$
( 7 ,
-
$
1
$
2
$
3
$
4
$
5
TOTAL
S
Economic Benefit $
-
$ 1 ,
05 ,
360
$ 1 ,
05 ,
360
$ 1 ,
05 ,
360
$ 1 ,
05 ,
360
$ 1 ,
05 ,
360
Discount Rate $
1
$
1
$
1
$
1
$
1
$
1
PV of Benefits $
-
$ 1 ,
02 ,
291
$ 99
, 312
$ 96
, 419
$ 93
, 611
$ 90
, 884
NPV of all BENEFITS $
-
$ 1 ,
02 ,
291
$ 2 ,
01 ,
603
$ 2 ,
98 ,
022
$ 3 ,
91 ,
633
$ 4 ,
82 ,
518
$ 4 , 82
, 518
One-Time COSTS
$ ( 1
, 54 ,
640 )
Recurring Costs $
-
$
( 7 ,
$
( 7 ,
$
( 7 ,
$
( 7 ,
$
( 7 ,
920 ) 920 ) 920 ) 920 ) 920 )
Discount Rate $
1
$
1
$
1
$
1
$
1
$
1
PV of Recurring Costs $
-
$
( 7 ,
689 )
$
( 7 ,
465 )
$
( 7 ,
248 )
$
( 7 ,
037 )
$
( 6 ,
832 )
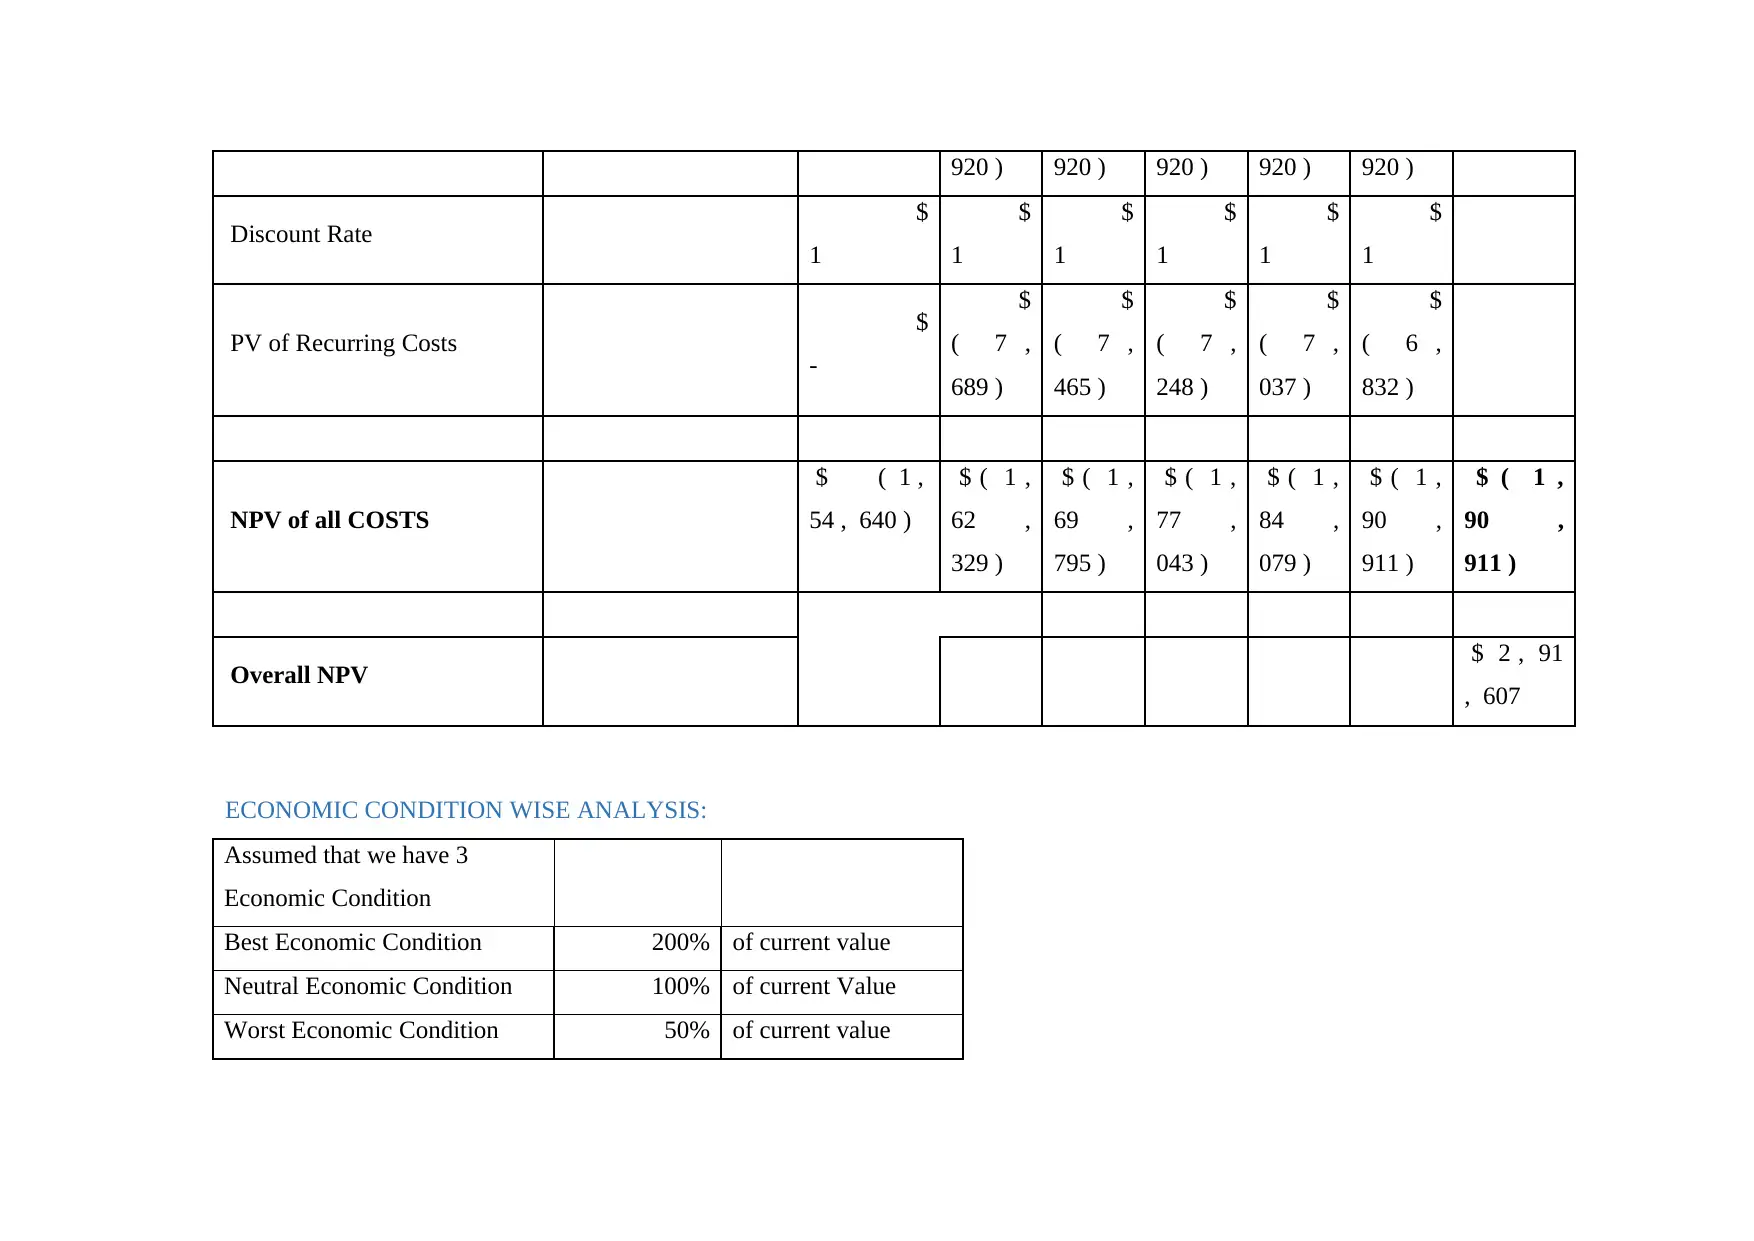
NPV of all COSTS
$ ( 1 ,
54 , 640 )
$ ( 1 ,
62 ,
329 )
$ ( 1 ,
69 ,
795 )
$ ( 1 ,
77 ,
043 )
$ ( 1 ,
84 ,
079 )
$ ( 1 ,
90 ,
911 )
$ ( 1 ,
90 ,
911 )
Overall NPV $ 2 , 91
, 607
ECONOMIC CONDITION WISE ANALYSIS:
Assumed that we have 3
Economic Condition
Best Economic Condition 200% of current value
Neutral Economic Condition 100% of current Value
Worst Economic Condition 50% of current value
Discount Rate $
1
$
1
$
1
$
1
$
1
$
1
PV of Recurring Costs $
-
$
( 7 ,
689 )
$
( 7 ,
465 )
$
( 7 ,
248 )
$
( 7 ,
037 )
$
( 6 ,
832 )
NPV of all COSTS
$ ( 1 ,
54 , 640 )
$ ( 1 ,
62 ,
329 )
$ ( 1 ,
69 ,
795 )
$ ( 1 ,
77 ,
043 )
$ ( 1 ,
84 ,
079 )
$ ( 1 ,
90 ,
911 )
$ ( 1 ,
90 ,
911 )
Overall NPV $ 2 , 91
, 607
ECONOMIC CONDITION WISE ANALYSIS:
Assumed that we have 3
Economic Condition
Best Economic Condition 200% of current value
Neutral Economic Condition 100% of current Value
Worst Economic Condition 50% of current value
⊘ This is a preview!⊘
Do you want full access?
Subscribe today to unlock all pages.
Trusted by 1+ million students worldwide
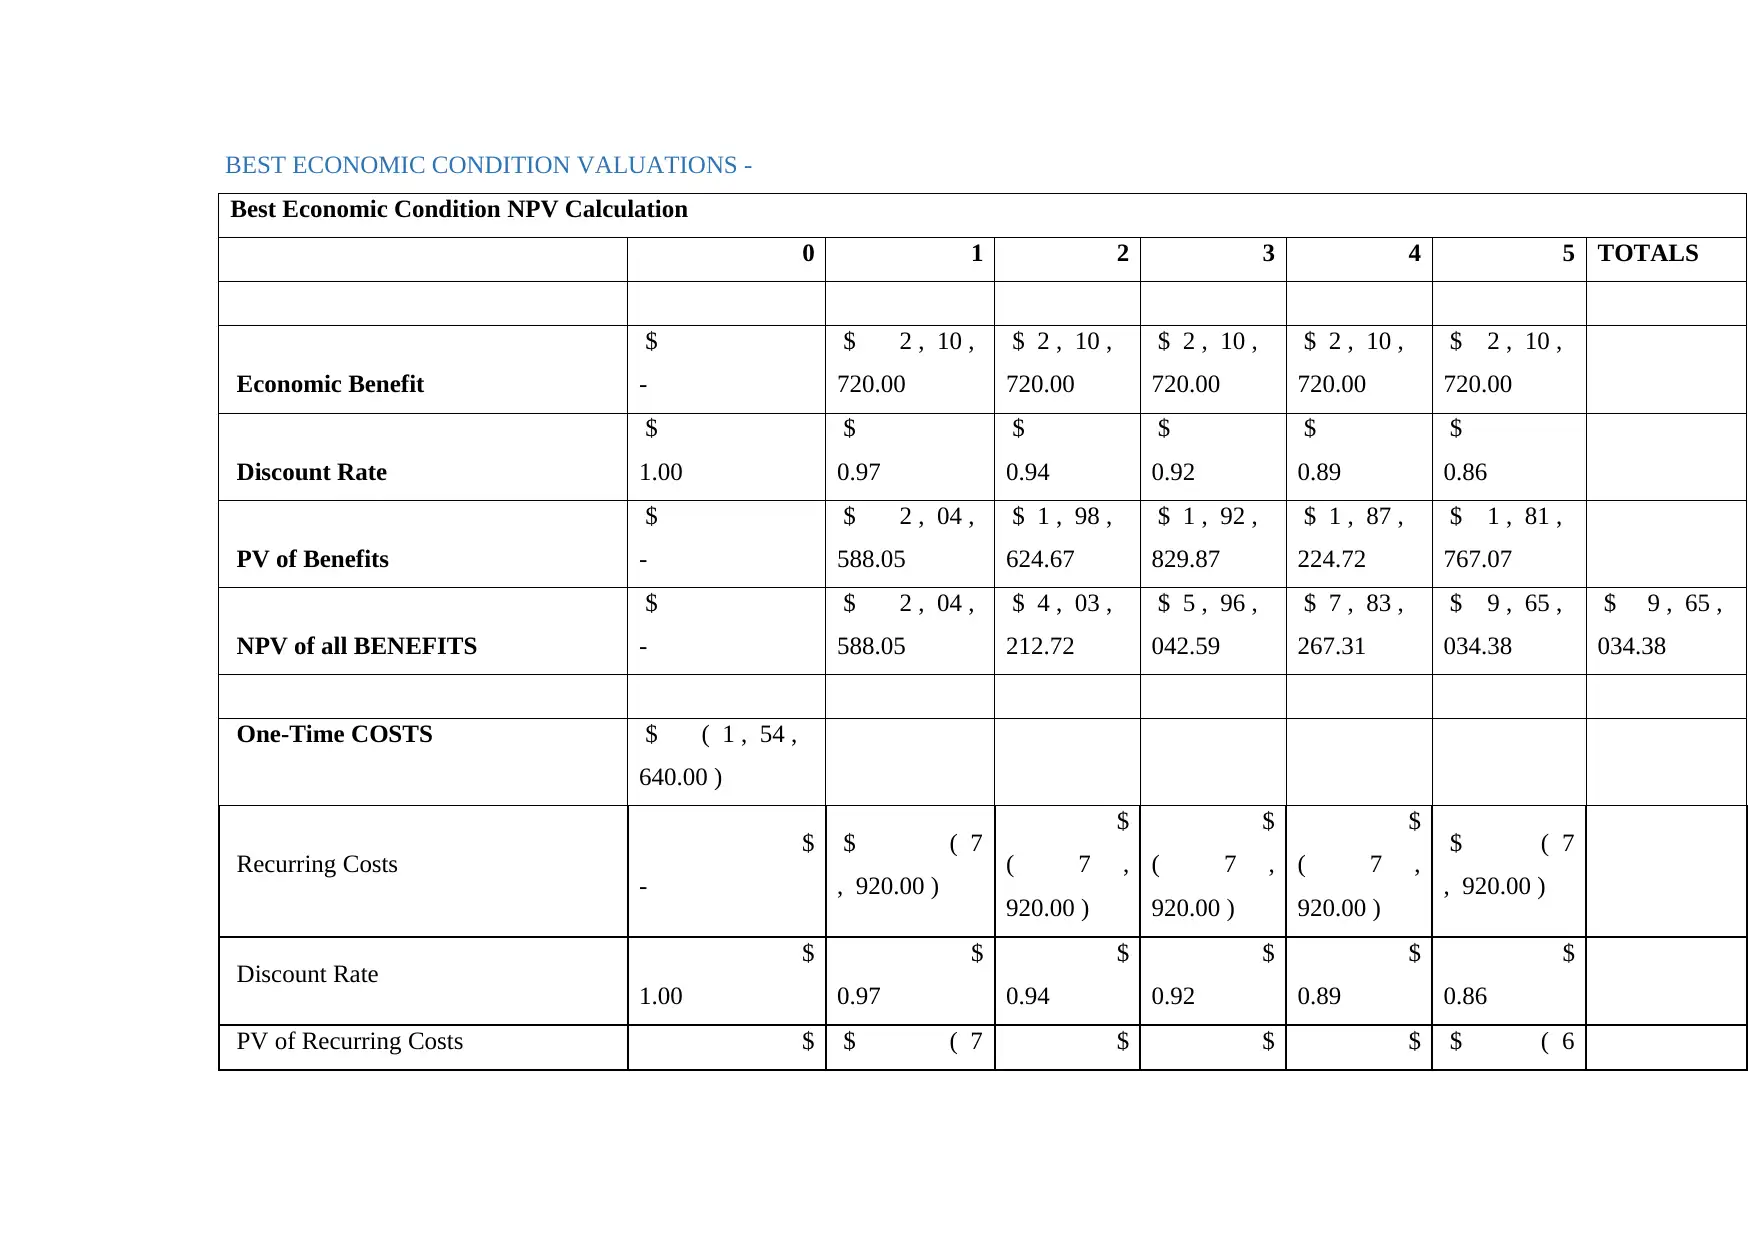
BEST ECONOMIC CONDITION VALUATIONS -
Best Economic Condition NPV Calculation
0 1 2 3 4 5 TOTALS
Economic Benefit
$
-
$ 2 , 10 ,
720.00
$ 2 , 10 ,
720.00
$ 2 , 10 ,
720.00
$ 2 , 10 ,
720.00
$ 2 , 10 ,
720.00
Discount Rate
$
1.00
$
0.97
$
0.94
$
0.92
$
0.89
$
0.86
PV of Benefits
$
-
$ 2 , 04 ,
588.05
$ 1 , 98 ,
624.67
$ 1 , 92 ,
829.87
$ 1 , 87 ,
224.72
$ 1 , 81 ,
767.07
NPV of all BENEFITS
$
-
$ 2 , 04 ,
588.05
$ 4 , 03 ,
212.72
$ 5 , 96 ,
042.59
$ 7 , 83 ,
267.31
$ 9 , 65 ,
034.38
$ 9 , 65 ,
034.38
One-Time COSTS $ ( 1 , 54 ,
640.00 )
Recurring Costs $
-
$ ( 7
, 920.00 )
$
( 7 ,
920.00 )
$
( 7 ,
920.00 )
$
( 7 ,
920.00 )
$ ( 7
, 920.00 )
Discount Rate $
1.00
$
0.97
$
0.94
$
0.92
$
0.89
$
0.86
PV of Recurring Costs $ $ ( 7 $ $ $ $ ( 6
Paraphrase This Document
Need a fresh take? Get an instant paraphrase of this document with our AI Paraphraser
- , 689.32 ) ( 7 ,
465.36 )
( 7 ,
247.92 )
( 7 ,
036.82 ) , 831.86 )
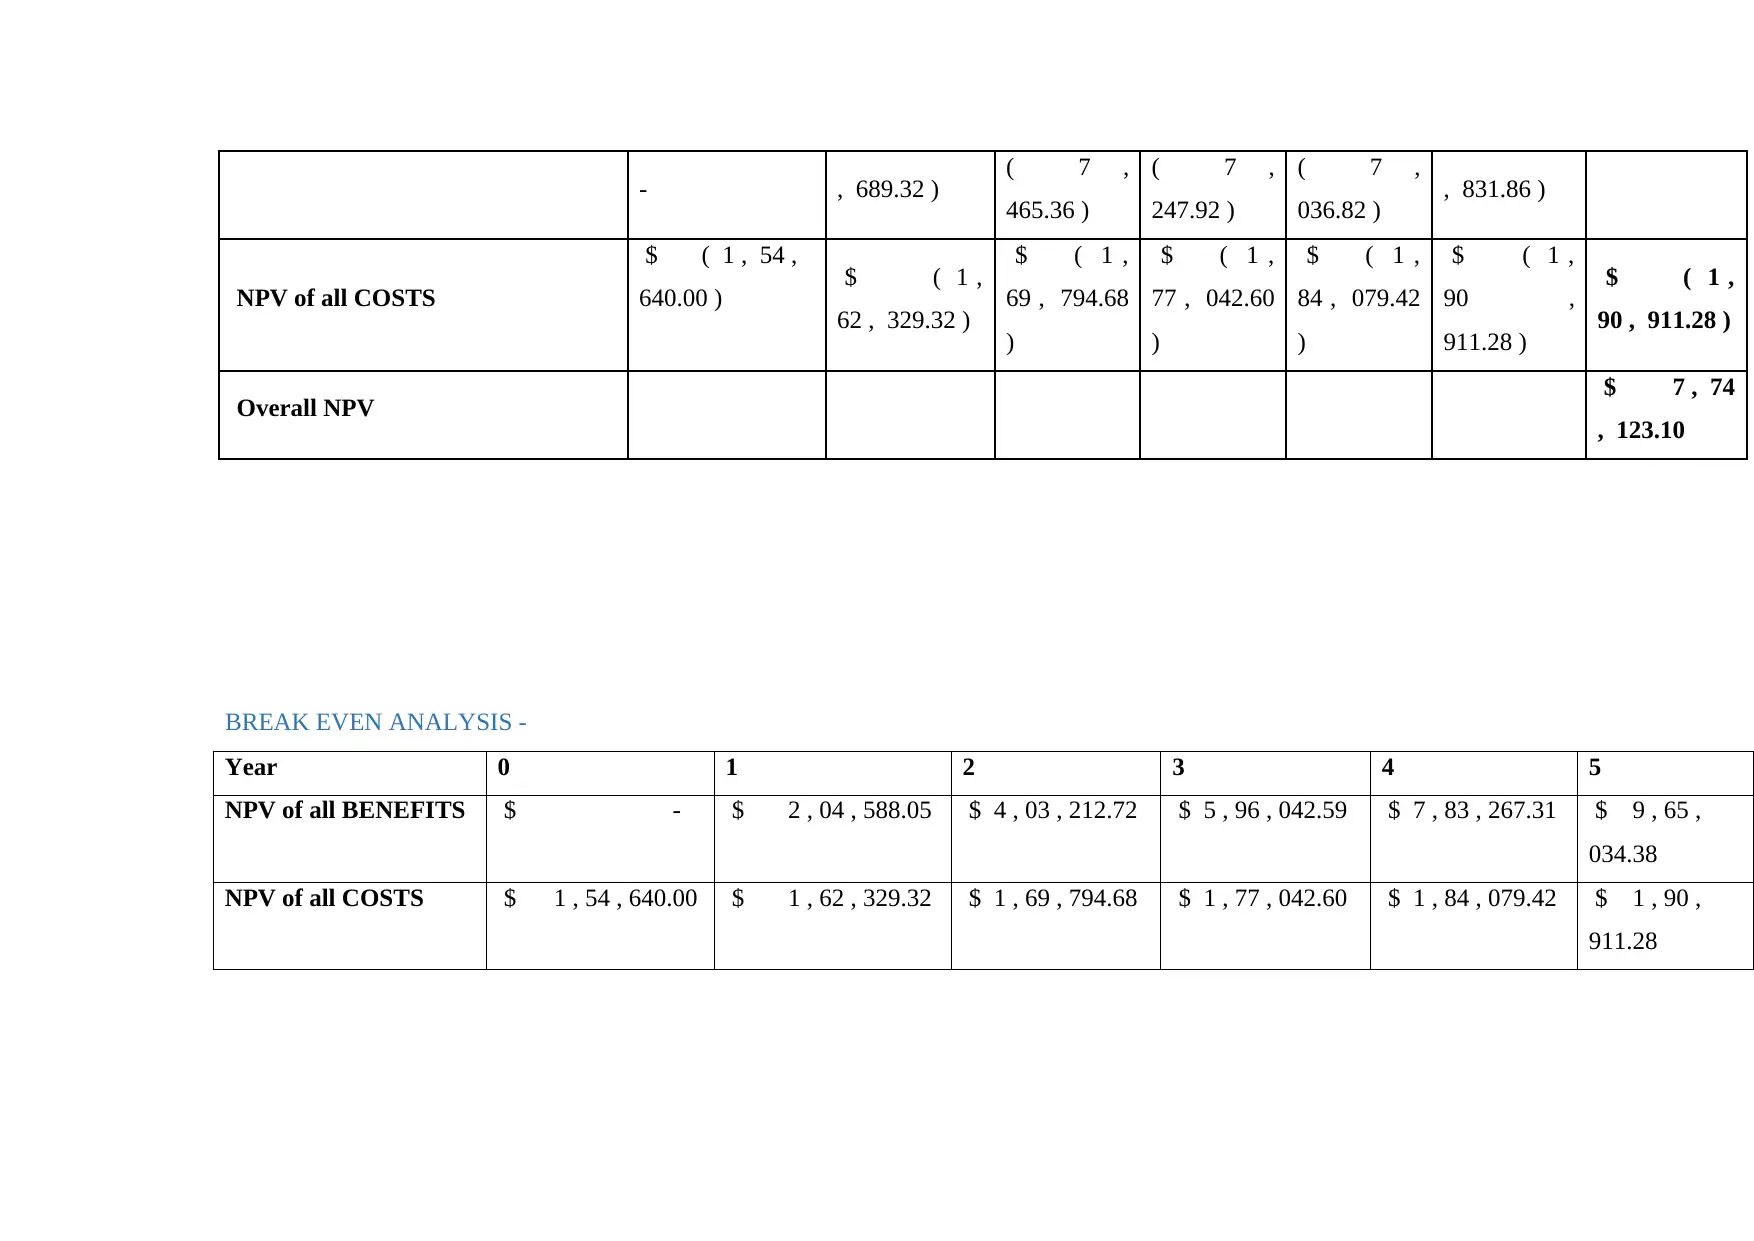
NPV of all COSTS
$ ( 1 , 54 ,
640.00 ) $ ( 1 ,
62 , 329.32 )
$ ( 1 ,
69 , 794.68
)
$ ( 1 ,
77 , 042.60
)
$ ( 1 ,
84 , 079.42
)
$ ( 1 ,
90 ,
911.28 )
$ ( 1 ,
90 , 911.28 )
Overall NPV $ 7 , 74
, 123.10
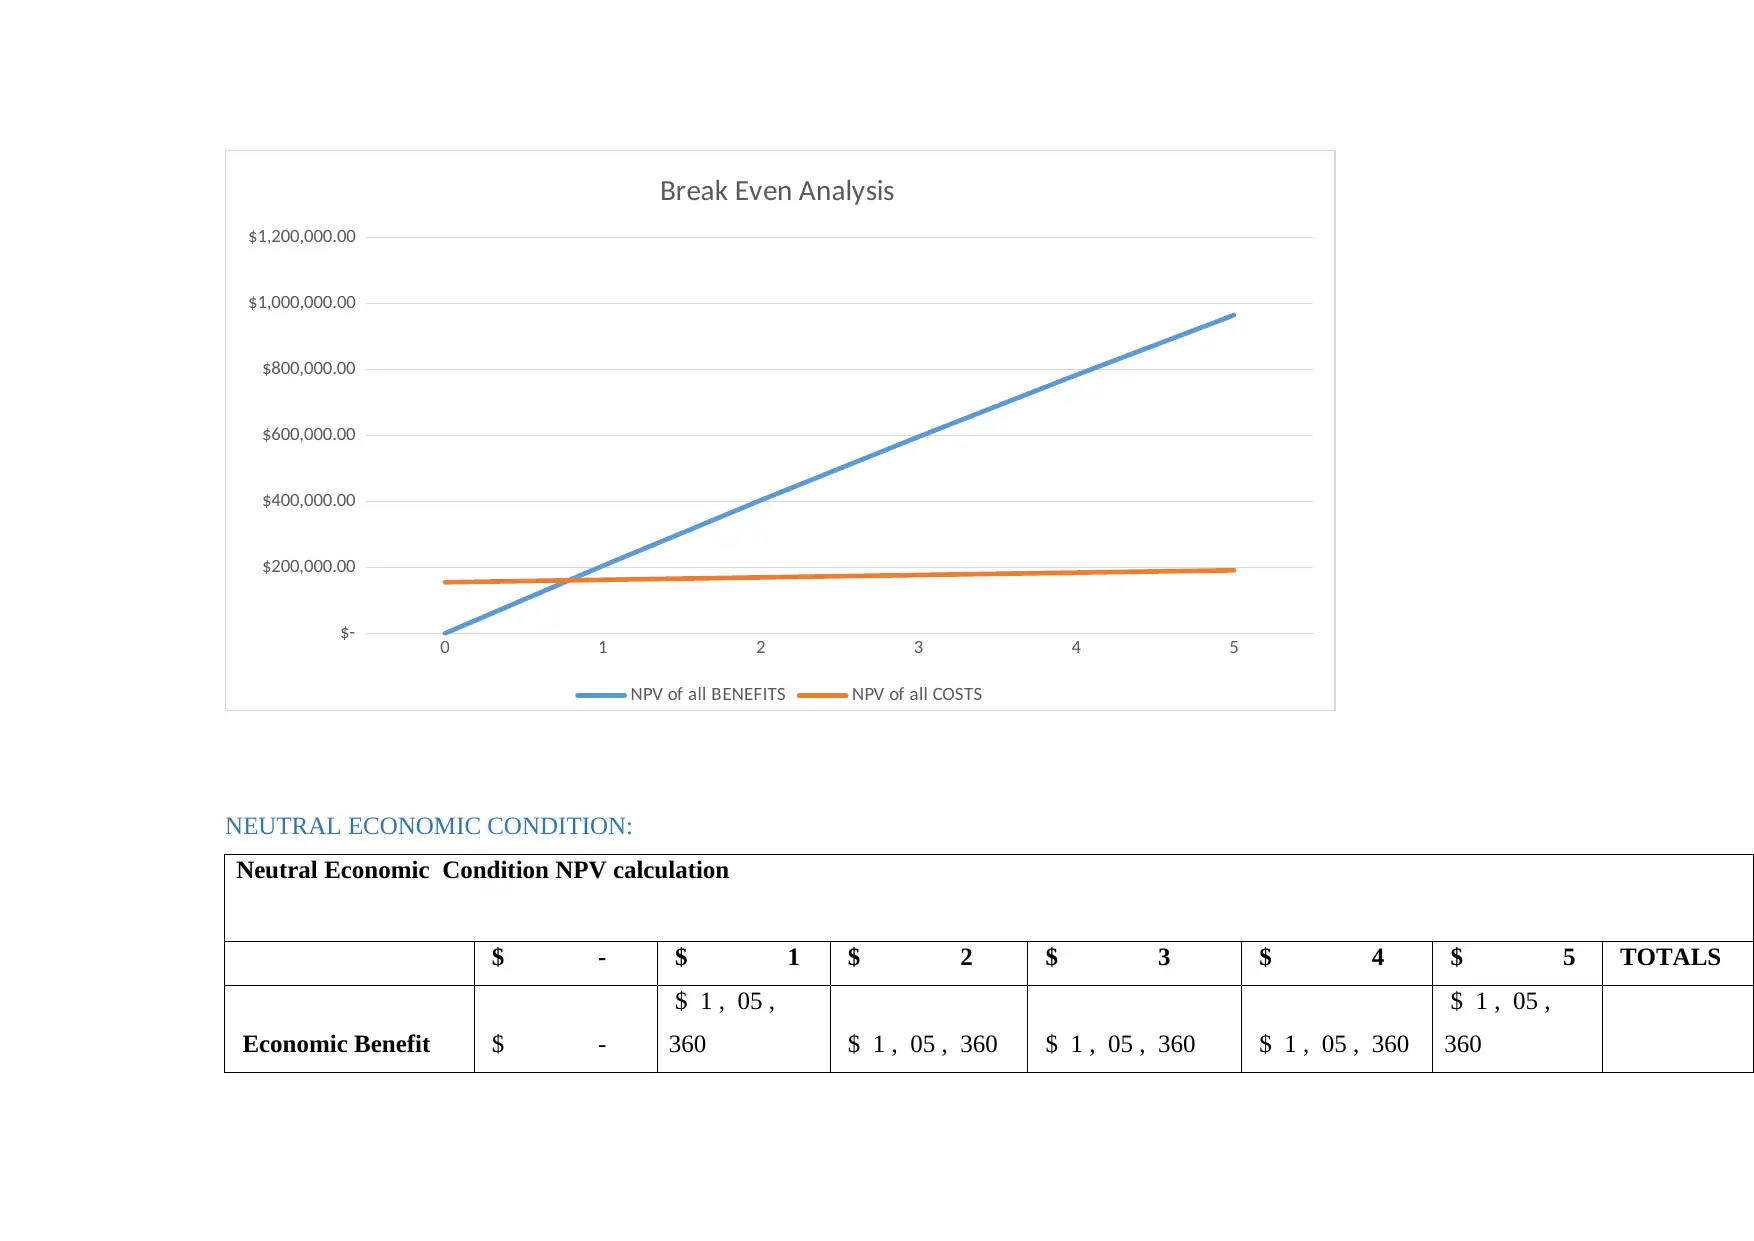
BREAK EVEN ANALYSIS -
Year 0 1 2 3 4 5
NPV of all BENEFITS $ - $ 2 , 04 , 588.05 $ 4 , 03 , 212.72 $ 5 , 96 , 042.59 $ 7 , 83 , 267.31 $ 9 , 65 ,
034.38
NPV of all COSTS $ 1 , 54 , 640.00 $ 1 , 62 , 329.32 $ 1 , 69 , 794.68 $ 1 , 77 , 042.60 $ 1 , 84 , 079.42 $ 1 , 90 ,
911.28
465.36 )
( 7 ,
247.92 )
( 7 ,
036.82 ) , 831.86 )
NPV of all COSTS
$ ( 1 , 54 ,
640.00 ) $ ( 1 ,
62 , 329.32 )
$ ( 1 ,
69 , 794.68
)
$ ( 1 ,
77 , 042.60
)
$ ( 1 ,
84 , 079.42
)
$ ( 1 ,
90 ,
911.28 )
$ ( 1 ,
90 , 911.28 )
Overall NPV $ 7 , 74
, 123.10
BREAK EVEN ANALYSIS -
Year 0 1 2 3 4 5
NPV of all BENEFITS $ - $ 2 , 04 , 588.05 $ 4 , 03 , 212.72 $ 5 , 96 , 042.59 $ 7 , 83 , 267.31 $ 9 , 65 ,
034.38
NPV of all COSTS $ 1 , 54 , 640.00 $ 1 , 62 , 329.32 $ 1 , 69 , 794.68 $ 1 , 77 , 042.60 $ 1 , 84 , 079.42 $ 1 , 90 ,
911.28
0 1 2 3 4 5
$-
$200,000.00
$400,000.00
$600,000.00
$800,000.00
$1,000,000.00
$1,200,000.00
Break Even Analysis
NPV of all BENEFITS NPV of all COSTS
NEUTRAL ECONOMIC CONDITION:
Neutral Economic Condition NPV calculation
$ - $ 1 $ 2 $ 3 $ 4 $ 5 TOTALS
Economic Benefit $ -
$ 1 , 05 ,
360 $ 1 , 05 , 360 $ 1 , 05 , 360 $ 1 , 05 , 360
$ 1 , 05 ,
360
⊘ This is a preview!⊘
Do you want full access?
Subscribe today to unlock all pages.
Trusted by 1+ million students worldwide
1 out of 21

Your All-in-One AI-Powered Toolkit for Academic Success.
+13062052269
info@desklib.com
Available 24*7 on WhatsApp / Email
![[object Object]](/_next/static/media/star-bottom.7253800d.svg)
Unlock your academic potential
Copyright © 2020–2026 A2Z Services. All Rights Reserved. Developed and managed by ZUCOL.