Project Appraisal: Sensitivity and Break-even Analysis Report
VerifiedAdded on 2022/06/01
|35
|4301
|19
Report
AI Summary
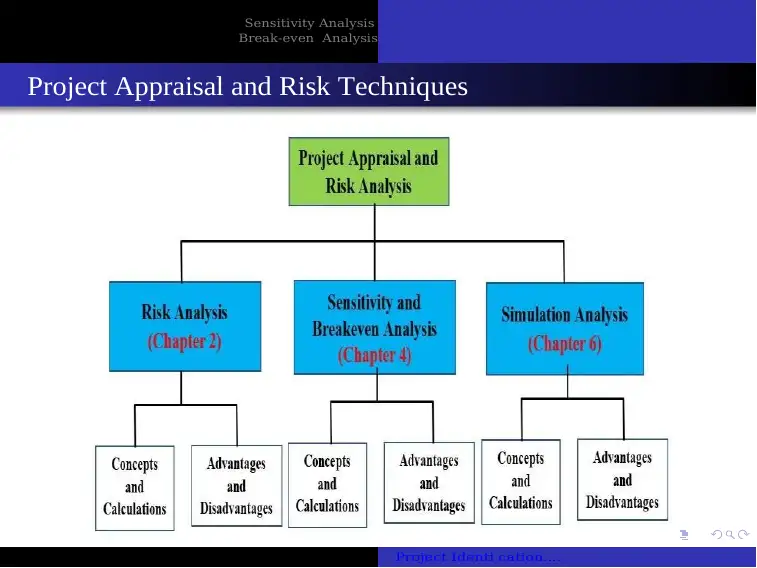
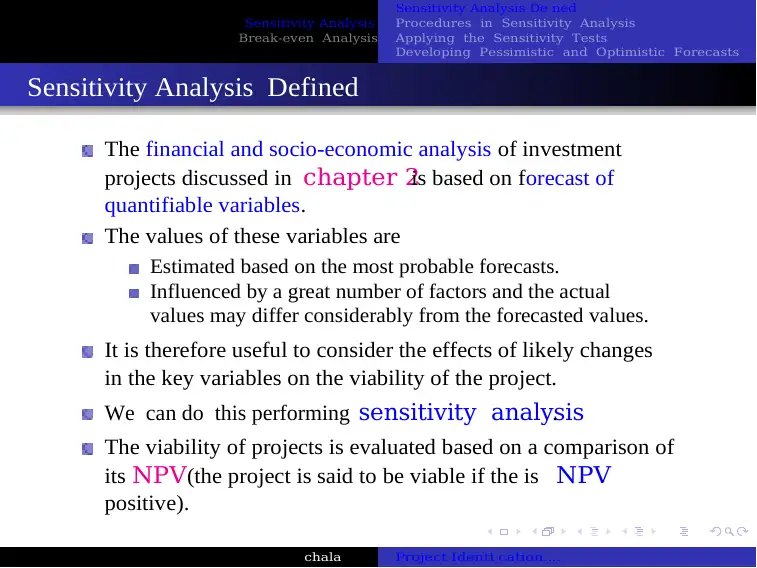
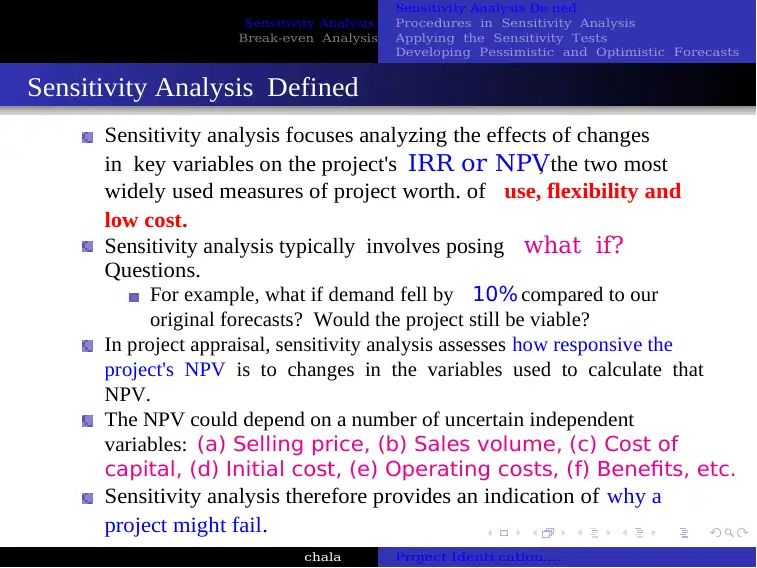
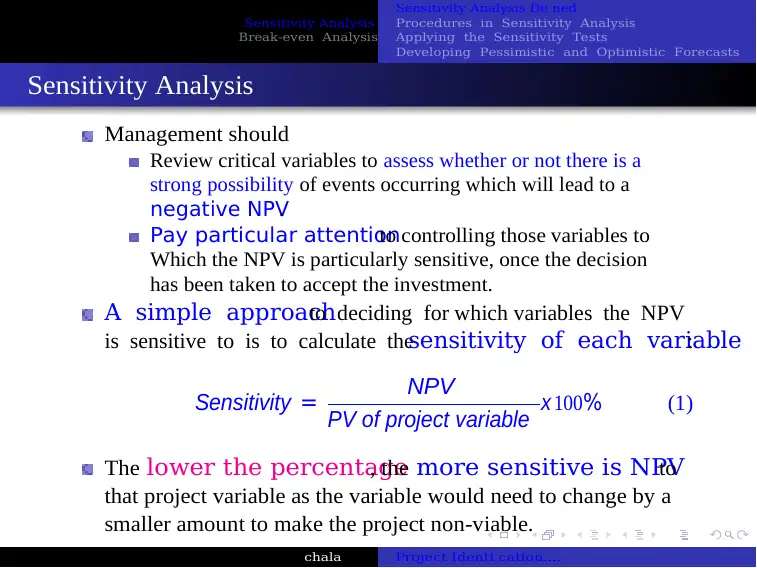
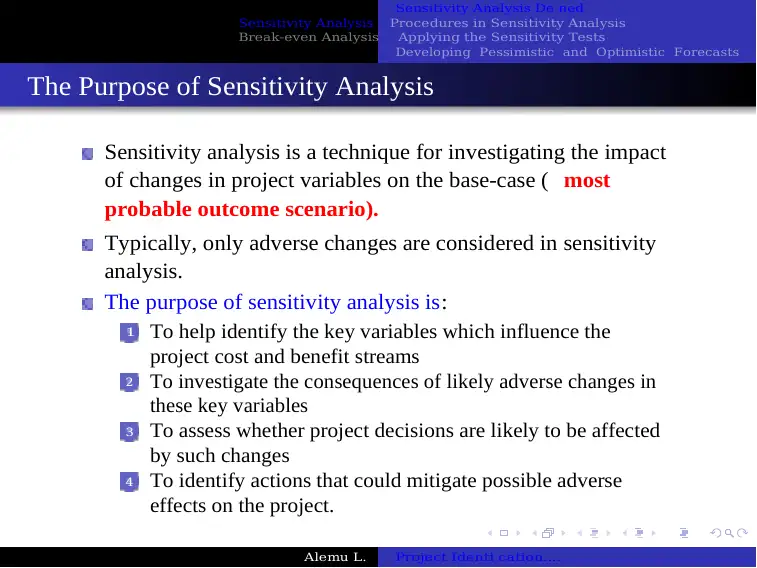
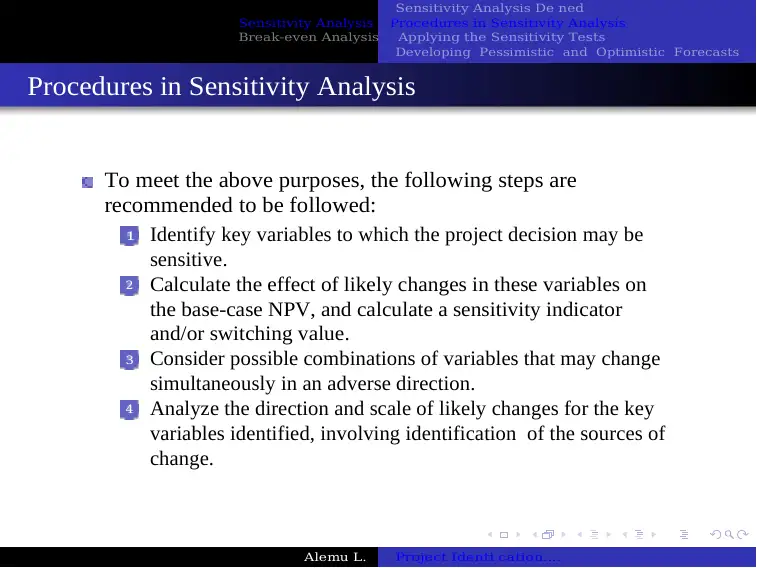
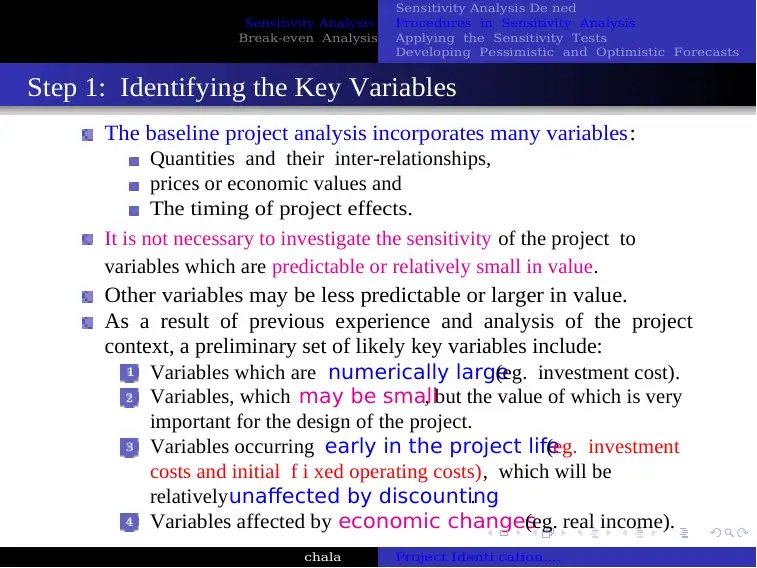
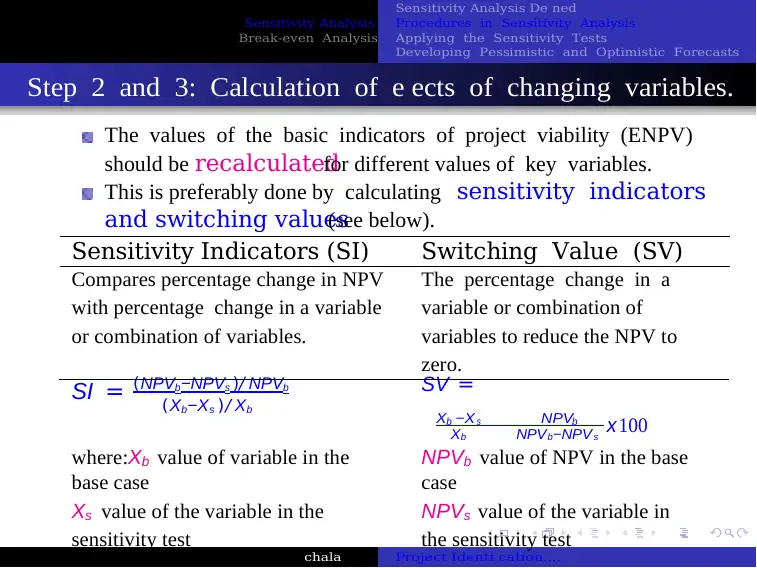
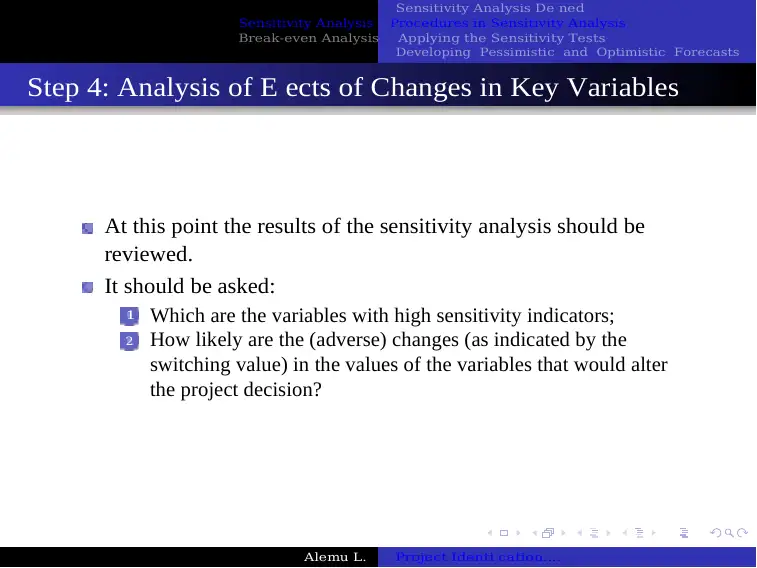
This report delves into sensitivity analysis and break-even analysis within the context of project appraisal, essential tools for evaluating investment viability. It defines sensitivity analysis, outlining its procedures and applications, including the development of optimistic and pessimistic forecasts. The report emphasizes the importance of assessing the impact of changes in key variables, such as selling price, sales volume, and costs, on a project's Net Present Value (NPV) and Internal Rate of Return (IRR). It details the purpose of sensitivity analysis, which is to identify critical variables, investigate the consequences of adverse changes, and mitigate potential risks. The report also covers the procedures involved in sensitivity analysis, including identifying key variables, calculating the effects of changes, and analyzing the results using sensitivity indicators and switching values. A case study involving Bishoftu Automotive Engineering Industry (BAEI) is used to illustrate the application of sensitivity analysis, demonstrating how to measure project sensitivity to changes in investment costs, economic benefits, and operational costs. The report provides a comprehensive understanding of how sensitivity and break-even analyses are used to make informed financial decisions.
Contribute Materials
Your contribution can guide someone’s learning journey. Share your
documents today.

Project Identi cation....
Chala D (PhD)
RVU
September, 2021
Project Identication and
Appraisal
4. Sensitivity and Break-even Analysis
Sensitivity Analysis
Break-even Analysis
Chala D (PhD)
RVU
September, 2021
Project Identication and
Appraisal
4. Sensitivity and Break-even Analysis
Sensitivity Analysis
Break-even Analysis
Secure Best Marks with AI Grader
Need help grading? Try our AI Grader for instant feedback on your assignments.

Project Identi cation....
Sensitivity Analysis
Sensitivity Analysis Demand
Procedures in Sensitivity Analysis
Applying the Sensitivity Tests
Developing Pessimistic and Optimistic Forecasts
Break-even Analysis
Break-even analysis and decision-making
Sensitivity Analysis
Break-even Analysis
Table of Contents
1
2
Sensitivity Analysis
Sensitivity Analysis Demand
Procedures in Sensitivity Analysis
Applying the Sensitivity Tests
Developing Pessimistic and Optimistic Forecasts
Break-even Analysis
Break-even analysis and decision-making
Sensitivity Analysis
Break-even Analysis
Table of Contents
1
2

Project Identi cation....
Sensitivity Analysis
Break-even Analysis
Project Appraisal and Risk Techniques
Sensitivity Analysis
Break-even Analysis
Project Appraisal and Risk Techniques

Sensitivity Analysis De ned
Procedures in Sensitivity Analysis
Applying the Sensitivity Tests
Developing Pessimistic and Optimistic Forecasts
Sensitivity Analysis
Break-even Analysis
Sensitivity Analysis Defined
chala Project Identi cation....
The financial and socio-economic analysis of investment
projects discussed in chapter 2is based on forecast of
quantifiable variables.
The values of these variables are
Estimated based on the most probable forecasts.
Influenced by a great number of factors and the actual
values may differ considerably from the forecasted values.
It is therefore useful to consider the effects of likely changes
in the key variables on the viability of the project.
We can do this performing sensitivity analysis.
The viability of projects is evaluated based on a comparison of
its NPV (the project is said to be viable if the is NPV
positive).
Secure Best Marks with AI Grader
Need help grading? Try our AI Grader for instant feedback on your assignments.

Sensitivity Analysis De ned
Procedures in Sensitivity Analysis
Applying the Sensitivity Tests
Developing Pessimistic and Optimistic Forecasts
Sensitivity Analysis
Break-even Analysis
Sensitivity Analysis Defined
chala Project Identi cation....
Sensitivity analysis focuses analyzing the effects of changes
in key variables on the project's IRR or NPV, the two most
widely used measures of project worth. of use, flexibility and
low cost.
Sensitivity analysis typically involves posing what if?
Questions.
For example, what if demand fell by 10% compared to our
original forecasts? Would the project still be viable?
In project appraisal, sensitivity analysis assesses how responsive the
project's NPV is to changes in the variables used to calculate that
NPV.
The NPV could depend on a number of uncertain independent
variables: (a) Selling price, (b) Sales volume, (c) Cost of
capital, (d) Initial cost, (e) Operating costs, (f) Benefits, etc.
Sensitivity analysis therefore provides an indication of why a
project might fail.

chala Project Identi cation....
Sensitivity Analysis
Break-even Analysis
Sensitivity Analysis
Sensitivity Analysis De ned
Procedures in Sensitivity Analysis
Applying the Sensitivity Tests
Developing Pessimistic and Optimistic Forecasts
Management should
Review critical variables to assess whether or not there is a
strong possibility of events occurring which will lead to a
negative NPV.
Pay particular attentionto controlling those variables to
Which the NPV is particularly sensitive, once the decision
has been taken to accept the investment.
A simple approachto deciding for which variables the NPV
is sensitive to is to calculate thesensitivity of each variable:
Sensitivity = NPV
PV of project variable x 100 % (1)
The lower the percentage, the more sensitive is NPVto
that project variable as the variable would need to change by a
smaller amount to make the project non-viable.
Sensitivity Analysis
Break-even Analysis
Sensitivity Analysis
Sensitivity Analysis De ned
Procedures in Sensitivity Analysis
Applying the Sensitivity Tests
Developing Pessimistic and Optimistic Forecasts
Management should
Review critical variables to assess whether or not there is a
strong possibility of events occurring which will lead to a
negative NPV.
Pay particular attentionto controlling those variables to
Which the NPV is particularly sensitive, once the decision
has been taken to accept the investment.
A simple approachto deciding for which variables the NPV
is sensitive to is to calculate thesensitivity of each variable:
Sensitivity = NPV
PV of project variable x 100 % (1)
The lower the percentage, the more sensitive is NPVto
that project variable as the variable would need to change by a
smaller amount to make the project non-viable.

Alemu L. Project Identi cation....
Sensitivity analysis is a technique for investigating the impact
of changes in project variables on the base-case ( most
probable outcome scenario).
Typically, only adverse changes are considered in sensitivity
analysis.
The purpose of sensitivity analysis is:
To help identify the key variables which influence the
project cost and benefit streams
To investigate the consequences of likely adverse changes in
these key variables
To assess whether project decisions are likely to be affected
by such changes
To identify actions that could mitigate possible adverse
effects on the project.
Sensitivity Analysis De ned
Sensitivity Analysis Procedures in Sensitivity Analysis
Break-even Analysis Applying the Sensitivity Tests
Developing Pessimistic and Optimistic Forecasts
The Purpose of Sensitivity Analysis
1
2
3
4
Paraphrase This Document
Need a fresh take? Get an instant paraphrase of this document with our AI Paraphraser

Alemu L. Project Identi cation....
To meet the above purposes, the following steps are
recommended to be followed:
Identify key variables to which the project decision may be
sensitive.
Calculate the effect of likely changes in these variables on
the base-case NPV, and calculate a sensitivity indicator
and/or switching value.
Consider possible combinations of variables that may change
simultaneously in an adverse direction.
Analyze the direction and scale of likely changes for the key
variables identified, involving identification of the sources of
change.
Sensitivity Analysis De ned
Sensitivity Analysis Procedures in Sensitivity Analysis
Break-even Analysis Applying the Sensitivity Tests
Developing Pessimistic and Optimistic Forecasts
Procedures in Sensitivity Analysis
1
2
3
4

Sensitivity Analysis De ned
Procedures in Sensitivity Analysis
Applying the Sensitivity Tests
Developing Pessimistic and Optimistic Forecasts
Sensitivity Analysis
Break-even Analysis
Step 1: Identifying the Key Variables
chala Project Identi cation....
The baseline project analysis incorporates many variables:
Quantities and their inter-relationships,
prices or economic values and
The timing of project effects.
It is not necessary to investigate the sensitivity of the project to
variables which are predictable or relatively small in value.
Other variables may be less predictable or larger in value.
As a result of previous experience and analysis of the project
context, a preliminary set of likely key variables include:
Variables which are numerically large(eg. investment cost).
Variables, which may be small, but the value of which is very
important for the design of the project.
Variables occurring early in the project life(eg. investment
costs and initial f i xed operating costs), which will be
relativelyunaffected by discounting.
Variables affected by economic changes(eg. real income).
1
2
3
4

Sensitivity Analysis De ned
Procedures in Sensitivity Analysis
Applying the Sensitivity Tests
Developing Pessimistic and Optimistic Forecasts
Sensitivity Analysis
Break-even Analysis
Step 2 and 3: Calculation of e ects of changing variables.
chala Project Identi cation....
b
Xb
s b
NPVb−NPVs
The values of the basic indicators of project viability (ENPV)
should be recalculatedfor different values of key variables.
This is preferably done by calculating sensitivity indicators
and switching values(see below).
Sensitivity Indicators (SI) Switching Value (SV)
Compares percentage change in NPV
with percentage change in a variable
or combination of variables.
SI = (NPVb−NPVs )/ NPVb
The percentage change in a
variable or combination of
variables to reduce the NPV to
zero.
SV =
(Xb −Xs )/ Xb X −X NPV
where:Xb value of variable in the
base case
Xs value of the variable in the
sensitivity test
NPVb value of NPV in the base
case
NPVs value of the variable in
the sensitivity test
x 100
Secure Best Marks with AI Grader
Need help grading? Try our AI Grader for instant feedback on your assignments.

Sensitivity Analysis De ned
Procedures in Sensitivity Analysis
Applying the Sensitivity Tests
Developing Pessimistic and Optimistic Forecasts
Sensitivity Analysis
Break-even Analysis
Step 2 and 3: Calculation of e ects of changing variables.
chala Project Identi cation....
Interpretation
SI: percentage change in NPV.
SV: A change of approximately value of the variable is
necessary before the NPV becomes zero.
Characteristic
SI: Indicates to which variables the project result is or is not
sensitive. Suggests further examination of change in variable.
SV: Measures extent of change for a variable which will leave
the project decision unchanged.
Note: The switching value is, by deffenition, the reciprocal
of the sensitivity indicator.
It can also be calculated by using the sensitivity formula
presented in equation 1.

Sensitivity Analysis De ned
Sensitivity Analysis Procedures in Sensitivity Analysis
Break-even Analysis Applying the Sensitivity Tests
Developing Pessimistic and Optimistic Forecasts
Step 4: Analysis of E ects of Changes in Key Variables
Alemu L. Project Identi cation....
At this point the results of the sensitivity analysis should be
reviewed.
It should be asked:
Which are the variables with high sensitivity indicators;
How likely are the (adverse) changes (as indicated by the
switching value) in the values of the variables that would alter
the project decision?
1
2

Sensitivity Analysis De ned
Sensitivity Analysis Procedures in Sensitivity Analysis
Break-even Analysis Applying the Sensitivity Tests
Developing Pessimistic and Optimistic Forecasts
Applying the Sensitivity Tests
Alemu L. Project Identi cation....
Suppose Bishoftu Automotive Engineering Industry (BAEI) is
considering a project with the following cash f l ows and
discount rate of 12%.
Year 1998 '99 '00 '01 '02 '03 '04 '05 '06 '07
Benefits 0 283 339 396 453 509 566 566 566 566
Cost: 1889 61 61 61 61 61 61 61 61 61
Investment 1889 0 0 0 0 0 0 0 0 0
O & M 0 61 61 61 61 61 61 61 61 61
Measure the sensitivity of the project to changes in several key
variables, as follows:
An increase in investment cost by 20 percent. A
decrease in economic benefits by 20 percent.
An increase in costs of operation and maintenance (O & M) by
20 percent.
1
2
3
Paraphrase This Document
Need a fresh take? Get an instant paraphrase of this document with our AI Paraphraser

Sensitivity Analysis De ned
Sensitivity Analysis Procedures in Sensitivity Analysis
Break-even Analysis Applying the Sensitivity Tests
Developing Pessimistic and Optimistic Forecasts
Applying the Sensitivity Tests
Alemu L. Project Identi cation....
n
(1 + r )t
i =1
To make the sensitivity analysis, we should rst compute the
baseline NPV for each of the variables presented in the second
column above.
Recall from previous chapter that NPV is given by:
NPV = Σ R t − C (2)
Given that PV B PV C PV I and PVOM represent present value
(PV) of benefits, cost, investment as well as operation and
maintenance, respectively, we have the following results:
0

Sensitivity Analysis De ned
Sensitivity Analysis Procedures in Sensitivity Analysis
Break-even Analysis Applying the Sensitivity Tests
Developing Pessimistic and Optimistic Forecasts
Applying the Sensitivity Tests
Alemu L. Project Identi cation....
0 283 339 396 566
PV B = (1.12) + ( 1.12 )2 + (1 . 12) 3 + (1. 12)4 + ... + (1. 12) 10 = 2104
1889 61 61 61 61
PVC = (1.12) + (1.12)2 + (1.12)3 + (1.12)4 + ... + (1.12)10 = 1978
1889 0 0 0 0
PV I = (1. 12) + ( 1.12 )2 + (1. 12)3 + (1.12)4 + ... + (1 .12 )10 = 1687
0 61 61 61 61
PV OM = (1. 12) + ( 1. 12 )2 + (1. 12 )3 + (1. 12 )4 + ... + (1 . 12) 10 = 291
Then The NPV is the difference between PV B and PV C .
NPV = PVB − PVC = 2104 − 1978 = 126
This value is also called the baseline NPV ( NPV b )

Sensitivity Analysis De ned
Sensitivity Analysis Procedures in Sensitivity Analysis
Break-even Analysis Applying the Sensitivity Tests
Developing Pessimistic and Optimistic Forecasts
Applying the Sensitivity Tests
Alemu L. Project Identi cation....
We can summarize the effects of the above changes in
the following Table.
Item Baseline Changes Effect
on
NPV*
SI SV (%)
NPV 126
Benefits 2104 -20% -294 16.69 6
Investment 1687 20% -211 13.38 7.5
O & M 291 20% 68 2.31 43.3
SI = sensitivity indicator, SV = switching value
Secure Best Marks with AI Grader
Need help grading? Try our AI Grader for instant feedback on your assignments.

Alemu L. Project Identi cation....
B
B
I
C
OM
C
Effect of 20% decrease in benefit:
PV New = 2104 − 2104 ∗ 20 % = 2104 − 2104 ∗ 0. 2 = 1683
NPVNew = PV New − PVC = 1683 − 1978 = −294
Effect of 20% increase in investment:
PV New = 1687 + 1687 ∗ 20 % = 2024
PV New = PV New + PVOM = 2024 + 291 = 2315
C I
NPVNew = PVB − PV New = 2104 − 2315 = −211
E ect of 20% increase in O & M:
PV New = 291 + 291 ∗ 20% = 349
PV New = PVI + PV New = 1687 + 349 = 2036
C OM
NPVNew = PVB − PV New = 2104 − 2036 = 68
Sensitivity Analysis De ned
Sensitivity Analysis Procedures in Sensitivity Analysis
Break-even Analysis Applying the Sensitivity Tests
Developing Pessimistic and Optimistic Forecasts
E ect on NPV
1
2
3
B
B
I
C
OM
C
Effect of 20% decrease in benefit:
PV New = 2104 − 2104 ∗ 20 % = 2104 − 2104 ∗ 0. 2 = 1683
NPVNew = PV New − PVC = 1683 − 1978 = −294
Effect of 20% increase in investment:
PV New = 1687 + 1687 ∗ 20 % = 2024
PV New = PV New + PVOM = 2024 + 291 = 2315
C I
NPVNew = PVB − PV New = 2104 − 2315 = −211
E ect of 20% increase in O & M:
PV New = 291 + 291 ∗ 20% = 349
PV New = PVI + PV New = 1687 + 349 = 2036
C OM
NPVNew = PVB − PV New = 2104 − 2036 = 68
Sensitivity Analysis De ned
Sensitivity Analysis Procedures in Sensitivity Analysis
Break-even Analysis Applying the Sensitivity Tests
Developing Pessimistic and Optimistic Forecasts
E ect on NPV
1
2
3

Alemu L. Project Identi cation....
Xb NPV b −NPV s 2104 126+294
Xb NPV b −NPV s 1687 126+211
Xb NPV b −NPV s 291 126− 68
6 %
7 . 5 %
43 . 3 %
Effect of 20% decrease in benefit:
SI = ( NPVb−NPVs ) / NPVb = ( 126+294) / 126
= 16.69(Xb −X s )/ X b ( 2104− 1683)/ 2104
SV = X b − X s NPV b x 100 = 2104− 1683 126 x 100 =
Effect of 20% increase in investment:
SI = ( NPVb−NPV s ) / NPVb = ( 126+211) / 126 = 13.38(X b−X s )/ X b ( 1687− 2024) / 1687
SV = X b − X s NPV b x 100 = 1687− 2024 126 x 100 =
E ect of 20% increase in O & M:
SI = ( NPVb−NPVs ) / NPVb = ( 126− 68) / 126 = 2.31(Xb−Xs )/ Xb ( 291− 349) / 291
SV = X b − X s NPV b x 100 = 291− 68 126 x 100 =
Sensitivity Analysis De ned
Sensitivity Analysis Procedures in Sensitivity Analysis
Break-even Analysis Applying the Sensitivity Tests
Developing Pessimistic and Optimistic Forecasts
Sensitivity Indicators and Switching Values
1
2
3

Alemu L. Project Identi cation....
In the case of an increase in investment costs of 20%, the
sensitivity indicator is 13.38.
This means that the change of 20 percent in the variable
(investment cost) results in a change of 266 percent in the
ENPV.
It follows that the higher the SI, the more sensitive the NPV is
the change in the concerned variable.
In the same example, the switching value is 7.5 percent which
is the reciprocal value of the SI x 100.
This means that a change (increase) of 7.5 percent in the key
variable (investment cost) will cause the ENPV to become
zero.
The lower the SV, the more sensitive the NPV is to the change
in the variable concerned and the higher the risk with the
project.
Sensitivity Analysis De ned
Sensitivity Analysis Procedures in Sensitivity Analysis
Break-even Analysis Applying the Sensitivity Tests
Developing Pessimistic and Optimistic Forecasts
Analysis of Effects of Changes in Key Variables
1
2
Paraphrase This Document
Need a fresh take? Get an instant paraphrase of this document with our AI Paraphraser

Alemu L. Project Identi cation....
Strengths Weaknesses
(a) No complicated theory to
understand.
(b) Information will be presented to
management in a form which
facilitates subjective judgment to
decide the likelihood of the various
possible outcomes considered.
(c) Indicates just how critical are
some of the forecasts which are
considered to be uncertain.
d) Identifies areas which are crucial
to the success of project [those
areas can be carefully monitored].
(a) It is not an optimizing technique. It
provides information on the basis of which
decisions can be made. It does not point
directly to the correct decision.
(b) It assumes that changes to variables can
be made independently, eg. investment cost
will change independently of other variables.
This is unlikely. If one variable changes, the
rm would probably change other variable
at the same time and there would be little
e ect on NPV [a simulation method].
(c) It only identi es how far a variable
needs to change. It does not look at the
probability of such a change.
Sensitivity Analysis De ned
Sensitivity Analysis Procedures in Sensitivity Analysis
Break-even Analysis Applying the Sensitivity Tests
Developing Pessimistic and Optimistic Forecasts
Strength and Weakness of Sensitivity Analysis

Alemu L. Project Identi cation....
Sensitivity analysis examines how sensitive a particular NPV
calculation is to changes in underlying assumptions.
Sensitivity analysis is also known as what if analysis and can
be done along with optimistic and pessimistic analysis
(forcasts).
Pessimistic ForecastsRefers to the most extreme situation
that can happen if things do not go as planned.
Optimistic ForecastsRefers to the most favorable projected
outcome, which is based on the assumption that everything
goes according to the intial plan.
Sensitivity Analysis De ned
Sensitivity Analysis Procedures in Sensitivity Analysis
Break-even Analysis Applying the Sensitivity Tests
Developing Pessimistic and Optimistic Forecasts

Sensitivity Analysis De ned
Procedures in Sensitivity Analysis
Applying the Sensitivity Tests
Developing Pessimistic and Optimistic Forecasts
Sensitivity Analysis
Break-even Analysis
Developing Pessimistic and Optimistic Forecast
Alemu L. Project Identi cation....
Variable Pessimistic Expected
or Best
Optimistic
Market size (per year) 5000 10000 20000
Market share 20% 30% 50%
Price 1,9 2 2.2
Variable cost (per plane) 1.2 1 0.8
Fixed cost (per year) 1.891 1.791 1.741
Investment 1.900 1.500 1.000
Example: BAEI has recently developed a new car and wants
to go ahead with full- scale production. The initial (year 1)
investment is ETB 1500 million, followed by production and
sales over the next f i ve years. The forecasted changes to
the key variables appear in Table 1.
Table 1: Cash ow forecasts for BAEI (in millions of ETB)
Secure Best Marks with AI Grader
Need help grading? Try our AI Grader for instant feedback on your assignments.

Sensitivity Analysis De ned
Procedures in Sensitivity Analysis
Applying the Sensitivity Tests
Developing Pessimistic and Optimistic Forecasts
Sensitivity Analysis
Break-even Analysis
Developing Pessimistic and Optimistic Forecast
Alemu L. Project Identi cation....
Under sensitivity analysis, one input is varied while all other
inputs are assumed to meet their expectation.
For example, an NPV of - 1,802 occurs when the pessimistic
forecast of 5,000 is used for market size.
While all other variable are set at their expected forecast from
Table 1.
Table 2 can be used for at least two purposes.
Taken as a whole, the Table can indicate whether NPV
analysis should be trusted. Managers viewing the Table will
likely consider NPV analysis to be useful for the BAEI.
Sensitivity analysis shows where more information is needed.
Examples
1
2

Sensitivity Analysis De ned
Procedures in Sensitivity Analysis
Applying the Sensitivity Tests
Developing Pessimistic and Optimistic Forecasts
Sensitivity Analysis
Break-even Analysis
Developing Pessimistic and Optimistic Forecast
Alemu L. Project Identi cation....
Example an error in the estimate of investment appears to
be relatively unimportant because even under the pessimistic
scenario, the NPV of 1,208 million is still highly positive.
By contrast, the pessimistic forecast for market share leads to
a negative NPV of - 696 million, and a pessimistic forecast for
market size leads to a negative NPV of - 1,802.
Because the effect of incorrect revenues is so much greater
than the effect of incorrect estimates costs, more
information about the factors determining revenues might be
needed.
Because of these advantages, sensitivity analysis is widely used
in practice.

Sensitivity Analysis De ned
Procedures in Sensitivity Analysis
Applying the Sensitivity Tests
Developing Pessimistic and Optimistic Forecasts
Sensitivity Analysis
Break-even Analysis
Developing Pessimistic and Optimistic Forecast
Alemu L. Project Identi cation....
Table 2: NPV calculations for BAEI Using Sensitivity Analysis
Variable Pessimistic Baseline Optimistic
Market size (per year) -1,802 1,5717 8,154
Market share -696 1,5717 5,942
Price 853 1,5717 2,844
Variable cost (per plane) 189 1,5717 2,844
Fixed cost (per year) 1,295 1,5717 1,628
Investment 1,208 1,5717 1,903
Paraphrase This Document
Need a fresh take? Get an instant paraphrase of this document with our AI Paraphraser

Sensitivity Analysis
Break-even Analysis Break-even analysis and decision-making
Break-even Analysis
Alemu L. Project Identi cation....
The organization should critically evaluate all new projects.
Critical evaluation is necessary to emphasize internal controls
and justify the costs.
One of the important dimensions of this evaluation is to
f i nd the operating level which justifies the costs implicit in
the activity.
There will always be a scale of activity below which the costs
do not justify starting the proposed activity.
The knowledge of this level of activity is necessary for decision
making, which require the breakeven analysis.

Sensitivity Analysis
Break-even Analysis Break-even analysis and decision-making
Break-even Analysis
Alemu L. Project Identi cation....
Break-even analysis is an approach which helps management
to identify the critical level of activity, namely the break-even
level, which is a level of activity at which funds allocated to
the project are just sufficient to cover costs of operation.
It is performed to determine the value of a variable of a project
that makes two elements equal (revenues and costs).
If the activity is below this level, the project will incur losses.
Break-even analysis is another form of financial analysis.
It is a technique for f i nding a point at which a project will
cover its costs or break even.
It is often used to make an initial decision on whether to
proceed with a project.
It is also a technique of f i n nancial control in the sense
that further analyses may be necessary as conditions change.

Sensitivity Analysis
Break-even Analysis Break-even analysis and decision-making
Break-even Analysis
Alemu L. Project Identi cation....
In order to f i nd BE level, we require information on:
Total Revenue (TR): is the price charged per unit (P)
multiplied by the number of units produced or sold (Q):
TR = QxP
Total Costs (TC): TC = TFC + TVC
Fixed Costs (FC): remain the same, regardless of output or
units sold. Example: Rent, building cost, etc.
Variable Costs (VC): change with the number of units
produced or sold. Examples are cost of raw material, fuel, and
other material related to production, and direct labor
costs. TVC = Q.VC
The break-even level of activity would be identified
by equating the revenue and two cost components.
1
2
Secure Best Marks with AI Grader
Need help grading? Try our AI Grader for instant feedback on your assignments.

Alemu L. Project Identi cation....
Sensitivity Analysis Break-even analysis and decision-making
Break-even Analysis
Break-even Analysis Graphically
Sensitivity Analysis Break-even analysis and decision-making
Break-even Analysis
Break-even Analysis Graphically

Alemu L. Project Identi cation....
You can calculate the break-even point by expanding the
break-even equation:
TR = TC ⇒ PQ = TFC + TVC
PQ = TFC + Q.VC ⇒ (P − VC )Q = TFC
TFC
Q BE = P − VC
Example:
Sensitivity Analysis Break-even analysis and decision-making
Break-even Analysis
The Break-even Formula
You can calculate the break-even point by expanding the
break-even equation:
TR = TC ⇒ PQ = TFC + TVC
PQ = TFC + Q.VC ⇒ (P − VC )Q = TFC
TFC
Q BE = P − VC
Example:
Sensitivity Analysis Break-even analysis and decision-making
Break-even Analysis
The Break-even Formula

Alemu L. Project Identi cation....
The fixed costs at Company X are ETB 1 million annually.
The main product has revenue of ETB 8.50 per unit and ETB
4.50 variable cost.
Determine the breakeven quantity per year, and
Annual pro t if 300000 units are sold.
Solution:
TFC 1000000
QBE = P − VC = 8.5 − 4.5 = 250, 000
Profit = TR − TC = P.Q − (TFC + TVC )
Profit = 8. 5 ∗ 300, 000 − ( 1000000 + 300000 ∗ 4. 5 ) = 200, 000
Sensitivity Analysis
Break-even Analysis Break-even analysis and decision-making
Example
Paraphrase This Document
Need a fresh take? Get an instant paraphrase of this document with our AI Paraphraser

Alemu L. Project Identi cation....
Using a Break-Even Analysis, you can answer questions like:
What are the projected profits and losses at any given
output level?
At what minimum sales level do you avoid making a loss?
Do your sales projections for a new product exceed break-even?
If you drop a product, will your break-even improve?
How will raising or lowering prices affect your profitability?
If costs increase, what is the effect on your break-
even position?
How does investing in facility improvements affeect
your break-even point?
Sensitivity Analysis Break-even analysis and decision-making
Break-even Analysis
Break-Even Analysis

Alemu L. Project Identi cation....
Sensitivity Analysis Break-even analysis and decision-making
Break-even Analysis
Break-even Analysis and Decision-making
Sensitivity Analysis Break-even analysis and decision-making
Break-even Analysis
Break-even Analysis and Decision-making

Alemu L. Project Identi cation....
Suppose XYZ Company is considering a project with the following
cash ows and discount rate of 8%.
Year Variable costs Cash in
flows
Net cash
f l ows
1 (2000000) 6500000 4500000
2 (2000000) 6500000 4500000
Cash ows arise from selling 650,000 units at ETB10 per unit.
Required: Measure the sensitivity of the project to changes in
variables for initial investment cost of 7000000.
A product currently sells for Birr 12 per unit. The variable costs are
Birr 4 per unit, and 10,000 units are sold annually and a pro t of
Birr 30,000 is realized per year. A new design will increase the
variable costs by 20% and Fixed Costs by 10% but sales will
increase to 12,000 units per year. (a) At what selling price do we
break even, and (b) If the selling price is to be kept same (Birr
12/unit) what will the annual pro t be?
Sensitivity Analysis Break-even analysis and decision-making
Break-even Analysis
Chapter Review Exercises
1
2
Secure Best Marks with AI Grader
Need help grading? Try our AI Grader for instant feedback on your assignments.

Alemu L. Project Identi cation....
Simulation Concepts and
Methods
Thanks!!
Sensitivity Analysis
Break-even Analysis Break-even analysis and decision-making
Next
Simulation Concepts and
Methods
Thanks!!
Sensitivity Analysis
Break-even Analysis Break-even analysis and decision-making
Next
1 out of 35
Related Documents

Your All-in-One AI-Powered Toolkit for Academic Success.
+13062052269
info@desklib.com
Available 24*7 on WhatsApp / Email
Unlock your academic potential
© 2024 | Zucol Services PVT LTD | All rights reserved.