Financial Management: CAPM, CML, Sensitivity & Scenario Analysis
VerifiedAdded on 2020/01/28
|10
|2660
|36
Report
AI Summary
This report delves into the core concepts of financial management, focusing on the practical application of various tools and techniques. It begins by defining and explaining sensitivity and scenario analysis within the context of capital budgeting, emphasizing their role in evaluating the impact of variables on project profitability and investment decisions. The report then transitions to comparing and contrasting the capital asset pricing model (CAPM) and the capital market line (CML), highlighting their similarities in providing a framework for investment decision-making based on the required rate of return and their differences in risk measurement and application. Through detailed analysis, the report provides a comprehensive overview of financial management, aiding in understanding the complexities of investment evaluation and risk assessment.

Financial Management
Paraphrase This Document
Need a fresh take? Get an instant paraphrase of this document with our AI Paraphraser

Table of Contents
INTRODUCTION...........................................................................................................................3
Question 1: Explaining sensitivity and scenario analysis in the context of capital budgeting
tools..............................................................................................................................................3
Question 2: Explaining similarities and differences between capital asset pricing model and
capital market line........................................................................................................................5
CONCLUSION................................................................................................................................7
REFERENCES................................................................................................................................9
INTRODUCTION
Financial management is highly concerned with making optimum use of financial
resources with the aim to fulfill organizational goals and objectives. In the dynamic business
environment company can attain success only when it takes suitable investment decisions by
evaluating all the alternatives. In the business unit, higher management has responsibility to
build competent and strategic financial framework by evaluating market trends. Hence, by
employing several financial tools and techniques business entity can assess the project which
proves to be beneficial for them. In this, the present report will develop understanding about
capital asset pricing model and market line. Further, it will also shed light on the extent to which
capital budgeting tools are linked with sensitivity analysis.
Question 1: Explaining sensitivity and scenario analysis in the context of capital budgeting tools
Sensitivity analysis:
It may be defined as a tool or technique which in turn helps in assessing the extent to
which independent variables have an impact of dependent factors. Hence, by conducting
sensitivity analysis investors can determine the manner in which changes take place in variable
have an impact on outcome (Sensitivity analysis,2017). In this way, by doing sensitivity analysis
relationship between input and output variables can be determined by investors in the best
possible way.
In the present era, sensitivity analysis is conducted by the business organizations with the
aim to make highly effectual corporate decisions. Hence, a decision which is taken on the basis
of sensitivity is closely related with the capita budgeting decisions. Moreover, capital budgeting
may be served as a financial tool or process which in turn helps company in making decision
that whether they need to invest money in certain project or not (Van Horne, 2010). Investment
appraisal techniques help in determining the revenue or profit which will be generated by firm or
investors from several alternative options. In this way, NPV, payback period, IRR and ARR are
the most effectual tools which help in evaluating the viability and profitability of investment
proposals. NPV method of capital budgeting provides deeper insight about the return that will be
⊘ This is a preview!⊘
Do you want full access?
Subscribe today to unlock all pages.
Trusted by 1+ million students worldwide
generated by firm over the time frame. In this, analysts discounts al the cash flows by
considering suitable discounting factor. This method offers highly realistic solution by taking
into consideration the time value of money and thereby helps in decision making. On the other
side, internal rate of return furnishes information about the return associated with investment
options in terms of percentage (Christensen, Hail and Leuz, 2016). In this way, tools and
techniques of investment appraisal help in selecting suitable project out of several.
However, there are mainly two aspects which in turn creates problem in assessing
profitability of project. Such two factors include cost of capital and cash flows estimated by firm.
Moreover, if business organization or investors fail to make proper estimation of cash flows then
it may result into unrealistic framework. Further, inappropriate discounting factor also influence
the output negatively. In this regard, sensitivity analysis assists company in analyzing the
profitability aspect to the large extent (Yalcin, 2016). Scenario analysis is considered as what-if
analysis which in turn helps in assessing or evaluating the future outcomes. Hence, by taking
into consideration such aspects it can be said through the means of sensitivity analysis company
can assess the impact of critical and non-critical factors on organizational profitability.
Thus, sensitivity analysis tool helps in identifying the extent to which changing variables
and underlying assumptions have an impact on annual cash flow or profitability aspect of
project. Such analysis helps in appraising a project in an effectual way before employing into it.
Hence, by evaluating the changes that take place in input and output business organization can
make suitable investment decision. For instance: Company has an investment proposal with the
cash flows of £500, £1000 & £1000 in each year. Such proposal has an initial investment of
£2500 which will be recouped by firm within the period of three years. On the other side, in real
life project has offered high level of return to the business entity as compared to expected
aspects. Company has generated £2000 in second and third year. In this way, by conducting
analysis organization can analyze the return which will be generated by it over the specified time
frame.
Scenario analysis: This method helps in analyzing decisions by making evaluation of all
the possible alternative outcomes. Hence, through the means of scenario analysis company can
evaluate consequences of each action. In this, by analyzing the different set of variables business
unit can select suitable proposal. By using such technique company can assess the manner in
Paraphrase This Document
Need a fresh take? Get an instant paraphrase of this document with our AI Paraphraser
which net present value differs in varied business situations. Moreover, economic condition such
as inflation and deflation etc has high level of impact on the profit generated by firm during the
year. Thus, by taking into consideration the specific scenario or situation corporation can
determine its impact on profitability. Such framework helps company in making decision by
conducting analysis of each possible future event.
In the dynamic business environment, scenario analysis is the most effectual tools which
in turn help company in determining the impact of potential situations. Moreover, inflation and
deflation are the major economic conditions that have high level of impact on the purchasing
power of customers (Van Horne, 2010). This aspect shows that economic condition closely
influences the demand for the products or services and thereby sales revenue of firm. Hence, by
evaluating the cash flow of potential investment under both inflation and deflationary situation
company can select suitable project. By this, uncertainty can be managed by the business
organization more effectively and efficiently.
There are mainly three different scenarios such as base, worst and best. If all things are
normally proceeds then it is considered as expected outcome. On the other side, worst side is
considered as less favorable conditions (Trinh, Karki and Ghimire, 2016). Besides this, best
condition entails that scenario which is undertaken will offer favorable return to firm in the near
future. In this way, by evaluating several conditions manager can employ money in highly
appropriate projects.
Question 2: Explaining similarities and differences between capital asset pricing model and
capital market line
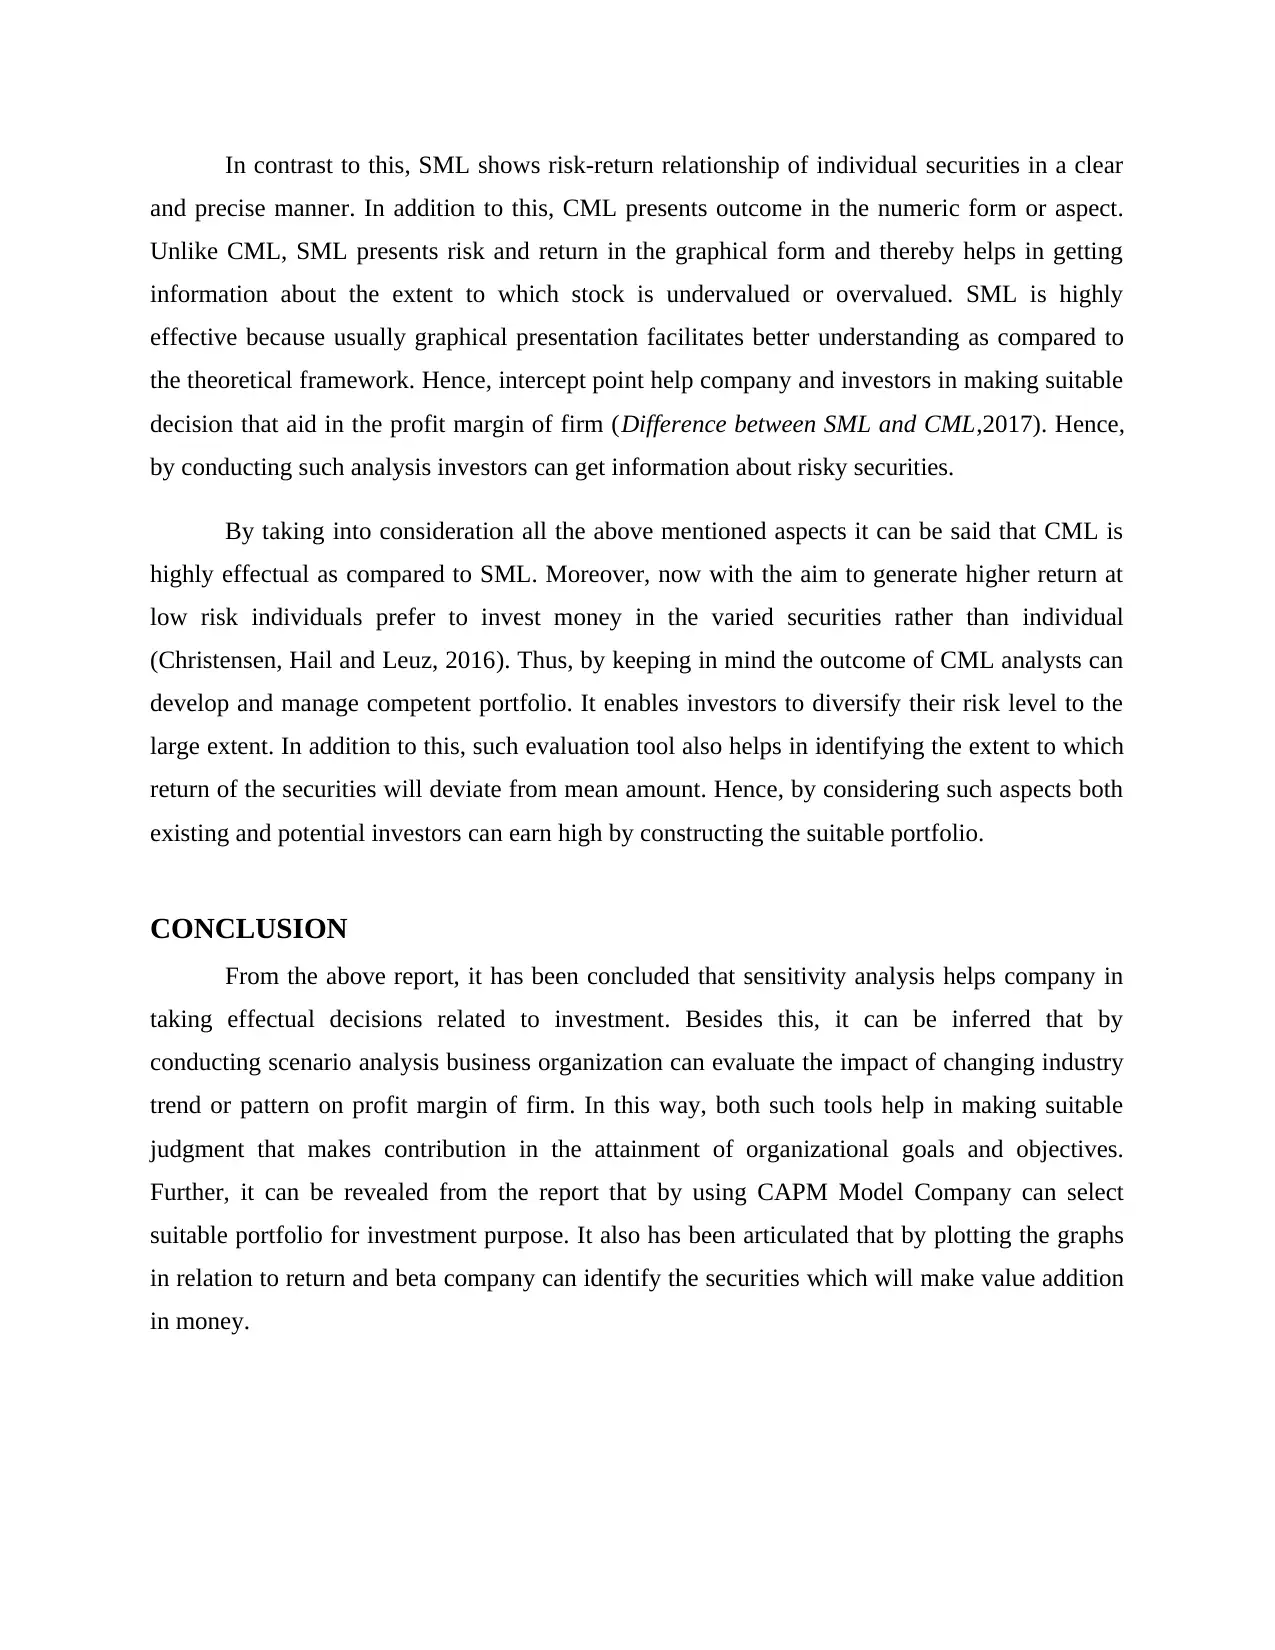
Capital asset pricing model (CAPM): This model provides deeper insight about the expected
return that is associated with the equity aspect of individual company. Hence, it entails the return
that investors need to generate in against to the risk taken by them. In this way, by considering
the beta co-efficient and risk free rate business entity and investor can determine the required
rate of return (Leese, 2016). In this way, such model provides high level of assistance to the
investors in making highly suitable and profitable investment decisions. On the basis of such
model investors need to employ money in portfolio which offers higher or similar return assessed
through CAM model.
as inflation and deflation etc has high level of impact on the profit generated by firm during the
year. Thus, by taking into consideration the specific scenario or situation corporation can
determine its impact on profitability. Such framework helps company in making decision by
conducting analysis of each possible future event.
In the dynamic business environment, scenario analysis is the most effectual tools which
in turn help company in determining the impact of potential situations. Moreover, inflation and
deflation are the major economic conditions that have high level of impact on the purchasing
power of customers (Van Horne, 2010). This aspect shows that economic condition closely
influences the demand for the products or services and thereby sales revenue of firm. Hence, by
evaluating the cash flow of potential investment under both inflation and deflationary situation
company can select suitable project. By this, uncertainty can be managed by the business
organization more effectively and efficiently.
There are mainly three different scenarios such as base, worst and best. If all things are
normally proceeds then it is considered as expected outcome. On the other side, worst side is
considered as less favorable conditions (Trinh, Karki and Ghimire, 2016). Besides this, best
condition entails that scenario which is undertaken will offer favorable return to firm in the near
future. In this way, by evaluating several conditions manager can employ money in highly
appropriate projects.
Question 2: Explaining similarities and differences between capital asset pricing model and
capital market line
Capital asset pricing model (CAPM): This model provides deeper insight about the expected
return that is associated with the equity aspect of individual company. Hence, it entails the return
that investors need to generate in against to the risk taken by them. In this way, by considering
the beta co-efficient and risk free rate business entity and investor can determine the required
rate of return (Leese, 2016). In this way, such model provides high level of assistance to the
investors in making highly suitable and profitable investment decisions. On the basis of such
model investors need to employ money in portfolio which offers higher or similar return assessed
through CAM model.

(Source: Christensen, Hail and Leuz, 2016)
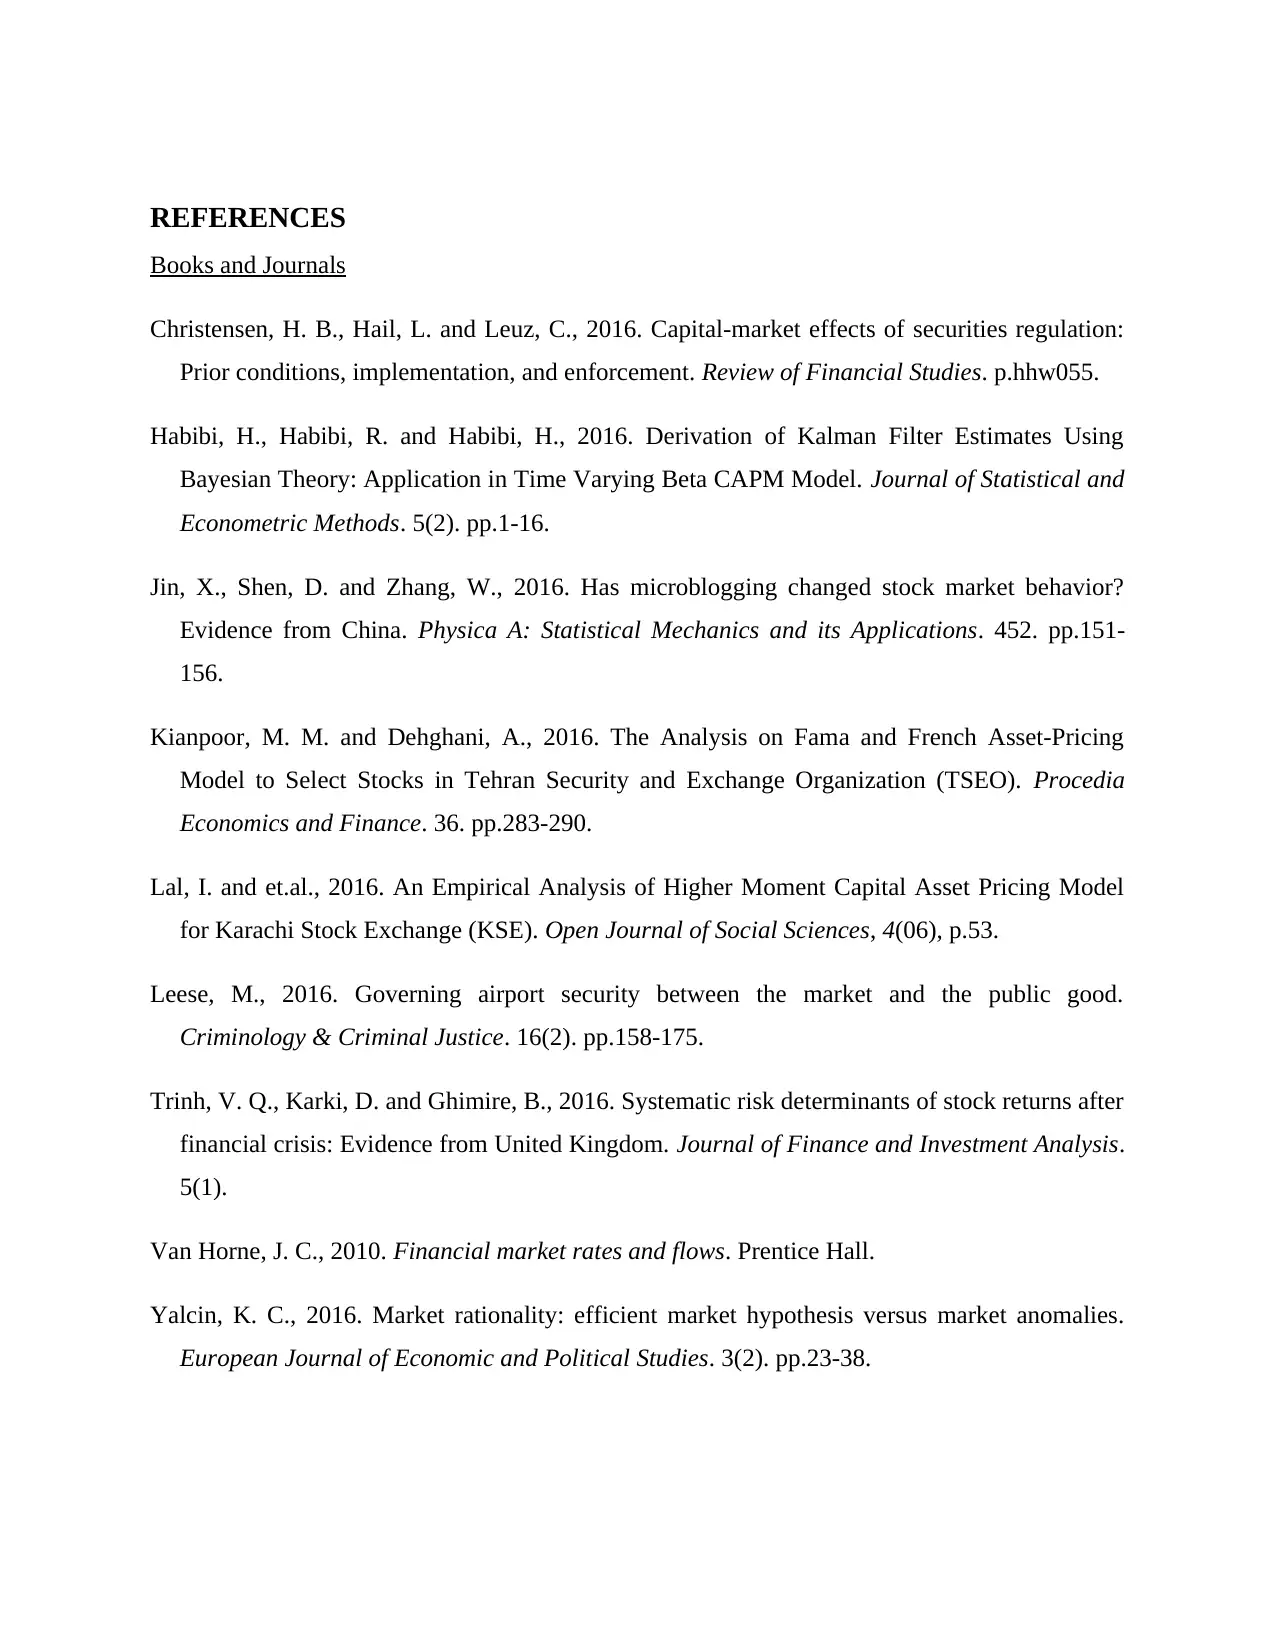
Security or capital market line: It plots returns which are associated with different
securities in against to beta level. This line entails information about expected return on stocks
and volatility aspects. Such investment evaluation tool is based on CAPM model which in turn
helps in determining the risk-return relationship which takes place between different securities.
Hence, such line provides investors with clear picture by considering the time value of money
concept (Lal and et.al., 2016).
Further, such line measures the risk level by considering standard deviation. Along with
this, CML helps in assessing that whether securities are undervalued or overvalued. Security is
considered as undervalued when return which is offered by it is higher than inherent risk. On the
contrary to it, if security line is plotted below CML then it is regarded as overvalued. Such
situation entails that respective security would not offer favorable return to them in against to
risk taken.
⊘ This is a preview!⊘
Do you want full access?
Subscribe today to unlock all pages.
Trusted by 1+ million students worldwide
(Source: Jin, Shen and Zhang, 2016)
Similarities: Both CAPM and CML offers framework for decision making on the basis of
required rate of return. Moreover, beta is a central measure which in turn helps in quantifies the
level of risk. According to such aspect when beta is greater than one then risk level is higher and
vice versa (Kianpoor and Dehghani, 2016). Required return can be assessed by the investors or
analysts through the means of following formula:
Required rate of return = risk free rate of return + Beta (Market return - Rf)
Further, CAPM and CML help investors in analyzing the aspect that whether potential
security will offer favorable return in against to market risk or not. Hence, such aspect shows
similarity between both such models. Another similarity between such two tools is that they help
in making comparison of the return of two similar securities. By considering the outcome of such
analysis investors can select best securities which make value addition in money. Selection or
investment decision which is made by investors on the basis of CML are considered as efficient
portfolios (Jin, Shen and Zhang, 2016). By this, performance of portfolios can be evaluated by
firm more effectively and efficiently. It helps in describing the rate of return which is allied with
the each potential investment. All such aspects clearly show that equity evaluation and
comparison can be made by firm or investors via CAPM and CML. Thus, both such investment
evaluation tools are similar to s the large extent.
Differences:
Along with the similarities CML and SML are differs from each other to some extent.
Under CML risk level is measured and evaluated by scholar through standard deviation. On the
other hand, SML quantifies the risk level by considering beta which in turn helps in evaluating
the volatility level (Habibi, Habibi and Habibi, 2016). Moreover, security market is highly
volatile in nature because changes which take place in external environment have high level of
impact on the prices as well as return of securities. On the other side, CML helps in return of the
portfolio of securities. By this way, analysts can build and maintain profitable investment
portfolio that offer high return to investors.
Paraphrase This Document
Need a fresh take? Get an instant paraphrase of this document with our AI Paraphraser
In contrast to this, SML shows risk-return relationship of individual securities in a clear
and precise manner. In addition to this, CML presents outcome in the numeric form or aspect.
Unlike CML, SML presents risk and return in the graphical form and thereby helps in getting
information about the extent to which stock is undervalued or overvalued. SML is highly
effective because usually graphical presentation facilitates better understanding as compared to
the theoretical framework. Hence, intercept point help company and investors in making suitable
decision that aid in the profit margin of firm (Difference between SML and CML,2017). Hence,
by conducting such analysis investors can get information about risky securities.
By taking into consideration all the above mentioned aspects it can be said that CML is
highly effectual as compared to SML. Moreover, now with the aim to generate higher return at
low risk individuals prefer to invest money in the varied securities rather than individual
(Christensen, Hail and Leuz, 2016). Thus, by keeping in mind the outcome of CML analysts can
develop and manage competent portfolio. It enables investors to diversify their risk level to the
large extent. In addition to this, such evaluation tool also helps in identifying the extent to which
return of the securities will deviate from mean amount. Hence, by considering such aspects both
existing and potential investors can earn high by constructing the suitable portfolio.
CONCLUSION
From the above report, it has been concluded that sensitivity analysis helps company in
taking effectual decisions related to investment. Besides this, it can be inferred that by
conducting scenario analysis business organization can evaluate the impact of changing industry
trend or pattern on profit margin of firm. In this way, both such tools help in making suitable
judgment that makes contribution in the attainment of organizational goals and objectives.
Further, it can be revealed from the report that by using CAPM Model Company can select
suitable portfolio for investment purpose. It also has been articulated that by plotting the graphs
in relation to return and beta company can identify the securities which will make value addition
in money.
REFERENCES
Books and Journals
Christensen, H. B., Hail, L. and Leuz, C., 2016. Capital-market effects of securities regulation:
Prior conditions, implementation, and enforcement. Review of Financial Studies. p.hhw055.
Habibi, H., Habibi, R. and Habibi, H., 2016. Derivation of Kalman Filter Estimates Using
Bayesian Theory: Application in Time Varying Beta CAPM Model. Journal of Statistical and
Econometric Methods. 5(2). pp.1-16.
Jin, X., Shen, D. and Zhang, W., 2016. Has microblogging changed stock market behavior?
Evidence from China. Physica A: Statistical Mechanics and its Applications. 452. pp.151-
156.
Kianpoor, M. M. and Dehghani, A., 2016. The Analysis on Fama and French Asset-Pricing
Model to Select Stocks in Tehran Security and Exchange Organization (TSEO). Procedia
Economics and Finance. 36. pp.283-290.
Lal, I. and et.al., 2016. An Empirical Analysis of Higher Moment Capital Asset Pricing Model
for Karachi Stock Exchange (KSE). Open Journal of Social Sciences, 4(06), p.53.
Leese, M., 2016. Governing airport security between the market and the public good.
Criminology & Criminal Justice. 16(2). pp.158-175.
Trinh, V. Q., Karki, D. and Ghimire, B., 2016. Systematic risk determinants of stock returns after
financial crisis: Evidence from United Kingdom. Journal of Finance and Investment Analysis.
5(1).
Van Horne, J. C., 2010. Financial market rates and flows. Prentice Hall.
Yalcin, K. C., 2016. Market rationality: efficient market hypothesis versus market anomalies.
European Journal of Economic and Political Studies. 3(2). pp.23-38.
⊘ This is a preview!⊘
Do you want full access?
Subscribe today to unlock all pages.
Trusted by 1+ million students worldwide

Online
Difference between SML and CML. 2017. Online. Available through: <
https://www.scribd.com/doc/45596375/What-is-the-Difference-Between-Capital-Market-
Line-and-Security-Market-Line>. [Accessed on 20th January 2017].
Sensitivity analysis. 2017.Online. Available through: < http://xplaind.com/167040/sensitivity-
analysis>. [Accessed on 20th January 2017].
1 out of 10
Related Documents


Your All-in-One AI-Powered Toolkit for Academic Success.
+13062052269
info@desklib.com
Available 24*7 on WhatsApp / Email
![[object Object]](/_next/static/media/star-bottom.7253800d.svg)
Unlock your academic potential
Copyright © 2020–2026 A2Z Services. All Rights Reserved. Developed and managed by ZUCOL.