MN506 - Server Monitoring Tools: Availability & Metrics Analysis
VerifiedAdded on 2023/01/19
|27
|2688
|71
Report
AI Summary
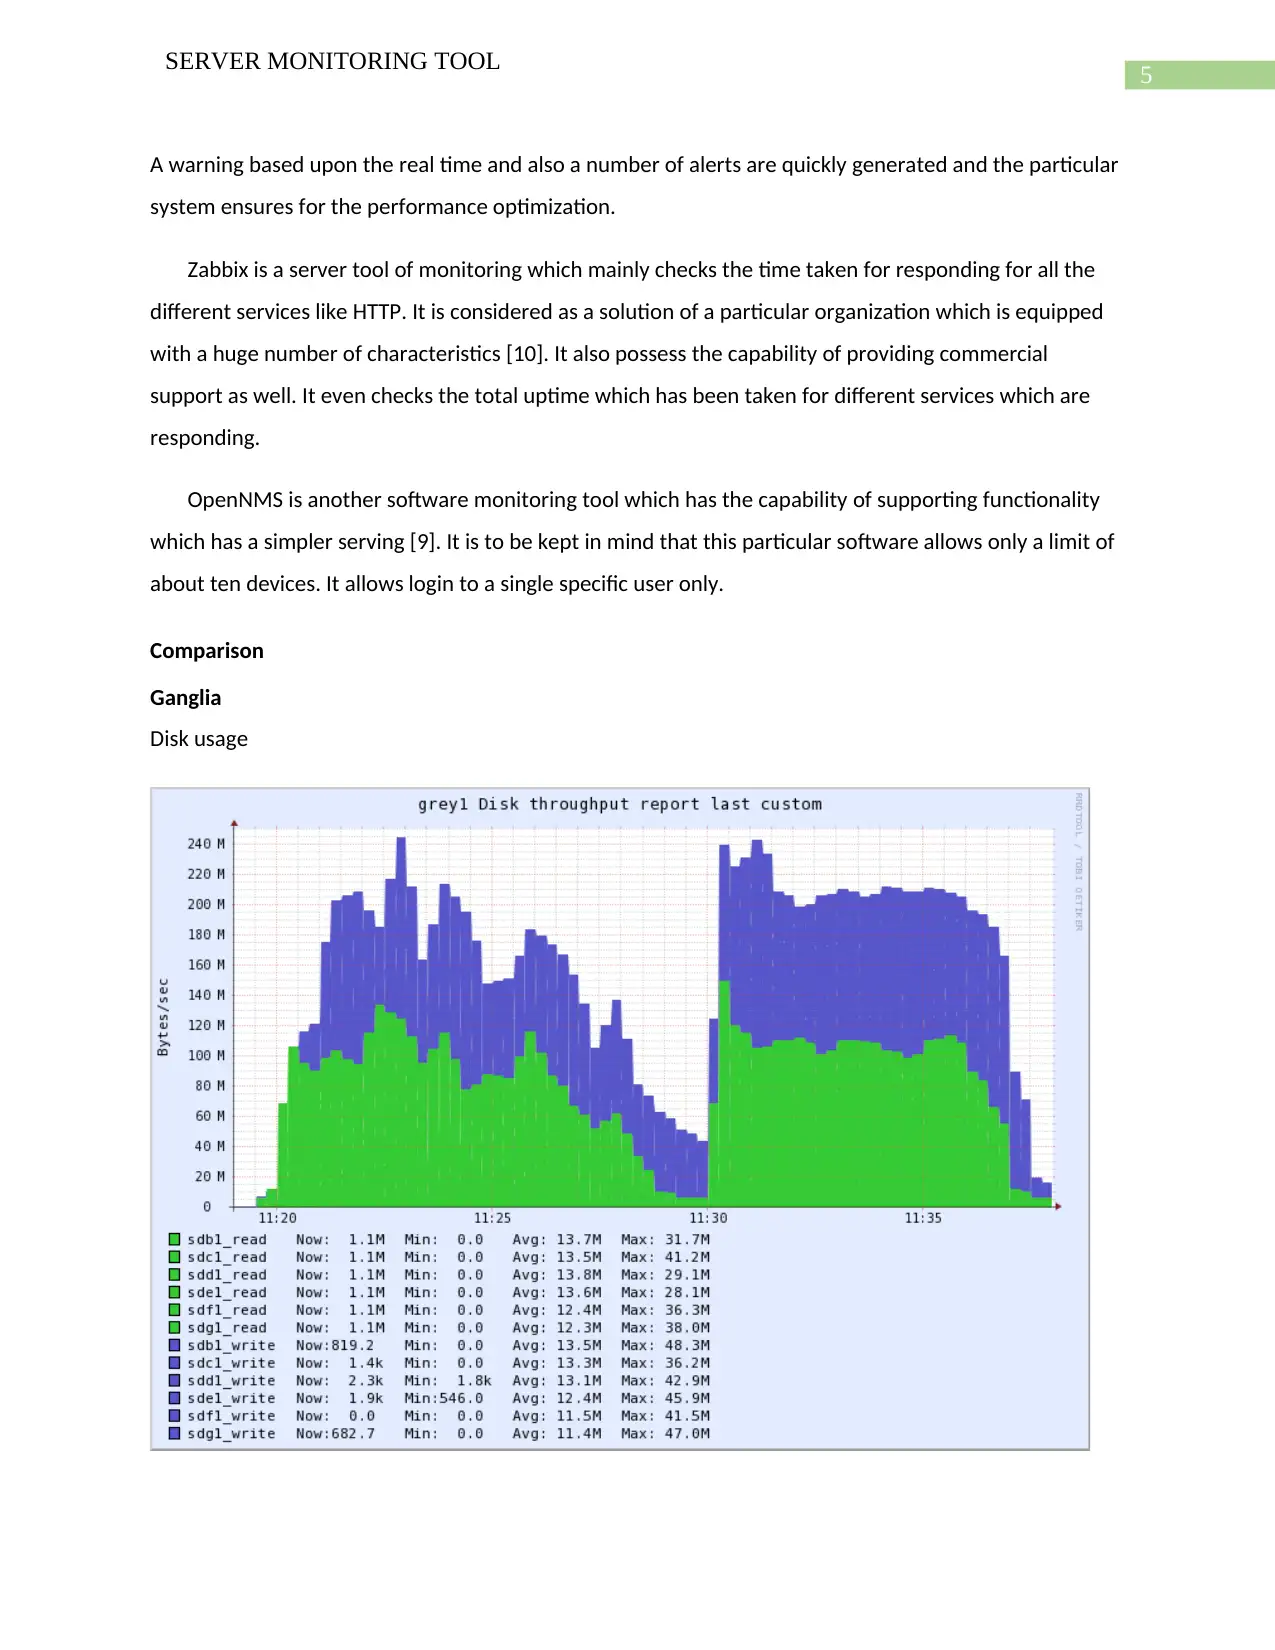
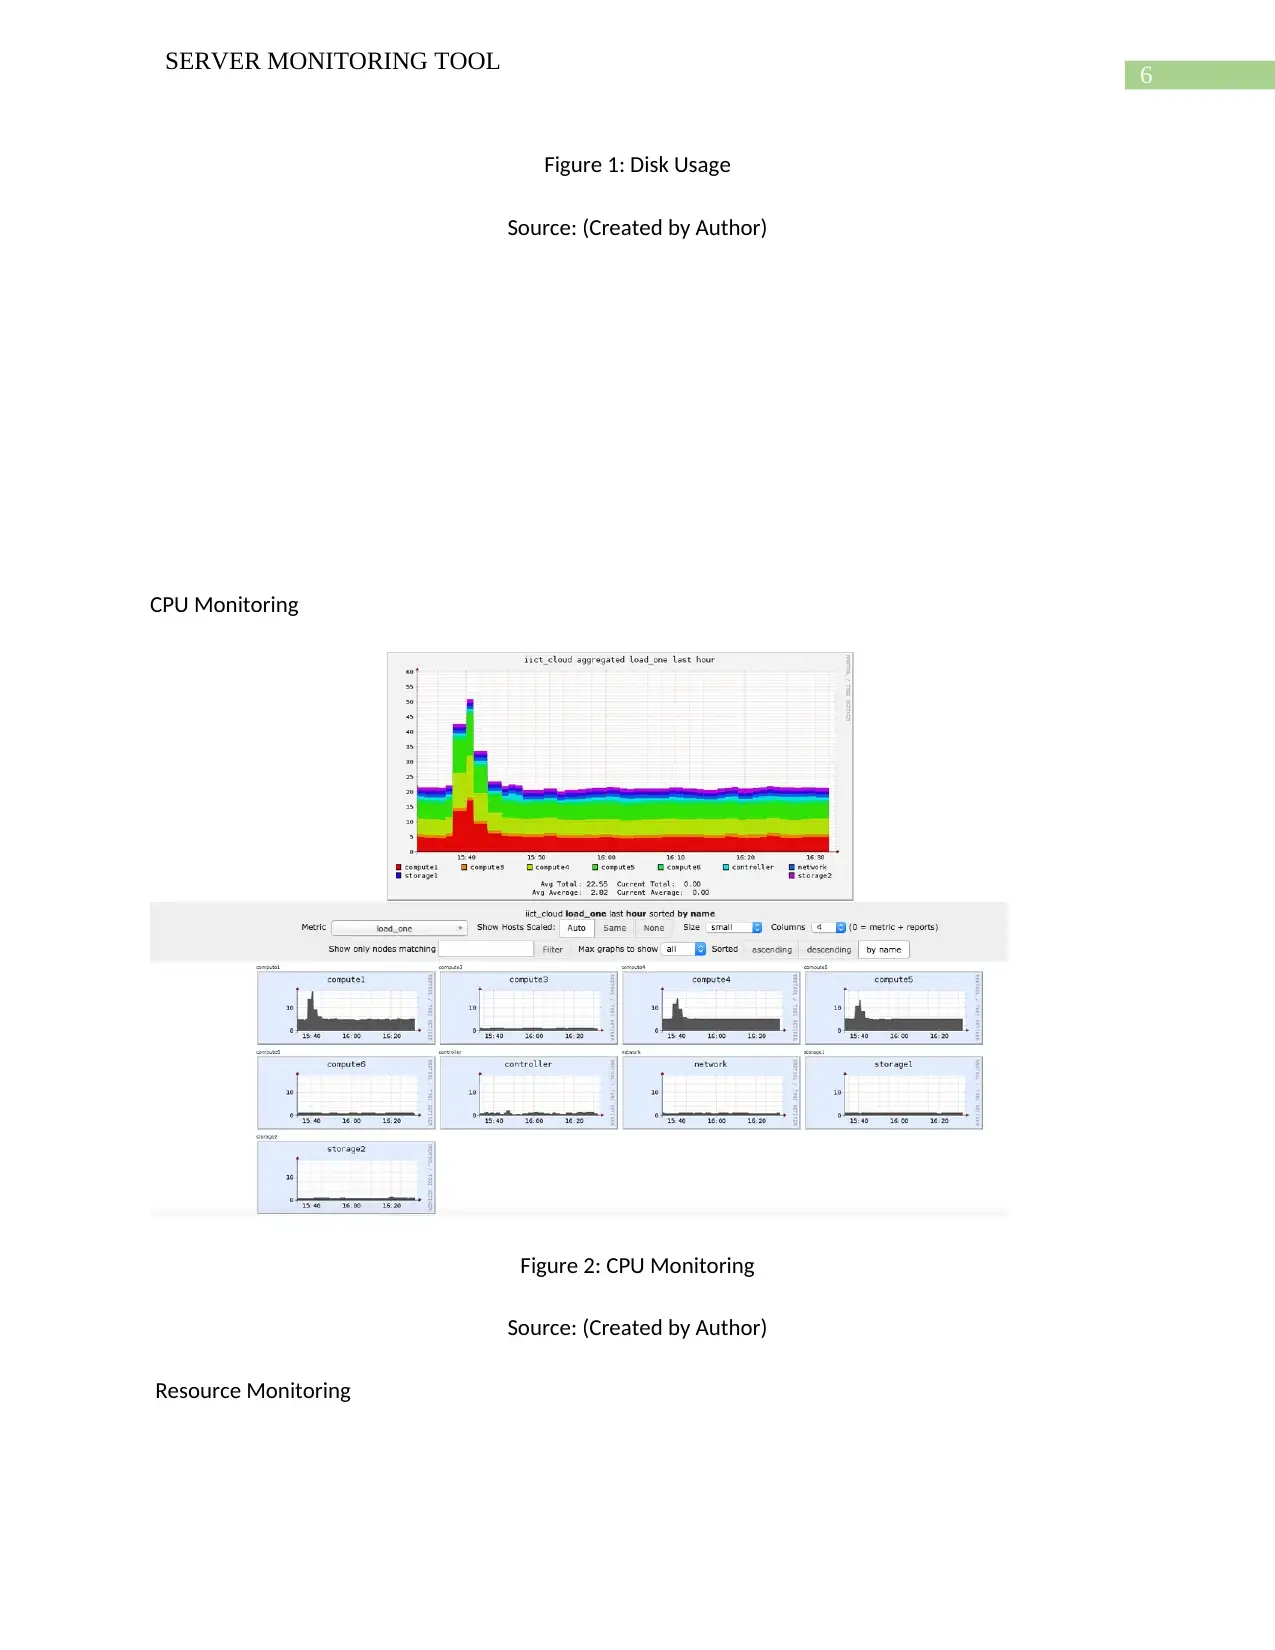
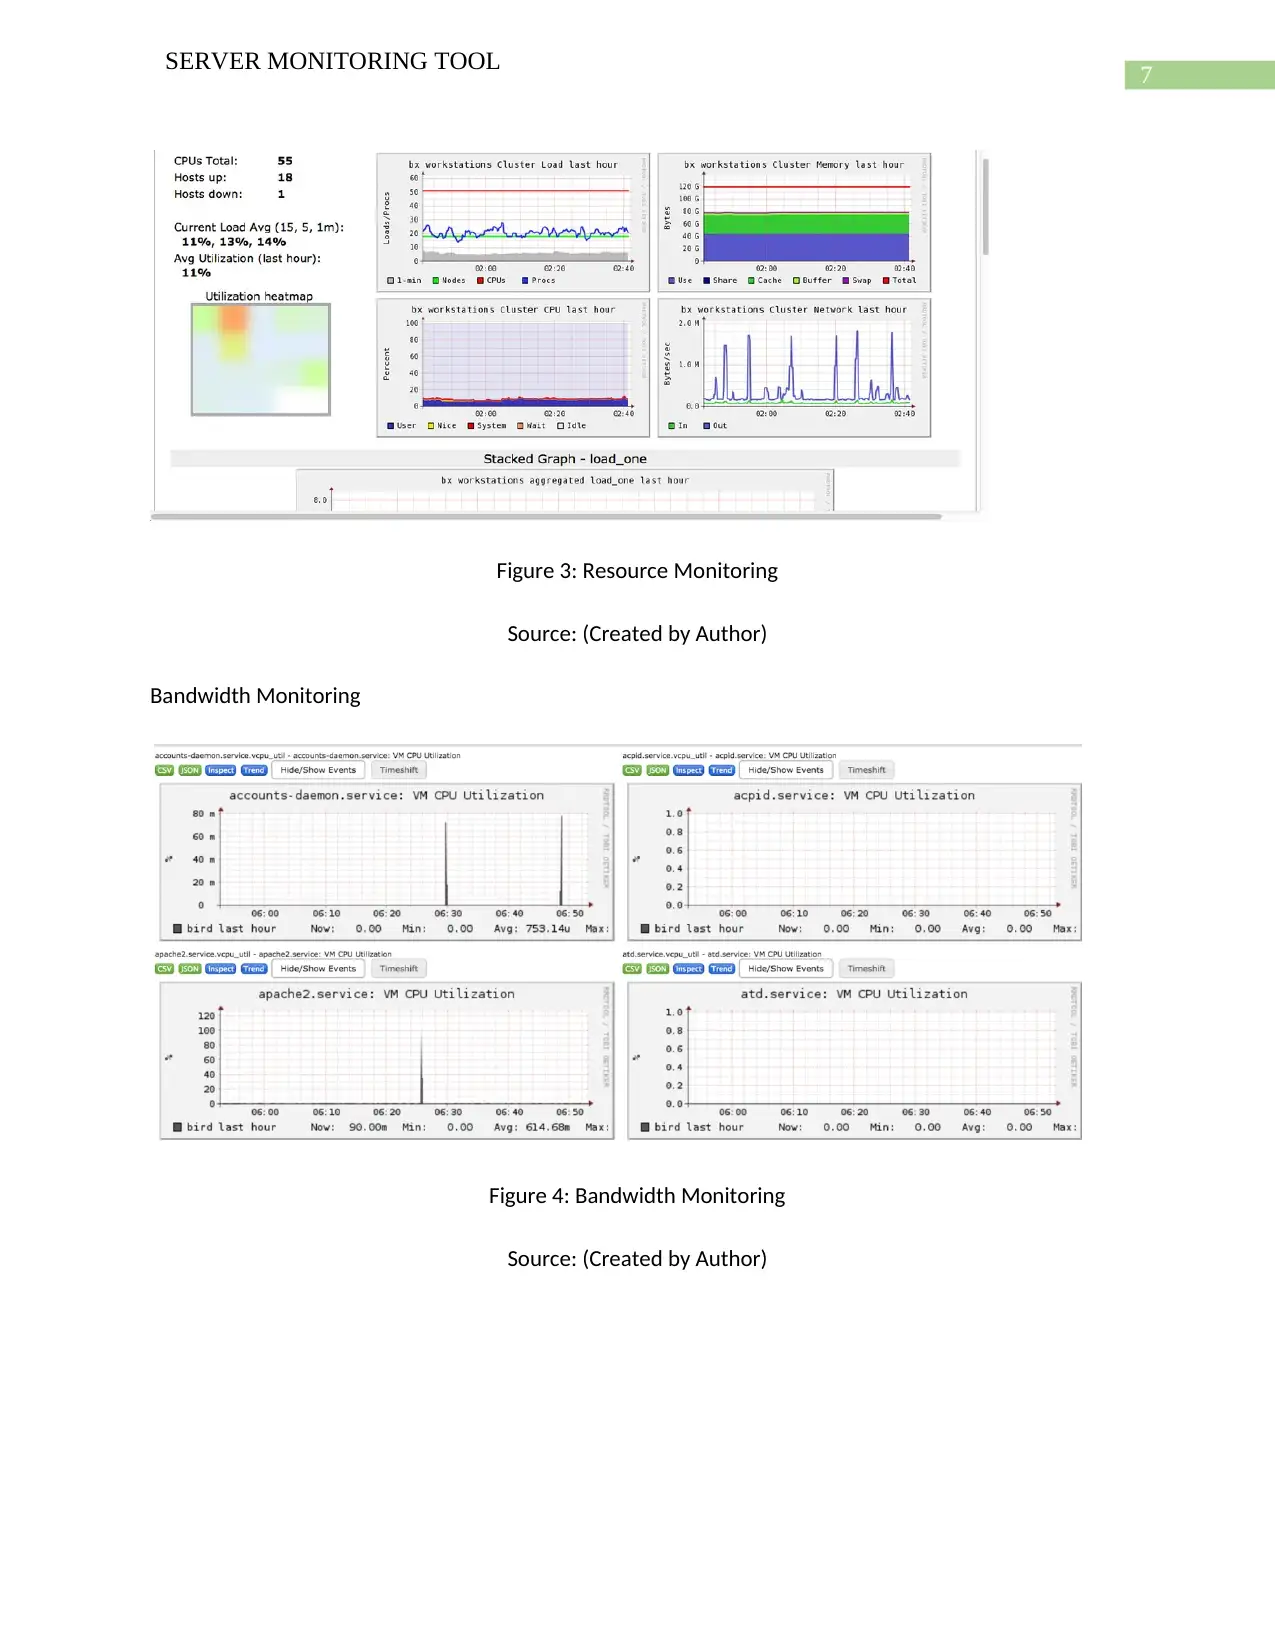
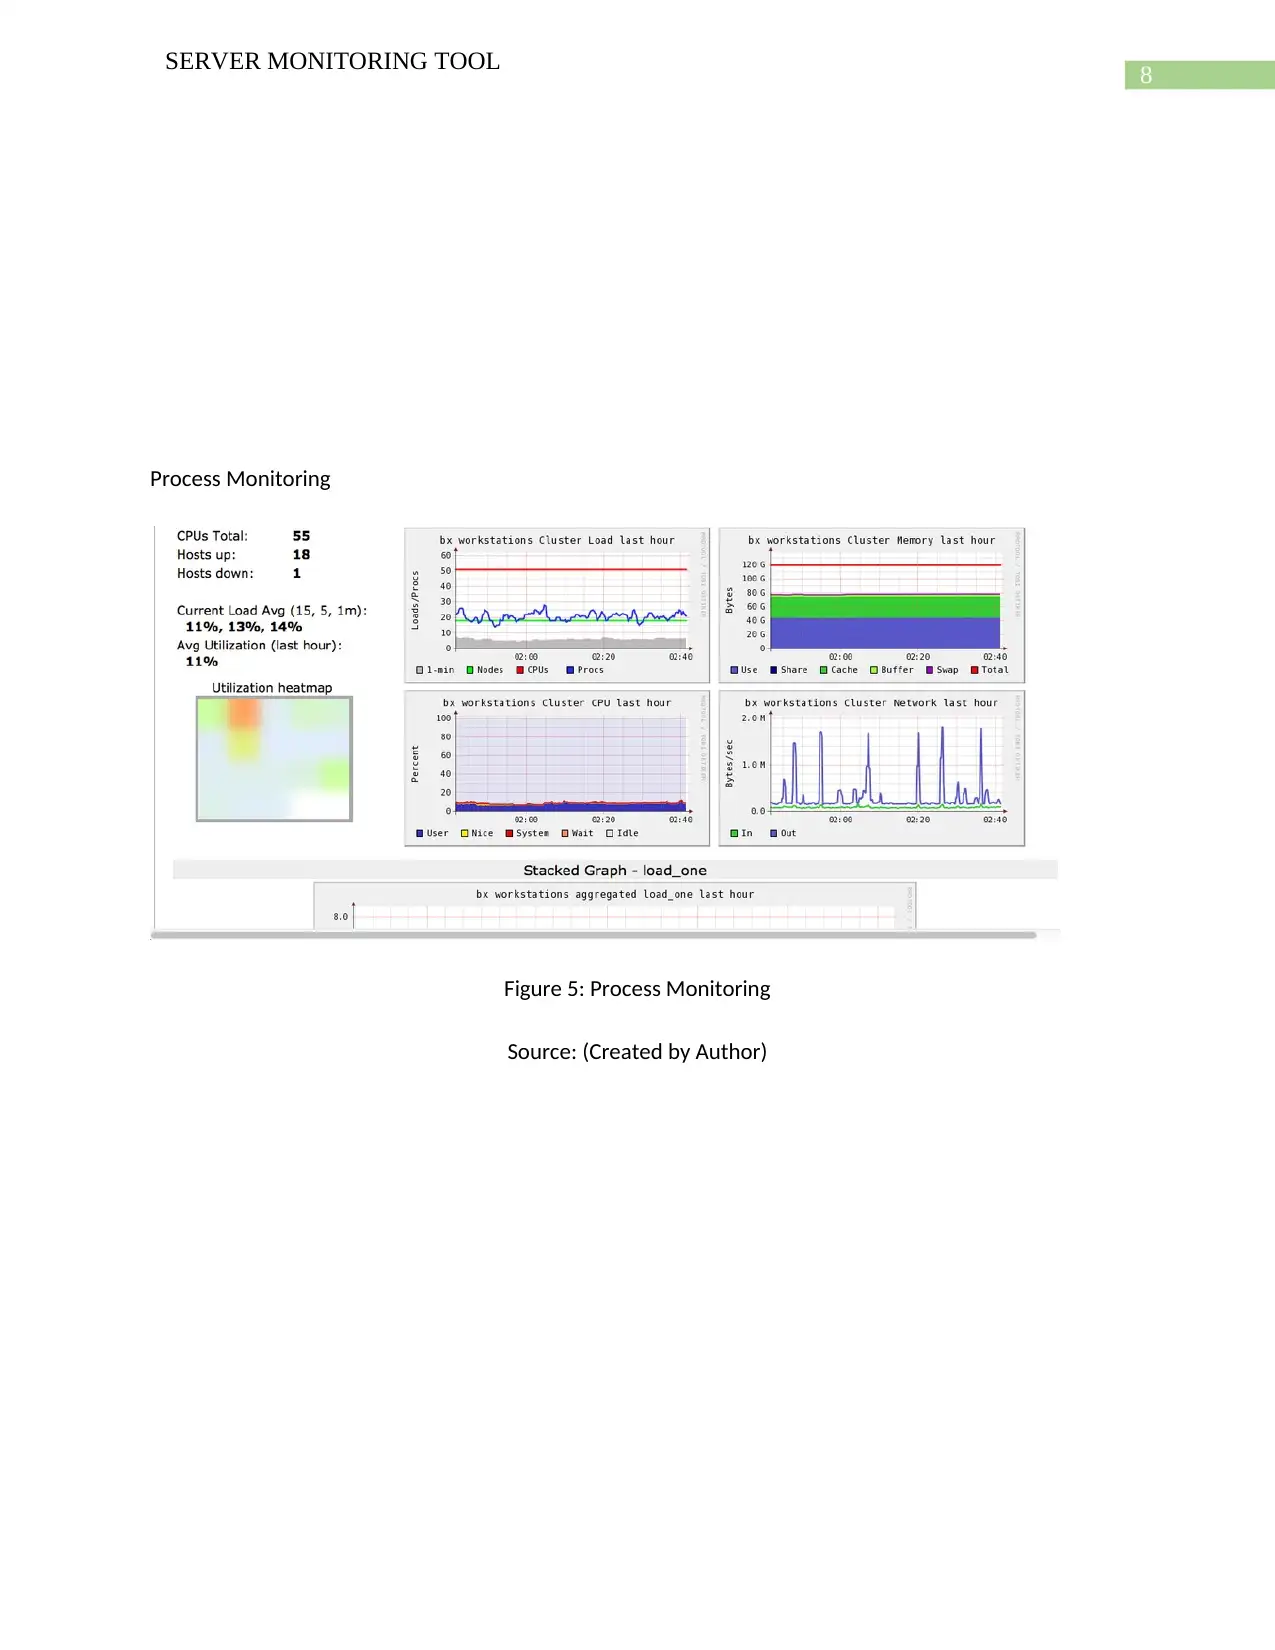
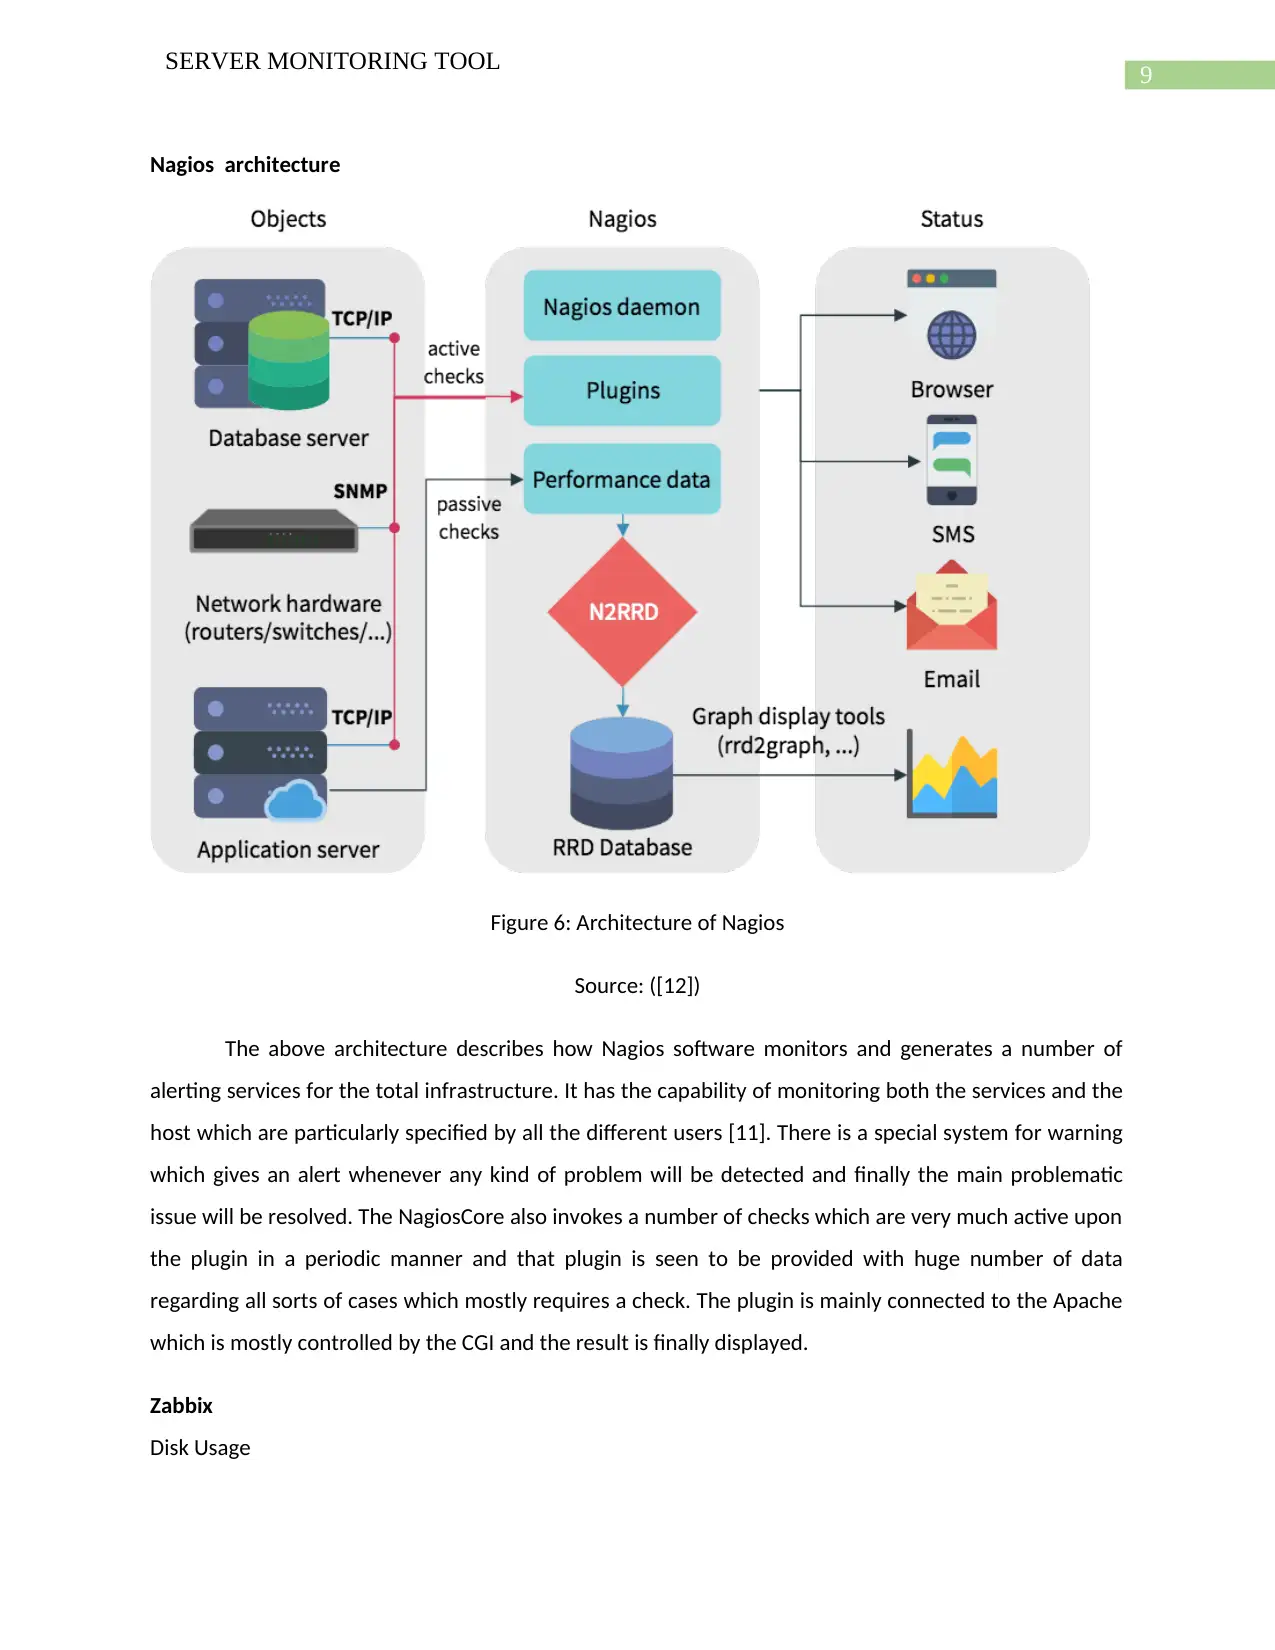
This report provides a comprehensive analysis of server monitoring tools, focusing on their impact on server availability and performance metrics. The report begins with an executive summary and an introduction to server monitoring, emphasizing its importance in system administration. It then delves into various IT infrastructure-monitoring tools, including Ganglia, Nagios Core, Cacti, Zabbix, CollectD, WhatsUp Gold, and others, offering detailed comparisons of their features and functionalities. The report explores the architecture of Nagios and presents comparative visual data on metrics such as disk usage, CPU monitoring, resource monitoring, and bandwidth monitoring for several tools. Furthermore, it discusses data vulnerability issues in server availability monitoring tools and potential solutions, along with failure prediction capabilities. The conclusion summarizes the key findings and highlights the significance of selecting appropriate server monitoring tools for maintaining optimal server performance and ensuring service delivery. The report is a student contribution to Desklib, a platform offering AI-based study tools for students.

Running head: SERVER MONITORING TOOL
SERVER MONITORING TOOL
Name of the Student
Name of the Organization
Author Note
SERVER MONITORING TOOL
Name of the Student
Name of the Organization
Author Note
Paraphrase This Document
Need a fresh take? Get an instant paraphrase of this document with our AI Paraphraser

1
SERVER MONITORING TOOL
Table of Contents
Executive summary.....................................................................................................................................2
Introduction.................................................................................................................................................3
IT Infrastructure-Monitoring Tools..............................................................................................................3
Comparison.................................................................................................................................................5
Ganglia.....................................................................................................................................................5
Nagios architecture....................................................................................................................................9
Zabbix......................................................................................................................................................9
CollectD.................................................................................................................................................14
WhatsUp Gold.......................................................................................................................................18
Server availability monitoring architecture...............................................................................................22
Data vulnerability in server availability monitoring tools and solution.....................................................22
Failure Prediction on server availability monitoring tool...........................................................................23
Conclusion.................................................................................................................................................23
References.................................................................................................................................................24

2
SERVER MONITORING TOOL
Executive summary
The main aim of the report is to discuss about a number of server availability tools of monitoring
which helps in providing a better performance of the server. A number of organizations face a huge
challenge in their server’s operation which is regular. Al the tools of monitoring have the ability to
reduce the latency of the server, device identification, server health improvement and also monitors all
the equipment of the network. The main job of all the tools mostly tries to avoid the server from
crashing down. It also makes sure that a smooth running is presented by the server. All the different
tools help a lot in performing an appropriate monitoring of all the servers.
⊘ This is a preview!⊘
Do you want full access?
Subscribe today to unlock all pages.

Trusted by 1+ million students worldwide

3
SERVER MONITORING TOOL
Introduction
A server is specially a system which mostly provides huge number of data, resources as well as
services to the system of the client over a channel within the network. All the servers to the function are
specially configured for receiving all the requests from the clients obtained from the channel of the
network. The server responds to the request which has been received by it with all the information
which are needed. All the different functions of the server include the special permission for the data
access, identity of the requestor verification and also the process of response formatting. All the
different monitoring tools of server are very much important. They are essential for administrating the
system’s working [1]. There is a reporting which is mainly automated and it has the ability of generating
all the checks which are scheduled and also provide several warnings regarding environment of the
server’s working. All the reports which are mostly generated by the software of monitoring keeps a daily
check upon a number of different activities. There are also a number of logins which are quite
suspicious. There are even utilization of resource and also response time which are needed to be
monitored properly. A huge number of layers are seen in the software of monitoring which has the
capability of following a number of protocols in sync which are aforementioned with a number of
applications which are monitored [3]. Each and every software individually possess a particular method
or rather a protocol which is already predefined for approaching the main problem which has been
faced by the system of server. There is an even a check which is done upon the system degradation by
the software within the particular system which has an impact upon the performance of service delivery
as well as provides improvement in the quality of the system stack as a whole [2].
IT Infrastructure-Monitoring Tools
Different IT server monitoring tools are as follows [3]:
Ganglia
Nagios Core
Cacti
Zabbix
CollectD
Icinga
Spiceworks
OpenNMS and
Paraphrase This Document
Need a fresh take? Get an instant paraphrase of this document with our AI Paraphraser

4
SERVER MONITORING TOOL
WhatsUp Gold.
Ganglia is a special software which has been designed for all the different systems of computer
possessing high speed of the performance. It is a particular software of monitoring having its source
open [4]. The system’s architecture is huge distributed. It is seen to be based upon a particular design
which is mostly hierarchical having its main target upon the cluster federation. This particular tool helps
a lot in providing support to all the microprocessors. It even provides support to the operating system as
well.
Nagios Core is also another monitoring tool which has its source open [6]. It is both cost effective as
well as customizable and all the metrics which are particularly offered by this tool mainly monitors the
server’s performance. The core part mainly provides a very limited number of features of monitoring.
Spiceworks is another monitoring tool of server which in mainly written upon the rails in Ruby. This
particular tool searches for all the devices of IP addressing and even offers a base of the knowledge. It
even offers with a number of insights into all the devices of SNMP, services as well as switches.
Cacti is particularly a front ended tool possessing with the capacity of managing collection of data.
Data gathering occurs by the utilization of a particular script which is mainly external which actually feed
all the metrics [5]. It is rather a tool of graphing for the system of data which has the capability of
generating a number of graphs for any type of data set which has been provided. All these graphs can be
created from a particular element of the infrastructure involving both the balancers of load and also the
servers.
CollectD is mainly a software which can be used in a number of different operating systems and it
mainly seeks and clearly identifies all the bottlenecks within the performance. It also has the ability to
predict the overtime of load within the system and also generates an alert. This particular software can
be integrated with a tool of graphing. It stores al the collected data in a number of formats like the files
of RRD.
Icinga is a software which provides a full new attribute of API which is known as REST API which
allows integration of a number of extensions very easily [7]. All these extensions do not require any type
of change in the core at all directly. It can be considered as an extension of Nagios.
WhatsUp Gold is a particular software which mostly provides an interactive map which is quite
comprehensive. The interactive map is actually about the entire infrastructure of the entire network [8].

5
SERVER MONITORING TOOL
A warning based upon the real time and also a number of alerts are quickly generated and the particular
system ensures for the performance optimization.
Zabbix is a server tool of monitoring which mainly checks the time taken for responding for all the
different services like HTTP. It is considered as a solution of a particular organization which is equipped
with a huge number of characteristics [10]. It also possess the capability of providing commercial
support as well. It even checks the total uptime which has been taken for different services which are
responding.
OpenNMS is another software monitoring tool which has the capability of supporting functionality
which has a simpler serving [9]. It is to be kept in mind that this particular software allows only a limit of
about ten devices. It allows login to a single specific user only.
Comparison
Ganglia
Disk usage
⊘ This is a preview!⊘
Do you want full access?
Subscribe today to unlock all pages.

Trusted by 1+ million students worldwide

6
SERVER MONITORING TOOL
Figure 1: Disk Usage
Source: (Created by Author)
CPU Monitoring
Figure 2: CPU Monitoring
Source: (Created by Author)
Resource Monitoring
SERVER MONITORING TOOL
Figure 1: Disk Usage
Source: (Created by Author)
CPU Monitoring
Figure 2: CPU Monitoring
Source: (Created by Author)
Resource Monitoring
Paraphrase This Document
Need a fresh take? Get an instant paraphrase of this document with our AI Paraphraser

7
SERVER MONITORING TOOL
Figure 3: Resource Monitoring
Source: (Created by Author)
Bandwidth Monitoring
Figure 4: Bandwidth Monitoring
Source: (Created by Author)
SERVER MONITORING TOOL
Figure 3: Resource Monitoring
Source: (Created by Author)
Bandwidth Monitoring
Figure 4: Bandwidth Monitoring
Source: (Created by Author)

8
SERVER MONITORING TOOL
Process Monitoring
Figure 5: Process Monitoring
Source: (Created by Author)
SERVER MONITORING TOOL
Process Monitoring
Figure 5: Process Monitoring
Source: (Created by Author)
⊘ This is a preview!⊘
Do you want full access?
Subscribe today to unlock all pages.

Trusted by 1+ million students worldwide

9
SERVER MONITORING TOOL
Nagios architecture
Figure 6: Architecture of Nagios
Source: ([12])
The above architecture describes how Nagios software monitors and generates a number of
alerting services for the total infrastructure. It has the capability of monitoring both the services and the
host which are particularly specified by all the different users [11]. There is a special system for warning
which gives an alert whenever any kind of problem will be detected and finally the main problematic
issue will be resolved. The NagiosCore also invokes a number of checks which are very much active upon
the plugin in a periodic manner and that plugin is seen to be provided with huge number of data
regarding all sorts of cases which mostly requires a check. The plugin is mainly connected to the Apache
which is mostly controlled by the CGI and the result is finally displayed.
Zabbix
Disk Usage
Paraphrase This Document
Need a fresh take? Get an instant paraphrase of this document with our AI Paraphraser

10
SERVER MONITORING TOOL
Figure 7: Disk Usage
Source: (Created by Author)
Process Monitoring
SERVER MONITORING TOOL
Figure 7: Disk Usage
Source: (Created by Author)
Process Monitoring

11
SERVER MONITORING TOOL
Figure 8: Process Monitoring
Source: (Created By Author)
CPU Monitoring
Figure 9: CPU Monitoring
Source: (Created By Author)
SERVER MONITORING TOOL
Figure 8: Process Monitoring
Source: (Created By Author)
CPU Monitoring
Figure 9: CPU Monitoring
Source: (Created By Author)
⊘ This is a preview!⊘
Do you want full access?
Subscribe today to unlock all pages.

Trusted by 1+ million students worldwide
1 out of 27
Related Documents

Your All-in-One AI-Powered Toolkit for Academic Success.
+13062052269
info@desklib.com
Available 24*7 on WhatsApp / Email
Unlock your academic potential
Copyright © 2020–2025 A2Z Services. All Rights Reserved. Developed and managed by ZUCOL.