University Report: MN506 Server Availability Monitoring Assignment

Verified

Added on  2023/02/01

|31
|3202
|26
Report
AI Summary
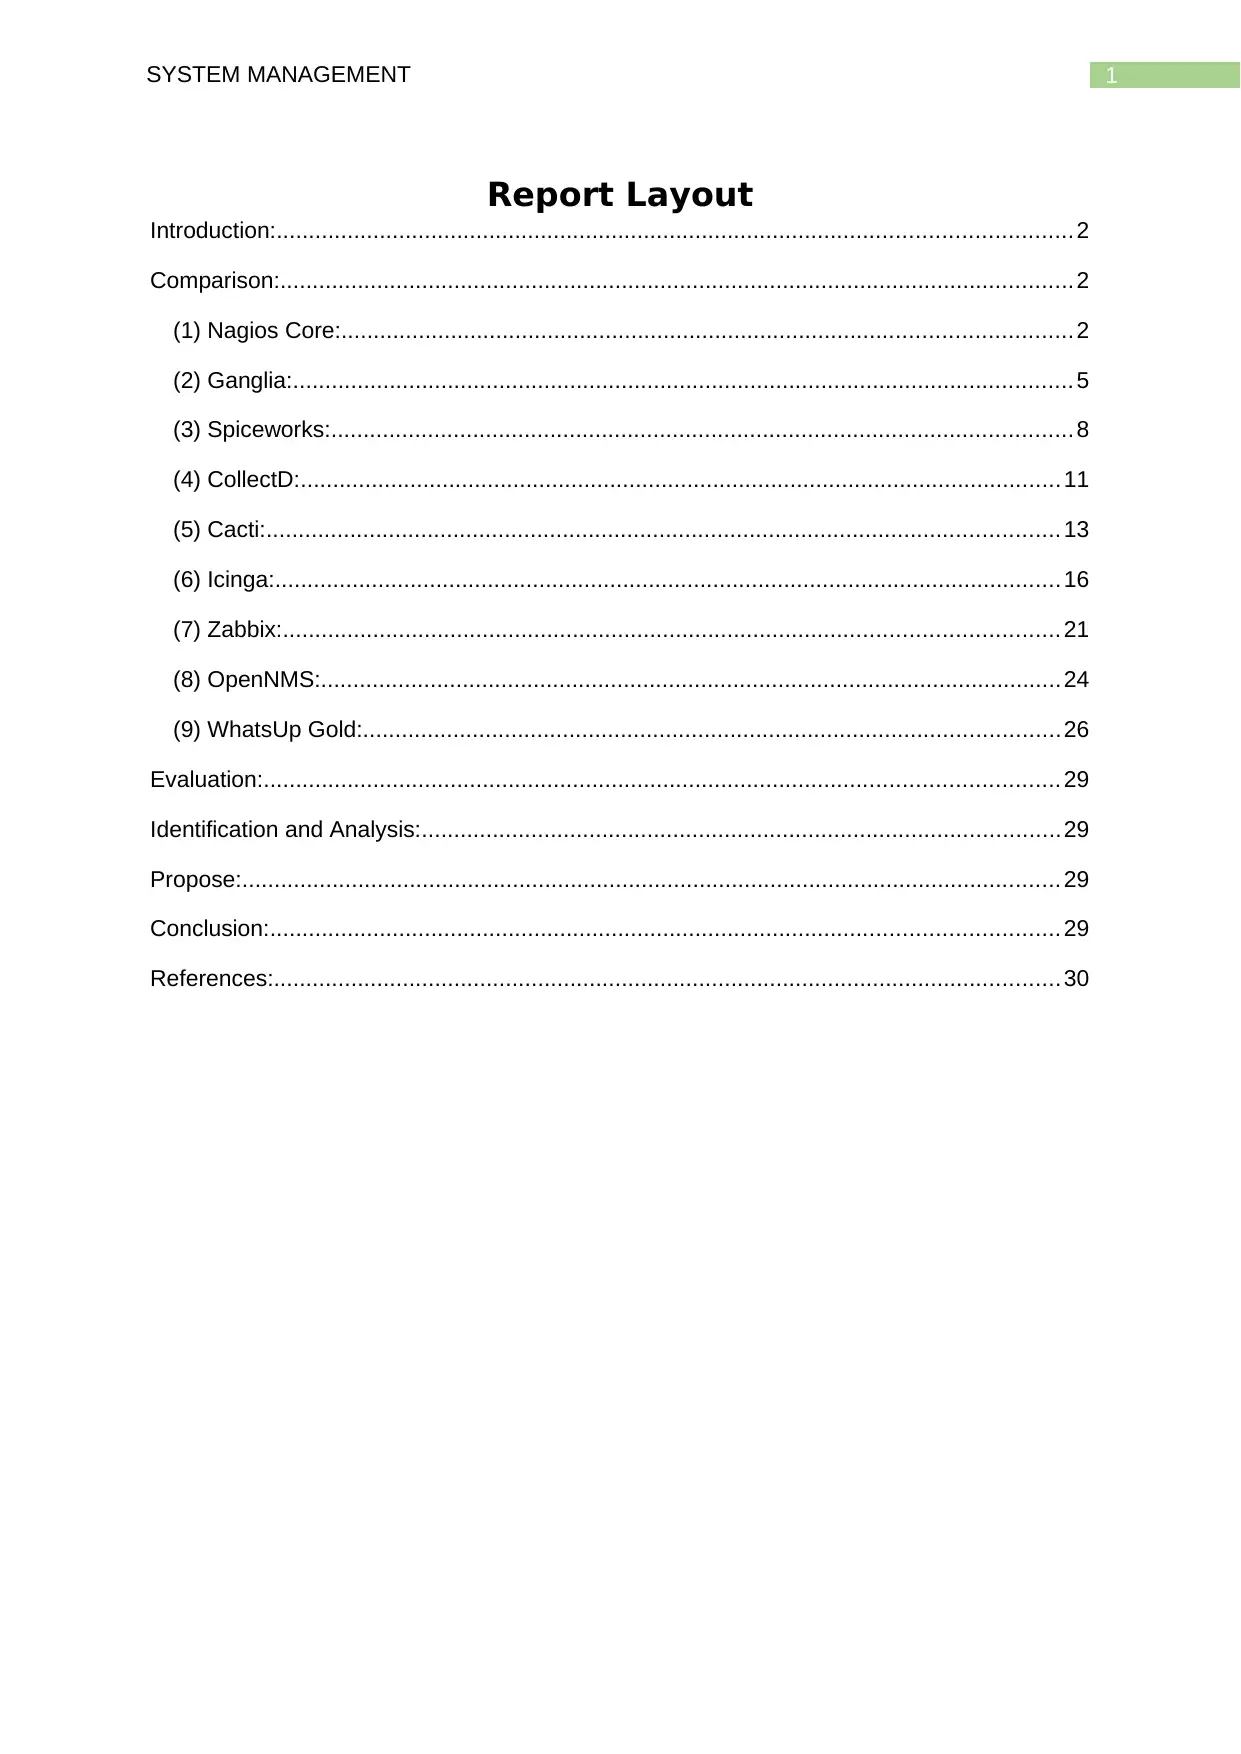
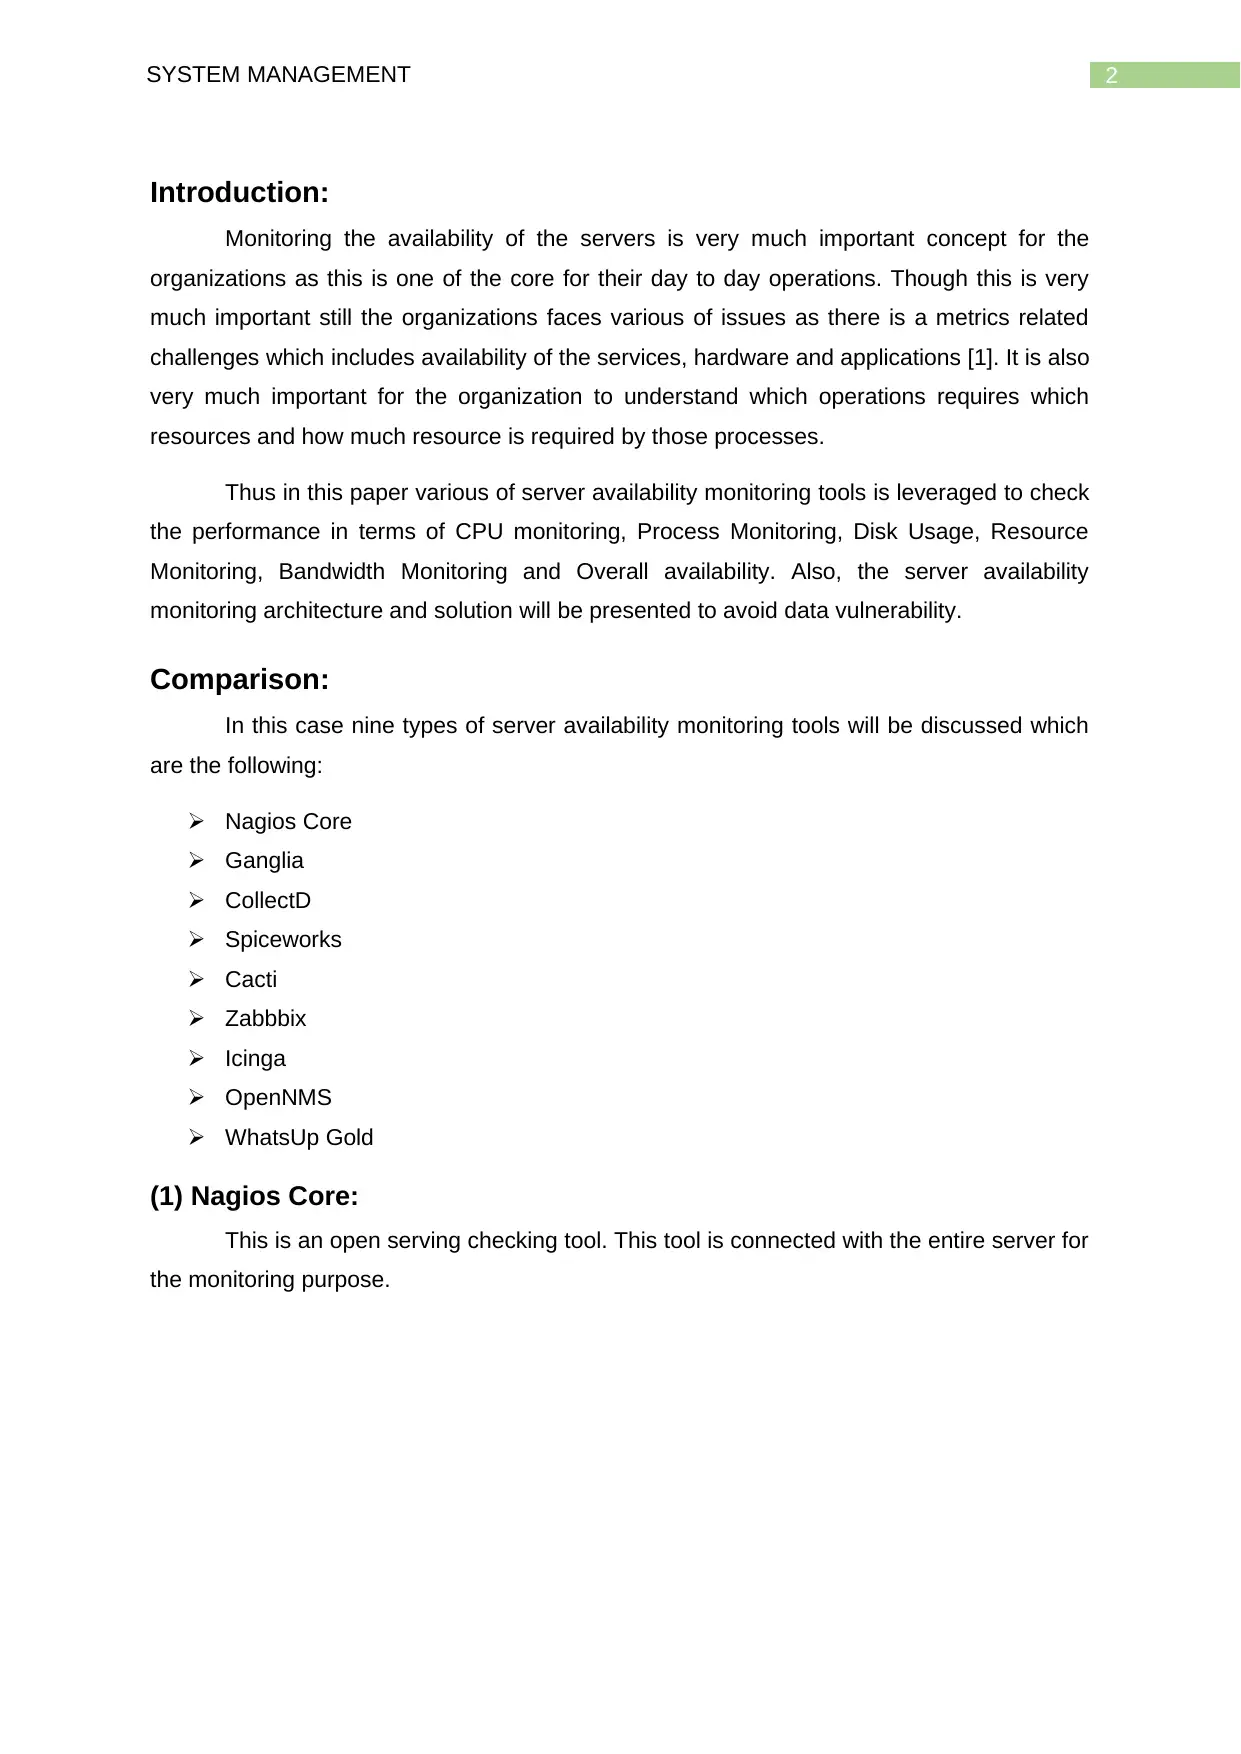
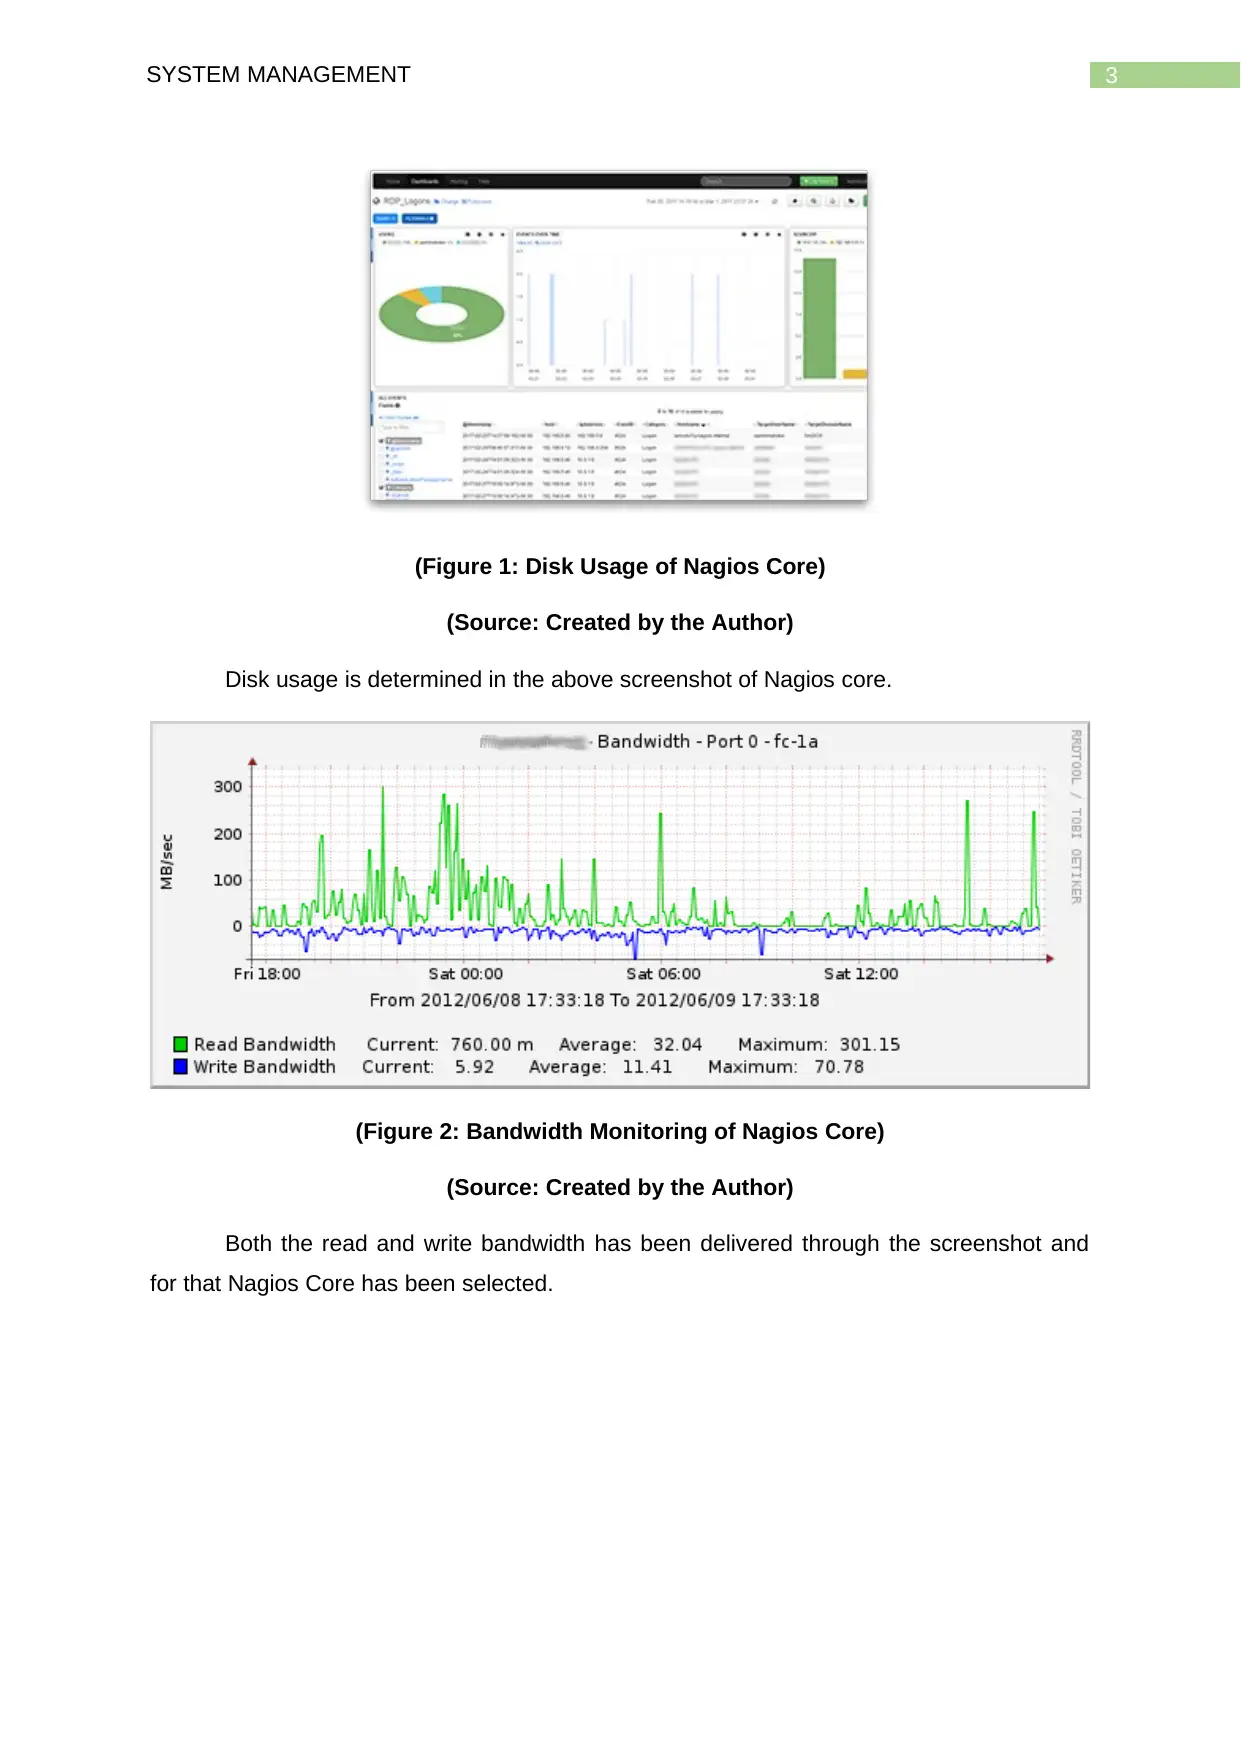
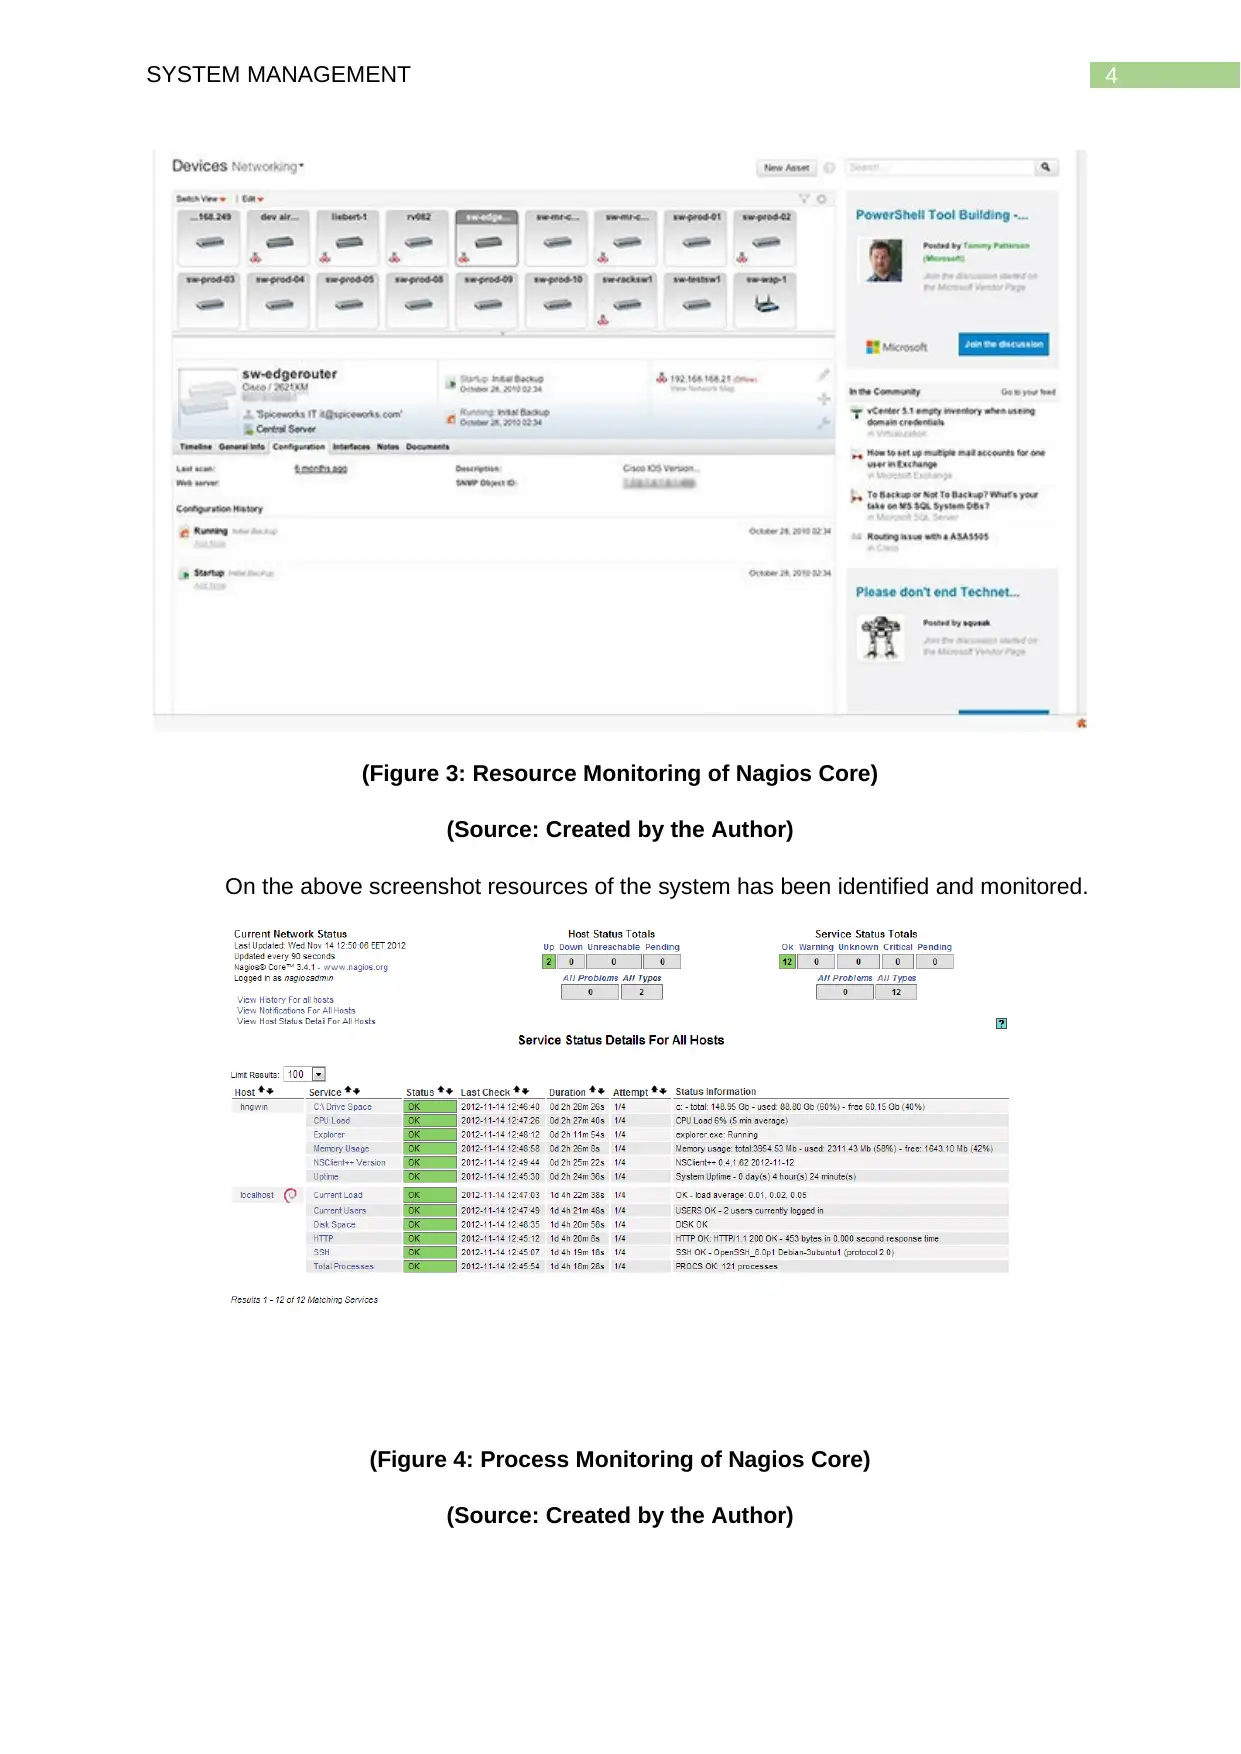
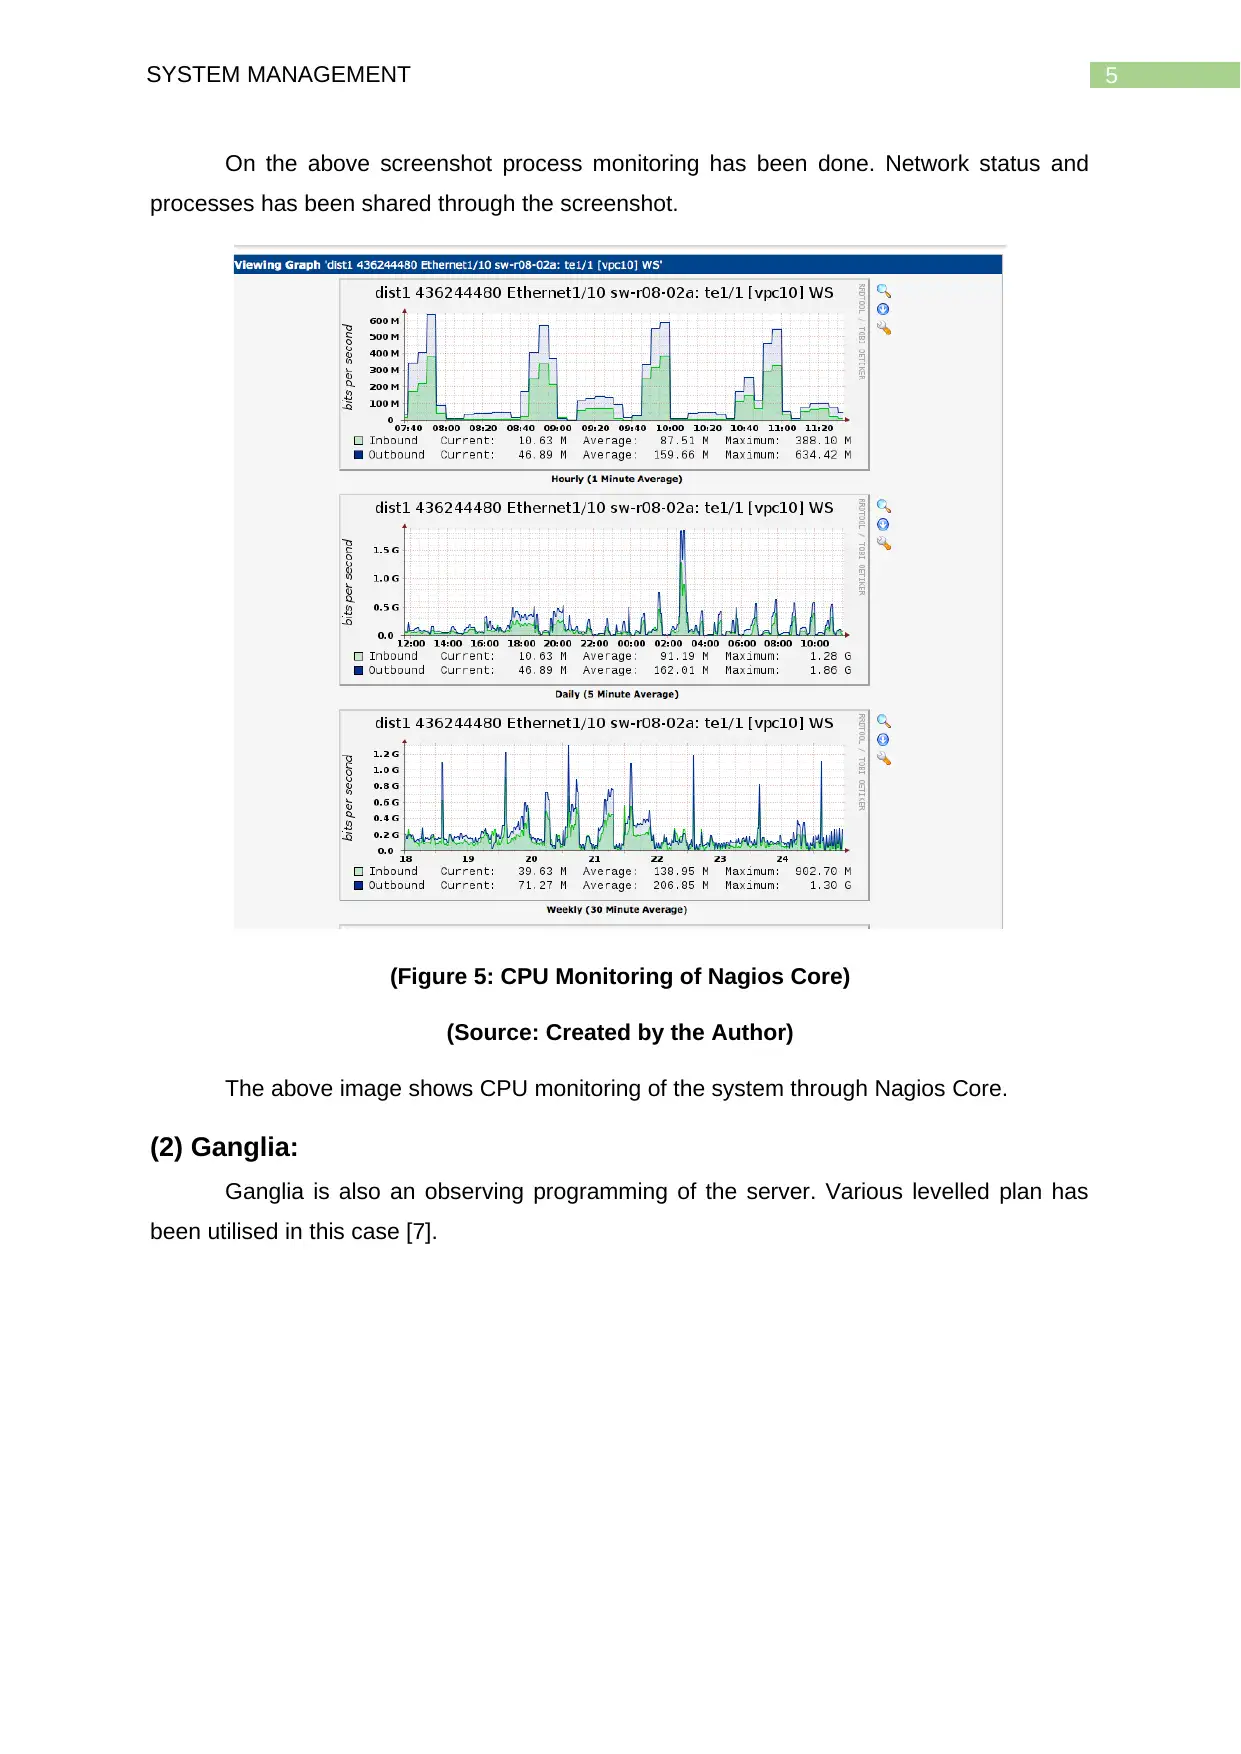
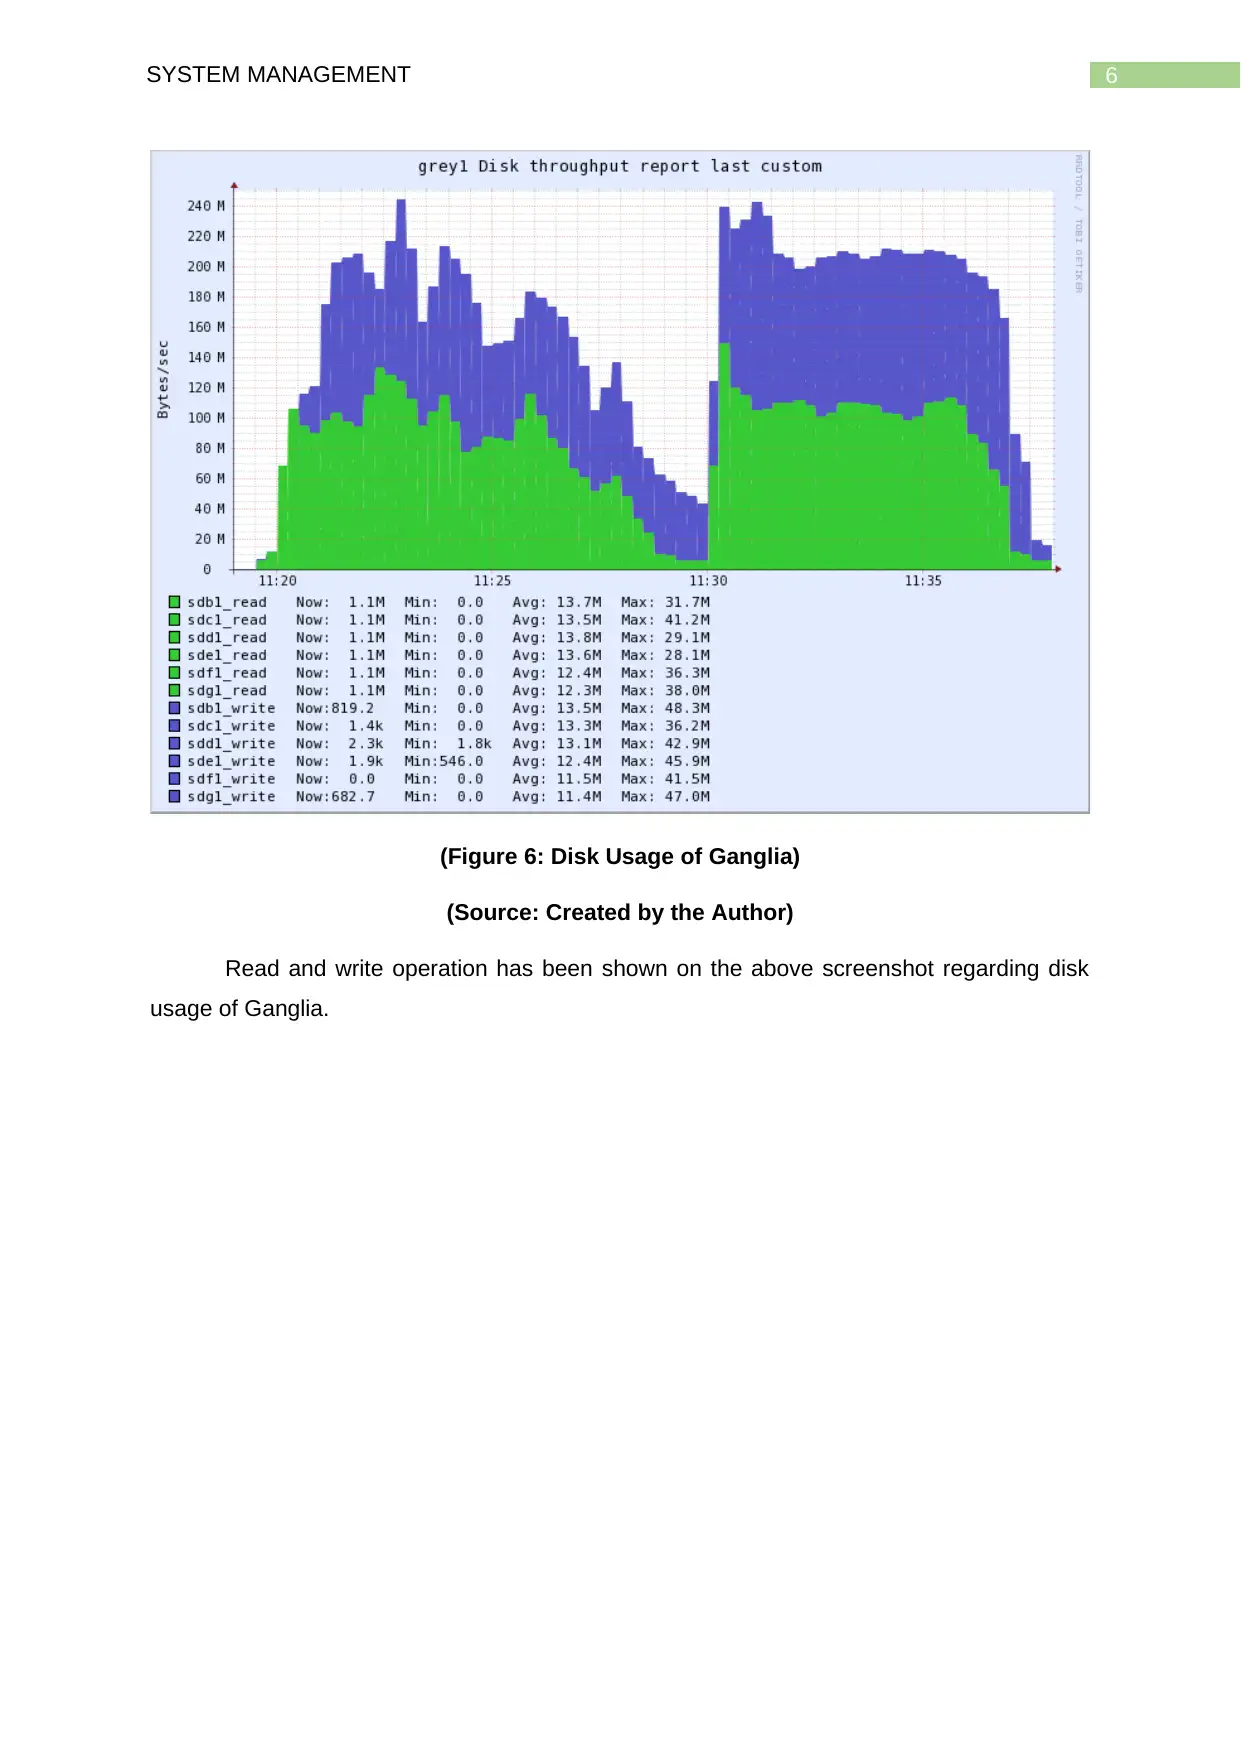
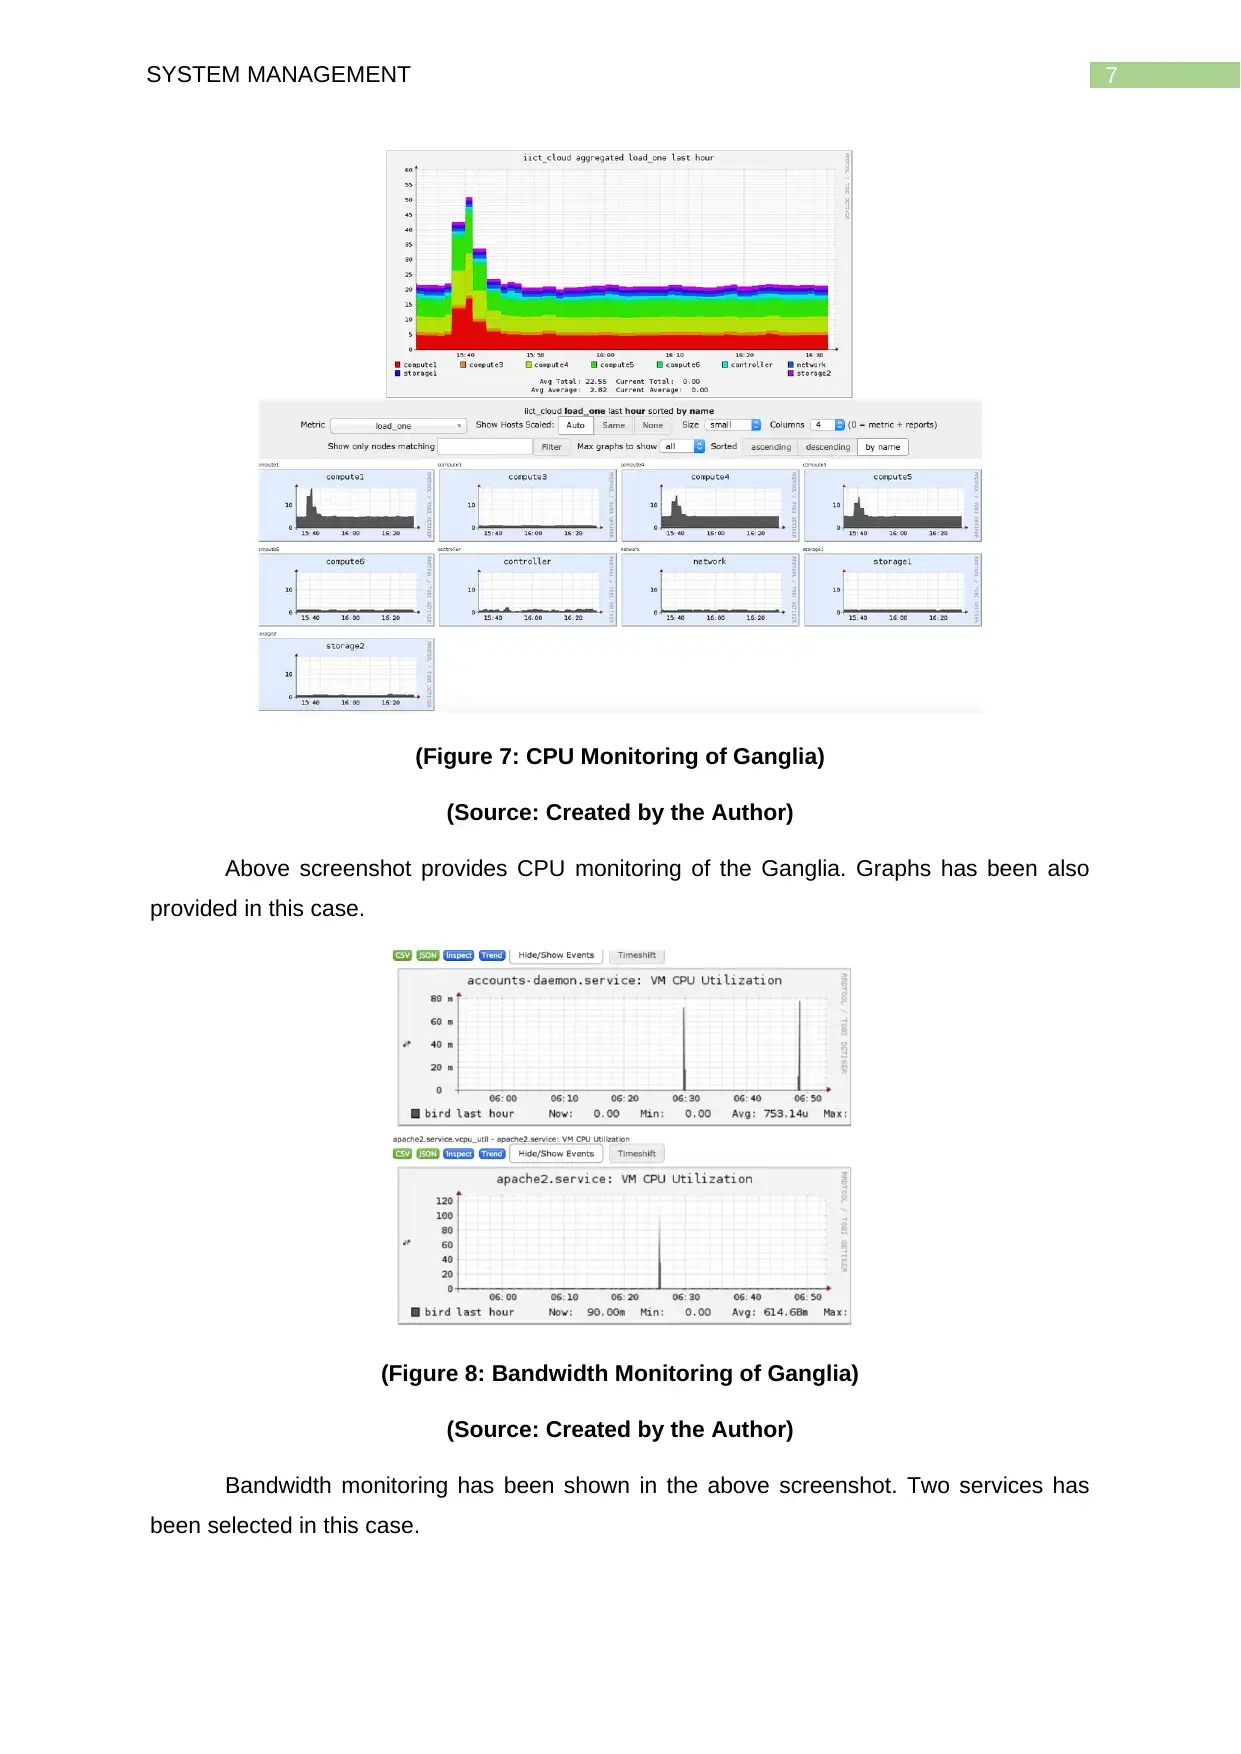
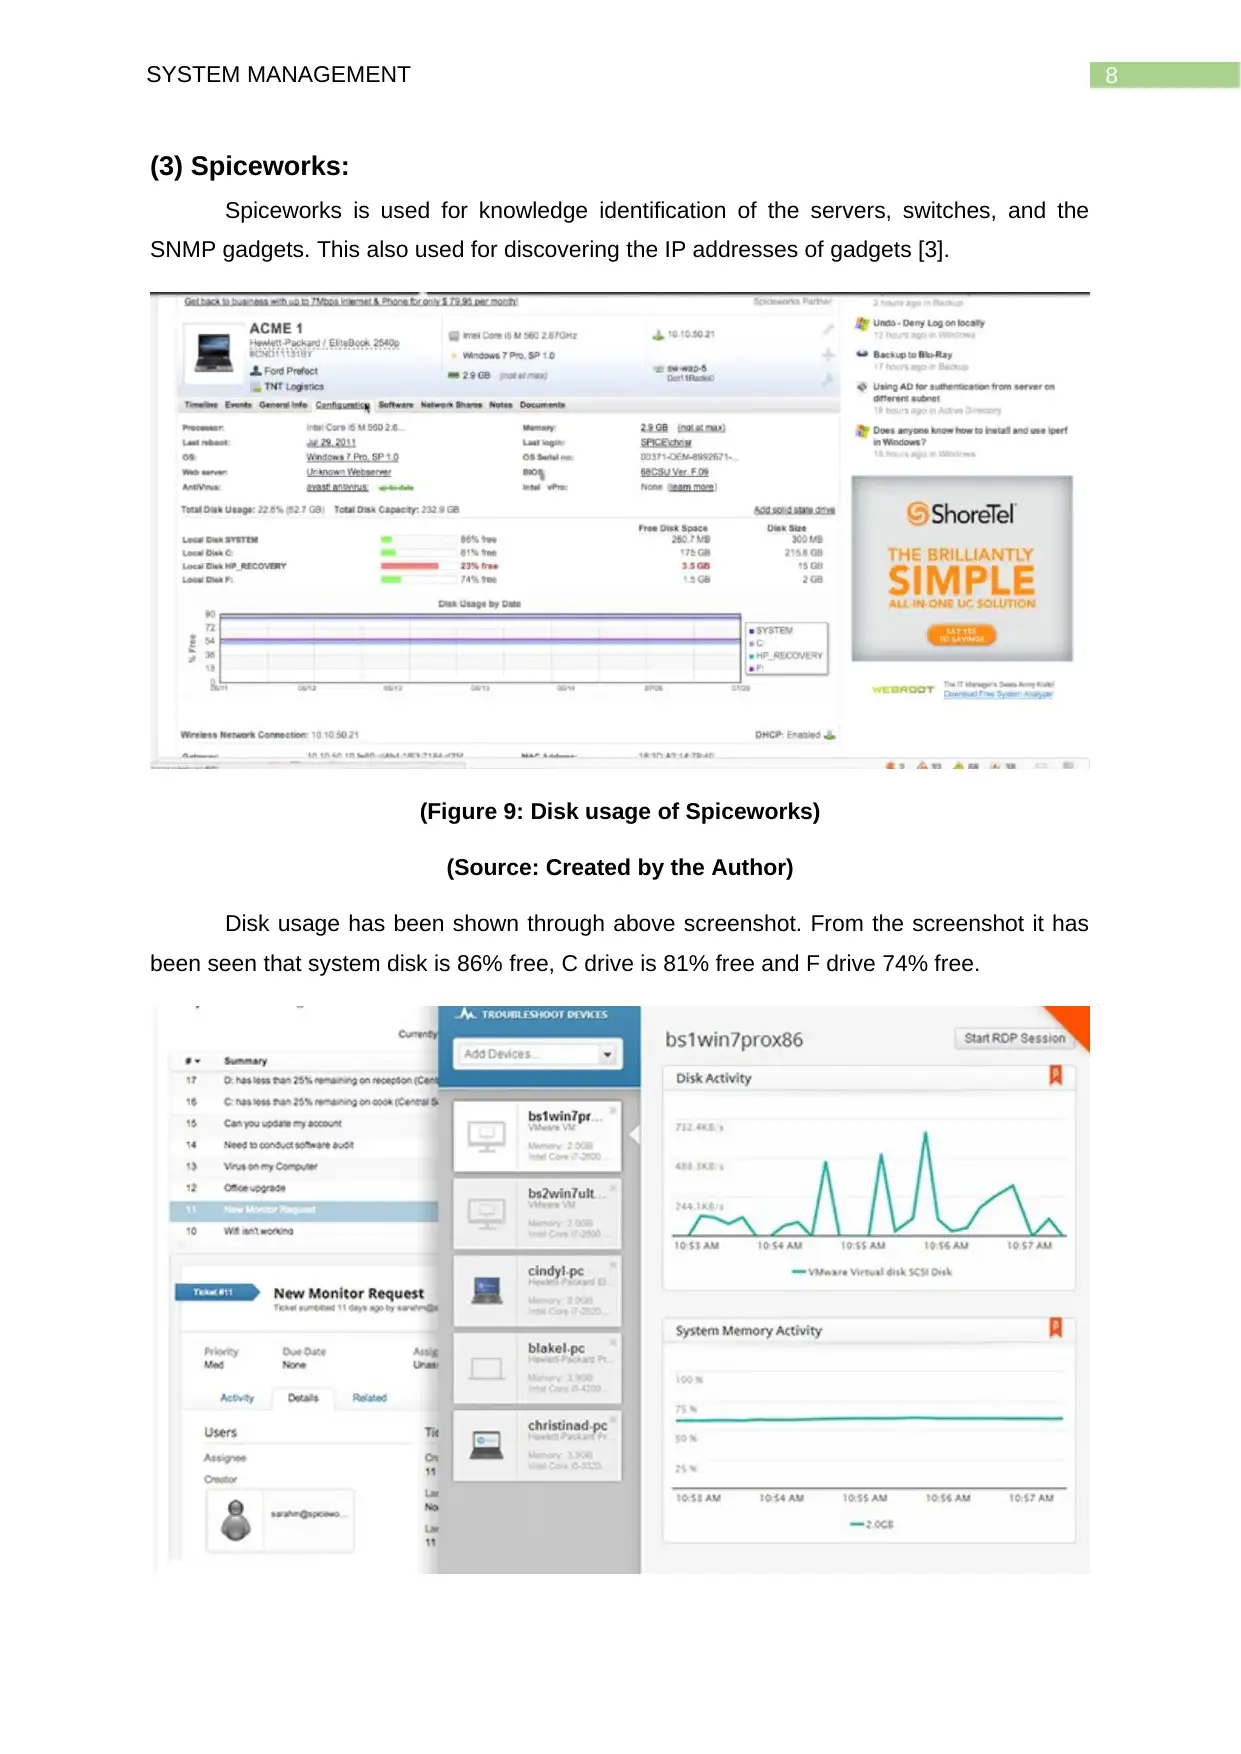
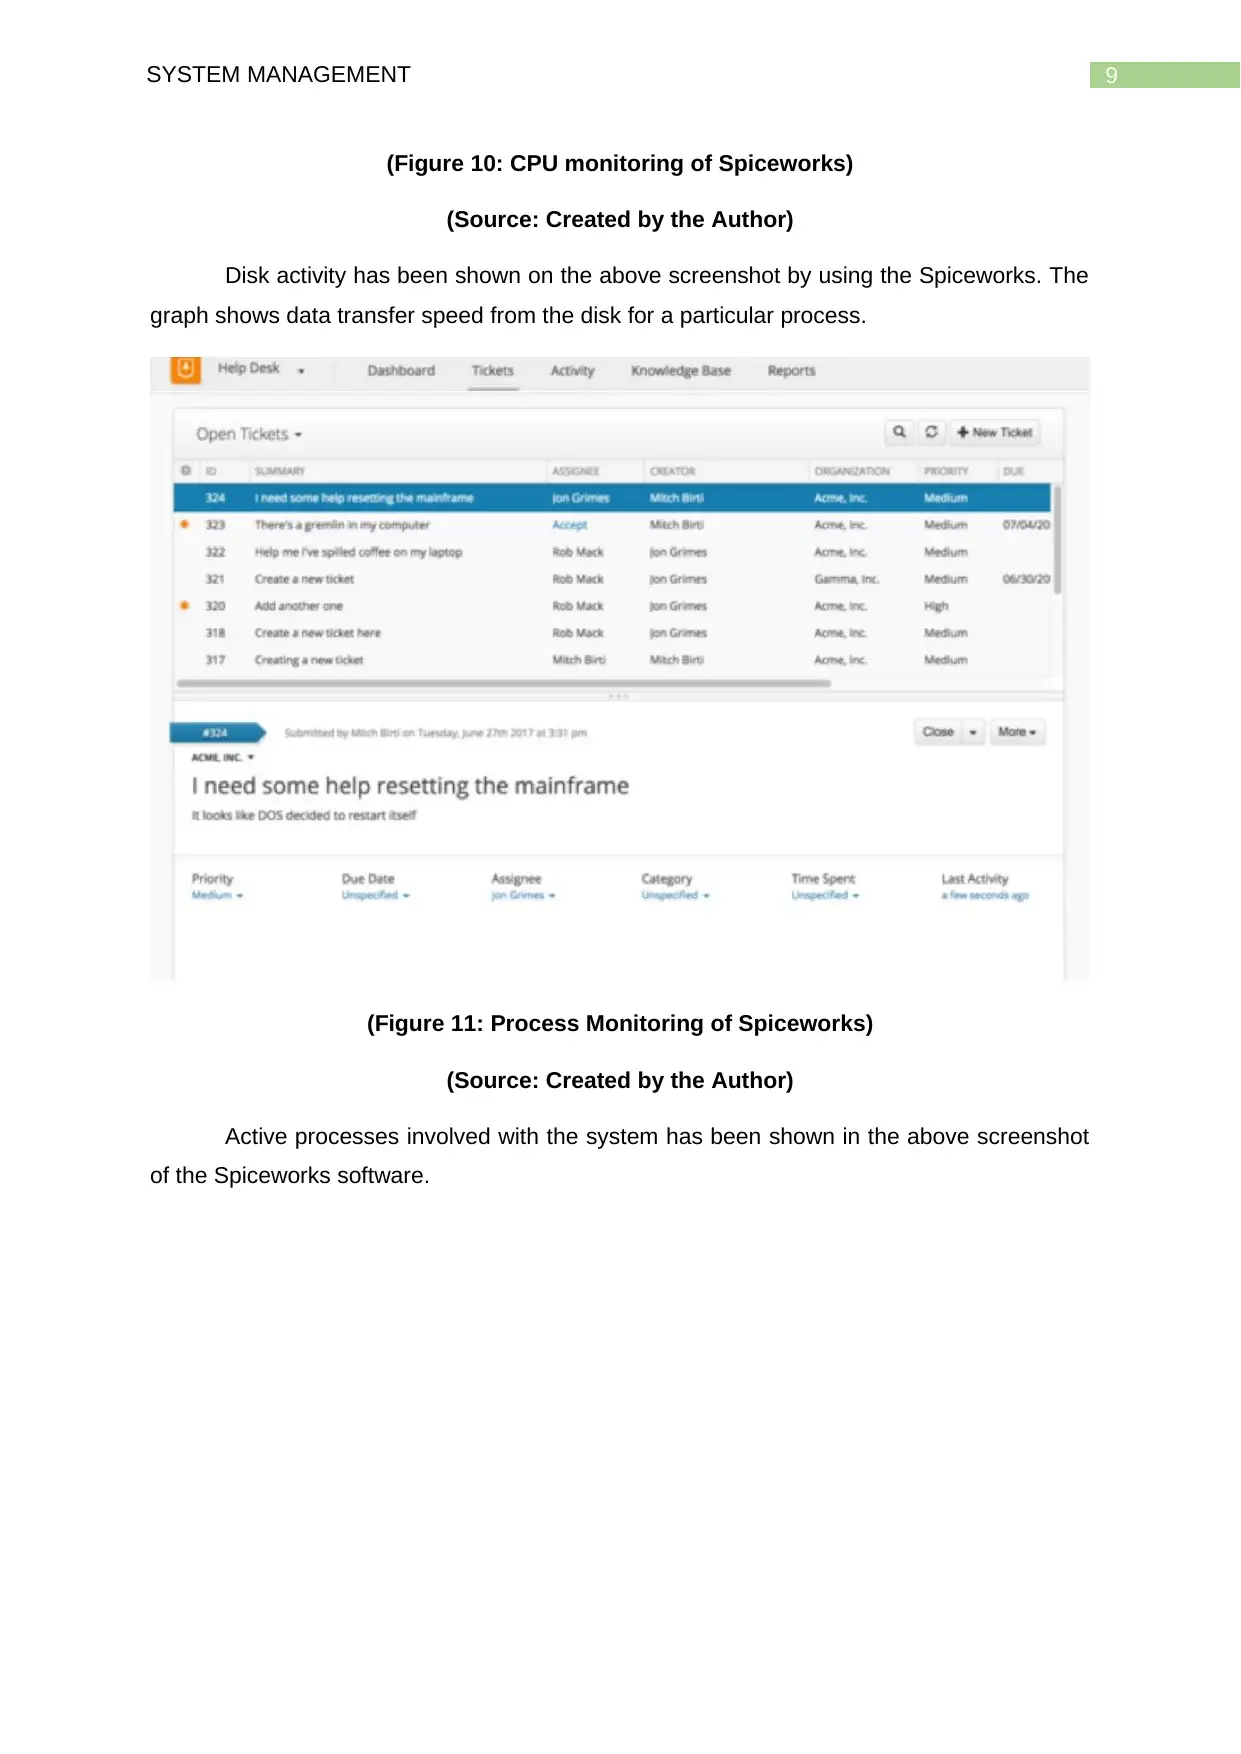
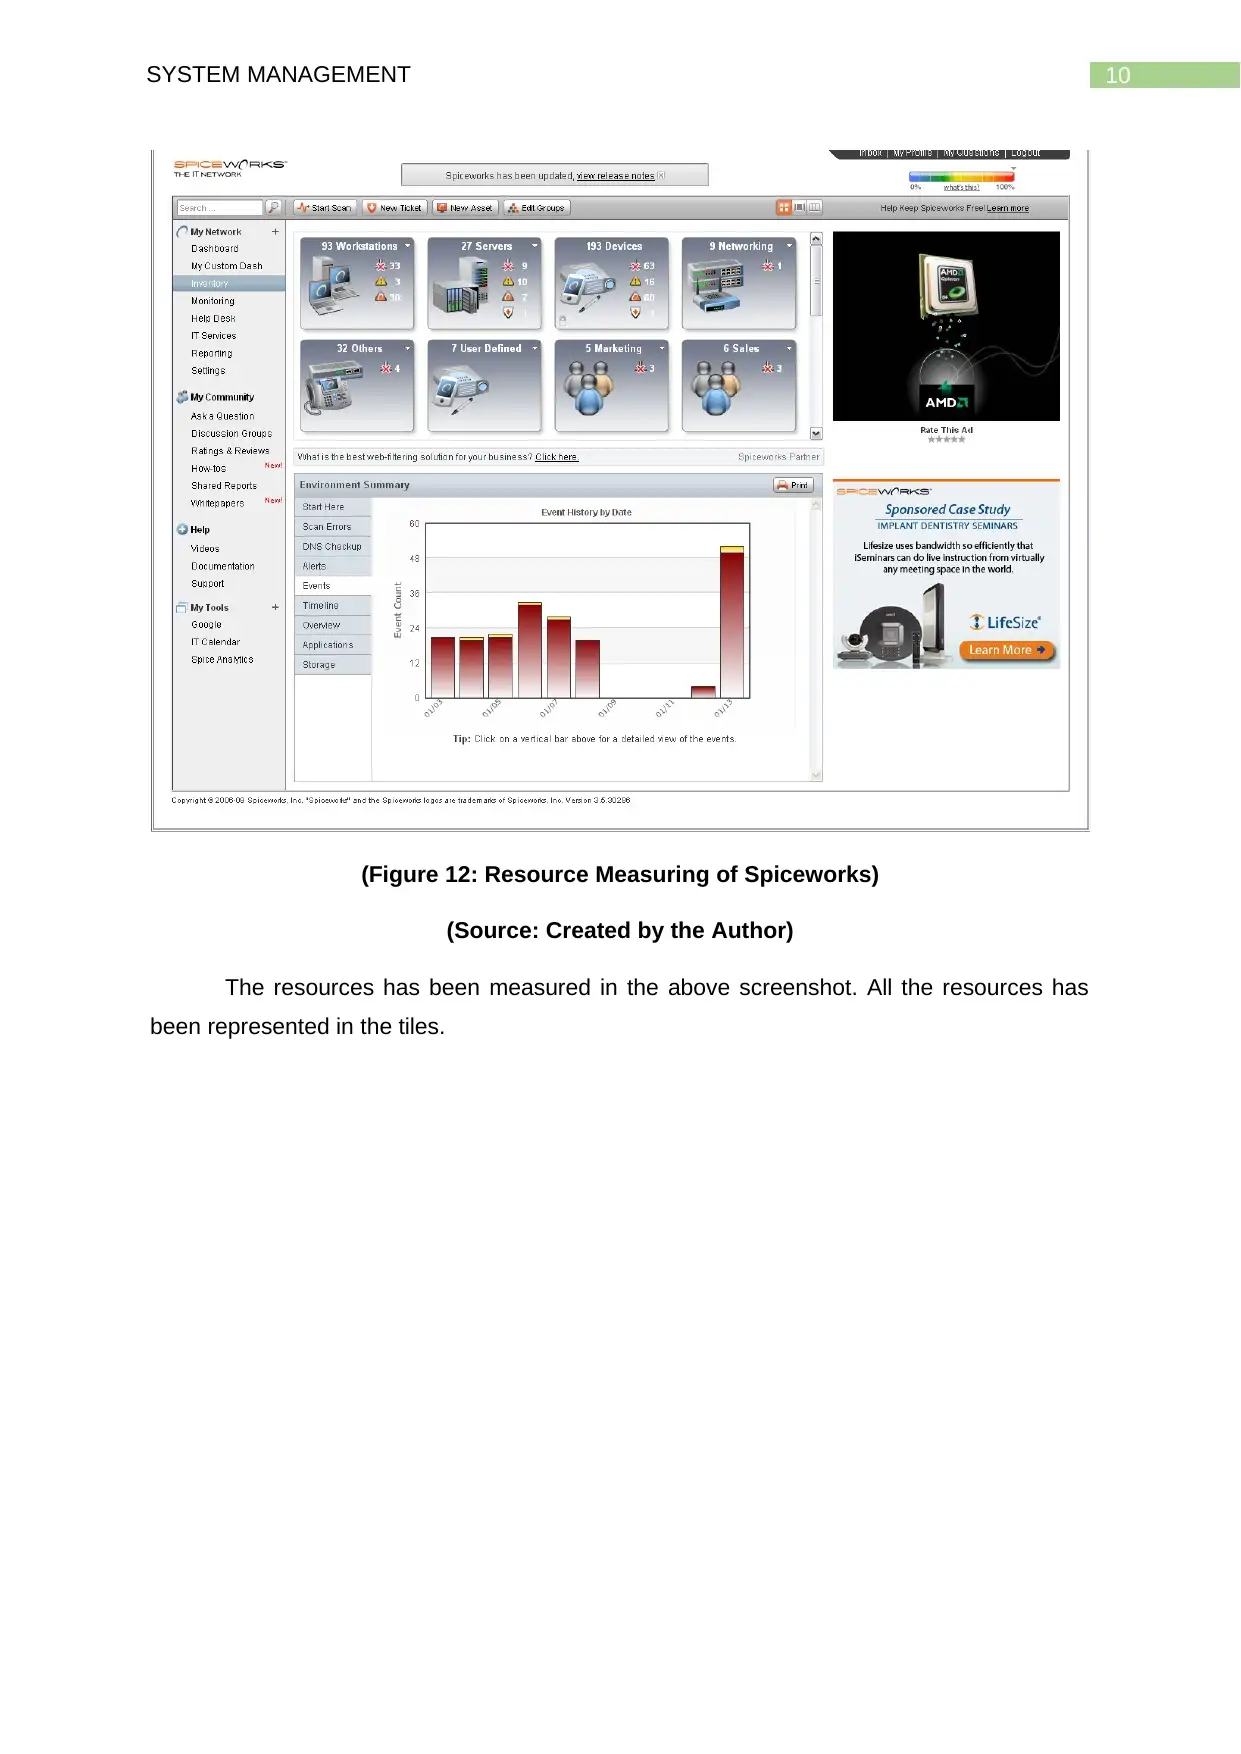
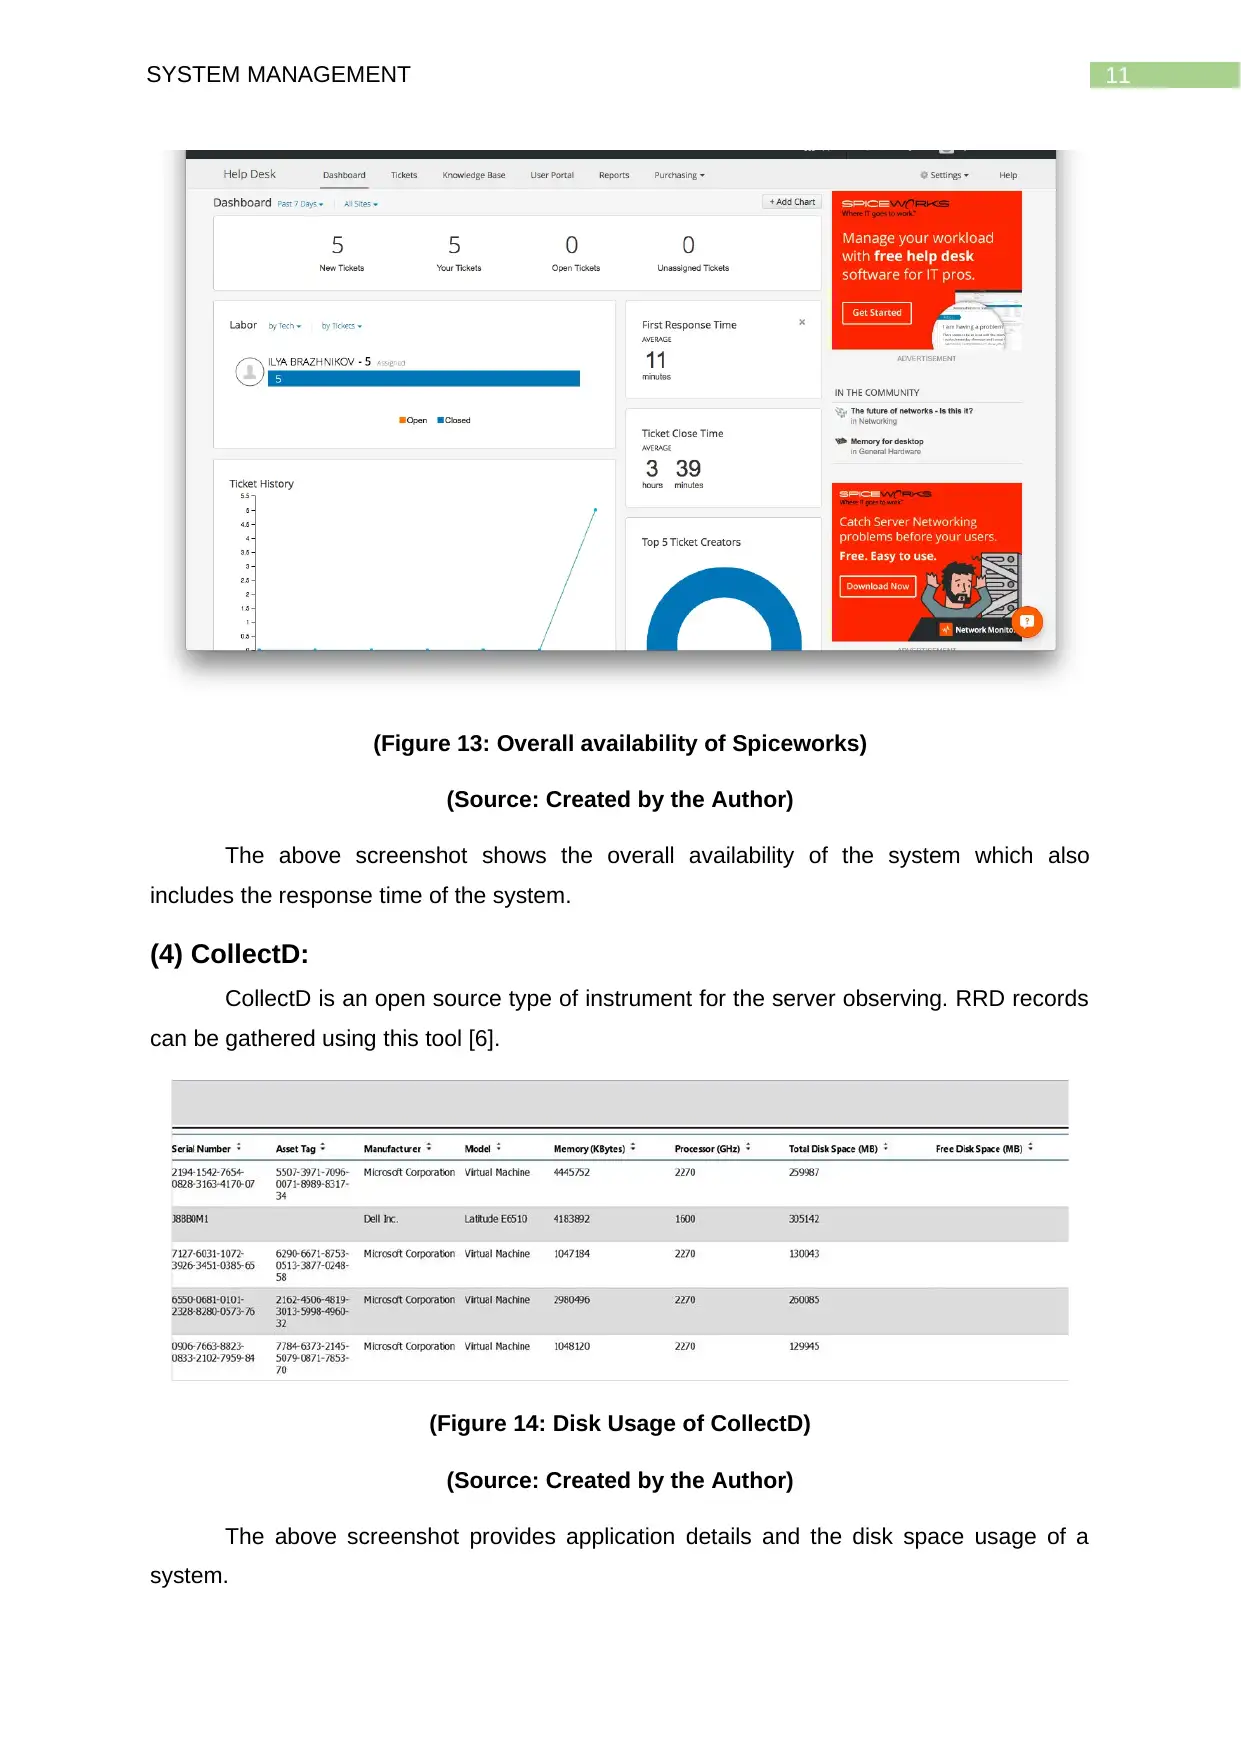
This report provides a comparative analysis of various server availability monitoring tools, focusing on their capabilities in monitoring critical server metrics. The report examines nine different tools, including Nagios Core, Ganglia, Spiceworks, CollectD, Cacti, Icinga, Zabbix, OpenNMS, and WhatsUp Gold. Each tool is evaluated based on its ability to monitor CPU usage, disk usage, bandwidth, processes, and overall resource utilization. The report includes screenshots demonstrating the functionality of each tool in these areas. The analysis aims to identify the strengths and weaknesses of each tool, providing insights into their suitability for different server management scenarios. The report also touches upon the importance of server availability monitoring for organizations and the potential vulnerabilities that can arise from server unavailability. The report concludes with a brief evaluation and proposes recommendations for selecting the most appropriate monitoring tools.
Document Page
Running head: SYSTEM MANAGEMENT
System Management
Name of the Student
Name of the University
Author Note
tabler-icon-diamond-filled.svg

Paraphrase This Document

Need a fresh take? Get an instant paraphrase of this document with our AI Paraphraser
Document Page
1SYSTEM MANAGEMENT
Report Layout
Introduction:........................................................................................................................... 2
Comparison:........................................................................................................................... 2
(1) Nagios Core:................................................................................................................. 2
(2) Ganglia:......................................................................................................................... 5
(3) Spiceworks:................................................................................................................... 8
(4) CollectD:...................................................................................................................... 11
(5) Cacti:........................................................................................................................... 13
(6) Icinga:.......................................................................................................................... 16
(7) Zabbix:........................................................................................................................ 21
(8) OpenNMS:................................................................................................................... 24
(9) WhatsUp Gold:............................................................................................................ 26
Evaluation:........................................................................................................................... 29
Identification and Analysis:...................................................................................................29
Propose:............................................................................................................................... 29
Conclusion:.......................................................................................................................... 29
References:.......................................................................................................................... 30
Document Page
2SYSTEM MANAGEMENT
Introduction:
Monitoring the availability of the servers is very much important concept for the
organizations as this is one of the core for their day to day operations. Though this is very
much important still the organizations faces various of issues as there is a metrics related
challenges which includes availability of the services, hardware and applications [1]. It is also
very much important for the organization to understand which operations requires which
resources and how much resource is required by those processes.
Thus in this paper various of server availability monitoring tools is leveraged to check
the performance in terms of CPU monitoring, Process Monitoring, Disk Usage, Resource
Monitoring, Bandwidth Monitoring and Overall availability. Also, the server availability
monitoring architecture and solution will be presented to avoid data vulnerability.
Comparison:
In this case nine types of server availability monitoring tools will be discussed which
are the following:
Nagios Core
Ganglia
CollectD
Spiceworks
Cacti
Zabbbix
Icinga
OpenNMS
WhatsUp Gold
(1) Nagios Core:
This is an open serving checking tool. This tool is connected with the entire server for
the monitoring purpose.
Document Page
3SYSTEM MANAGEMENT
(Figure 1: Disk Usage of Nagios Core)
(Source: Created by the Author)
Disk usage is determined in the above screenshot of Nagios core.
(Figure 2: Bandwidth Monitoring of Nagios Core)
(Source: Created by the Author)
Both the read and write bandwidth has been delivered through the screenshot and
for that Nagios Core has been selected.
tabler-icon-diamond-filled.svg

Paraphrase This Document

Need a fresh take? Get an instant paraphrase of this document with our AI Paraphraser
Document Page
4SYSTEM MANAGEMENT
(Figure 3: Resource Monitoring of Nagios Core)
(Source: Created by the Author)
On the above screenshot resources of the system has been identified and monitored.
(Figure 4: Process Monitoring of Nagios Core)
(Source: Created by the Author)
Document Page
5SYSTEM MANAGEMENT
On the above screenshot process monitoring has been done. Network status and
processes has been shared through the screenshot.
(Figure 5: CPU Monitoring of Nagios Core)
(Source: Created by the Author)
The above image shows CPU monitoring of the system through Nagios Core.
(2) Ganglia:
Ganglia is also an observing programming of the server. Various levelled plan has
been utilised in this case [7].
Document Page
6SYSTEM MANAGEMENT
(Figure 6: Disk Usage of Ganglia)
(Source: Created by the Author)
Read and write operation has been shown on the above screenshot regarding disk
usage of Ganglia.
tabler-icon-diamond-filled.svg

Paraphrase This Document

Need a fresh take? Get an instant paraphrase of this document with our AI Paraphraser
Document Page
7SYSTEM MANAGEMENT
(Figure 7: CPU Monitoring of Ganglia)
(Source: Created by the Author)
Above screenshot provides CPU monitoring of the Ganglia. Graphs has been also
provided in this case.
(Figure 8: Bandwidth Monitoring of Ganglia)
(Source: Created by the Author)
Bandwidth monitoring has been shown in the above screenshot. Two services has
been selected in this case.
Document Page
8SYSTEM MANAGEMENT
(3) Spiceworks:
Spiceworks is used for knowledge identification of the servers, switches, and the
SNMP gadgets. This also used for discovering the IP addresses of gadgets [3].
(Figure 9: Disk usage of Spiceworks)
(Source: Created by the Author)
Disk usage has been shown through above screenshot. From the screenshot it has
been seen that system disk is 86% free, C drive is 81% free and F drive 74% free.
Document Page
9SYSTEM MANAGEMENT
(Figure 10: CPU monitoring of Spiceworks)
(Source: Created by the Author)
Disk activity has been shown on the above screenshot by using the Spiceworks. The
graph shows data transfer speed from the disk for a particular process.
(Figure 11: Process Monitoring of Spiceworks)
(Source: Created by the Author)
Active processes involved with the system has been shown in the above screenshot
of the Spiceworks software.
tabler-icon-diamond-filled.svg

Paraphrase This Document

Need a fresh take? Get an instant paraphrase of this document with our AI Paraphraser
Document Page
10SYSTEM MANAGEMENT
(Figure 12: Resource Measuring of Spiceworks)
(Source: Created by the Author)
The resources has been measured in the above screenshot. All the resources has
been represented in the tiles.
Document Page
11SYSTEM MANAGEMENT
(Figure 13: Overall availability of Spiceworks)
(Source: Created by the Author)
The above screenshot shows the overall availability of the system which also
includes the response time of the system.
(4) CollectD:
CollectD is an open source type of instrument for the server observing. RRD records
can be gathered using this tool [6].
(Figure 14: Disk Usage of CollectD)
(Source: Created by the Author)
The above screenshot provides application details and the disk space usage of a
system.
chevron_up_icon
1 out of 31
circle_padding
hide_on_mobile
zoom_out_icon
[object Object]