T1 2019 MN506: Server Availability Monitoring Tools and Metrics Report
VerifiedAdded on 2023/01/20
|45
|3321
|30
Report
AI Summary
This report provides an in-depth analysis of various server availability monitoring tools, comparing their features, functionalities, and performance metrics. The report begins with an executive summary and an introduction that highlights the importance of server monitoring for maintaining server health and preventing data loss. It then explores several open-source server monitoring tools, including Ganglia, CollectD, WhatsUp Gold, Zabbix, Nagios, Icinga, OpenNMS, Cacti, and Spiceworks. Each tool is described in detail, covering its key features, architecture, and capabilities. The report includes a comparative analysis of these tools, focusing on metrics such as disk usage, CPU monitoring, resource monitoring, bandwidth monitoring, and process monitoring. The report also discusses the architecture of server monitoring tools, potential vulnerabilities, and the impact of prediction failures. The report concludes with a list of references.

Running head: SERVER AVAILABILITY MONITORING TOOLS
Server availability monitoring tools
Name of the Student
Name of the University
Author Note
Server availability monitoring tools
Name of the Student
Name of the University
Author Note
Paraphrase This Document
Need a fresh take? Get an instant paraphrase of this document with our AI Paraphraser

1SERVER AVAILABILITY MONITORING TOOLS
Executive Summary
This report highlights various server monitoring tools and metrics. The server monitoring tools are
essential in proper functioning of the server and in maintaining server health. There are various
server monitoring tools in the market. Thus this report will show the analysis of few servers and its
various attributes.

2SERVER AVAILABILITY MONITORING TOOLS
Table of Contents
Introduction...........................................................................................................................................3
IT Infrastructure-Monitoring Tools........................................................................................................3
Comparison...........................................................................................................................................6
Ganglia..............................................................................................................................................6
CollectD...........................................................................................................................................10
WhatsUp Gold.................................................................................................................................14
Zabbix..............................................................................................................................................18
Nagios.............................................................................................................................................22
Icinga...............................................................................................................................................26
OpenNMS........................................................................................................................................30
Cacti................................................................................................................................................33
SpiceWorks......................................................................................................................................37
Architecture of server monitoring tool................................................................................................41
Vulnerability of data in monitoring tools of the server........................................................................42
Impacts of prediction failure in server monitoring tool.......................................................................42
References...........................................................................................................................................43
⊘ This is a preview!⊘
Do you want full access?
Subscribe today to unlock all pages.
Trusted by 1+ million students worldwide

3SERVER AVAILABILITY MONITORING TOOLS
Introduction
Server monitoring is an important task as a small problem in the server can lead to
enormous trouble like server crashes and huge amount of data loss. Proper maintenance of their
server is required for the smooth running of information in the organizations network system.
Organizations face core concern regarding the monitoring server availability and server services.
Server health is important for the running of servers in the organization. To ensure improved and
proper functioning of the server, resources used to provide services needs stringent monitoring.
Additional functions include identification of user access and request, responding to request and
providing permission for access of data resources. A glitch in the server can hamper a day’s work
leading to greater damage. Server monitoring tools aids in maintaining proper health of the server,
server activities and administrating the server’s performance. The monitoring tools generate report,
which are used to understand the performance capacity of the server in its working environment.
The tools ensure efficient schedule to checks to identify problems and immediately works on o
provide a solution[1]. Any kind of suspicious activities like third party login, time of response,
utilization of resources and downtime of application is all measured and monitored by the
monitoring tool. The tools raises alert and generates warning if any malicious activity is identified or
if the server faces any internal issue. Graphical representations help in visualization of the issue
faced by the servers. Degradation issues which impacts service delivery function are checked and
troubleshooting is performed for the overall stack [2]. Right selection of the software needs to be in
sync with the organization’s preference and need. There are several server monitoring tools in the
market and each tool has its own specialty.
IT Infrastructure-Monitoring Tools
Server availability monitoring tools provide the following basic services [2]:
(1) Immaculate visual presentation of the connected devices supported by server system.
(2) Identification of root cause of the issues and resolving them quickly.
(3) Performs troubleshooting to receive data instantly.
(4) Performance quality is improved to reduce risks of outage.
(5) Dependencies are uncovered.
Server monitoring availability tools are given below:
(a) Ganglia
Paraphrase This Document
Need a fresh take? Get an instant paraphrase of this document with our AI Paraphraser
4SERVER AVAILABILITY MONITORING TOOLS
(b) CollectD
(c) WhatsUp Gold
(d) Nagios Core
(e) Cacti
(f) Spiceworks
(g) Zabbix
(h) OpenNMS
(i) Icinga
Ganglia: This server monitoring software serves computers with top performance systems like grids
and clusters. The software is scalable distributed tool which has its design based on hierarchy and
leverages technologies like XDR for compacting and for data representation – XML, RRD tool is used
in visualization and storage of data, lastly portable data transfer. High concurrency and low node
overheads are achieved through complex algorithms and data structure. The tool can be used to
scale 2000 nodes clusters. It is BSD licensed and an open source monitoring tool. As it scales large
count of servers, the system provides real time visual metrics of the performance of the server(s).
CollectD: This daemon is Unix based which stores and records performance of the systems
periodically, provide methods to store values in several ways like RRD files. The information
collected from log files, applications and external devices are stored and are made available on the
network system. The recorded data can be used to perform analysis to identify bottlenecks and
predict system capacity. This monitoring tool provides graphical representation of working of the
server for easy comprehension [7]. The software is written in C. This allows the tool to run on
embedded systems. Graphs are not generated by CollectD. The plugins of the daemon range from
basic standard one to specialized advance ones.
Icinga: Icinga is an open source flexible monitoring server tool, which covers most requirements as
the framework can be customizable. Enterprises use this software to efficiently monitor server
applications and server. Database (DB) connectors and REST API are provided by Icinga software.
The new characteristics of API provide integration of numerous extensions. The extensions require
no core modification directly. The tools offer solutions, which monitor the complete network
resource, generate data report of performance, and notify errors and recoveries. Other features
include dashboards, Icinga director and alerts. The tool efficiently monitors server health and can
run multiple checks per second as the multithreaded design permits such a performance.
Cacti: It is a web based graphical and network monitoring tool which I designed for front end and an
open source application. The software provides graph services and the user is given allowance to poll
the services at intervals and the resulting data is reported in a graph. CPU utilization and bandwidth
is measured and graphed. Network traffic is monitored by the tool by polling router or switches via
SNMP (Simple Network Management Protocol). Data is collected by using external scripts. Graphs
5SERVER AVAILABILITY MONITORING TOOLS
are created easily from load balancers and server. This tool is highly used by organizations to
monitor the servers.
Spiceworks: Another significant and useful server availability monitoring tool is Spice work. This
server monitoring tool provides perception of SNMP (Simple Network Management Protocol)
devices, servers and network switches[4]. The insights provided by the tool are useful in measuring
and recoding data which on analyzing gives insightful information. Ruby on Rails is used to write the
server monitoring tool. Responsibilities of the tool include providing knowledge base and as well as
the tool monitor the functions of the help desk. The server monitoring tool looks for and finds out
all the IP addressing devices in the network system.
Zabbix: Zabbix is another open source monitoring tool for the server and it provides useful methods
for numerous IT components. The numerous components it monitors are mainly servers, networks,
cloud servers and Virtual machines (VM). The server monitoring software gives information on
various monitoring metrics specifically disk space usage, CPU monitoring, networking utilization.
Templates of XML are used to monitor such elements [3]. The software allows checks to verify
responsiveness and availability of the standard services like HTTP or SMTP. The process requires no
prior installation of software for monitored host. The software monitoring tool can be installed on
Windows a well as UNIX.
OpenNMS: OpenNMs server monitoring tool is free open source monitoring tool and offers premium
service. The tool is distributed and provides a scalable application management forum for FCAPS
(fault, configuration, accounting, performance and security) network[8]. The server tool allows a
maximum of ten devices to be connected and enables single user login and the tool provides basic
monitoring support and function of the server. The monitoring tool provides enterprise class model
solutions which is provided with the capability of checking and observing hardware of wide range
and virtualized stages. This server monitoring tool can remotely monitor applications efficiently.
WhatsUp Gold: WhatsUp Gold is a very popular server monitoring tool and a favorite of the
professionals. In the world of server monitoring tools whatsUp gold is the most used software. The
tool has outgrown several abilities making it a most chosen option. This tool scans the network
system completely and efficiently by using several tables and routing protocols. Duplicate devices
are eliminated to enhance the efficient use of the license in a proper manner. The comprehensive
structure of the tool provides mapping of the entire infrastructure of the network system. The tool
monitors wireless controllers, applications, devices, traffic flow and servers [6]. The tool initiates real
time alerts and warnings to avoid excessive data load or degrading of server health which enhances
optimized performance. The installation of the software is very easy. The flexibility of the tool is very
useful in both closed network or a limited bandwidth network and latency in connection.
Nagios: The tool is customizable and cost effective. The tool monitors server performance yet the
tool has limited attributes [5].
⊘ This is a preview!⊘
Do you want full access?
Subscribe today to unlock all pages.
Trusted by 1+ million students worldwide
6SERVER AVAILABILITY MONITORING TOOLS
Comparison
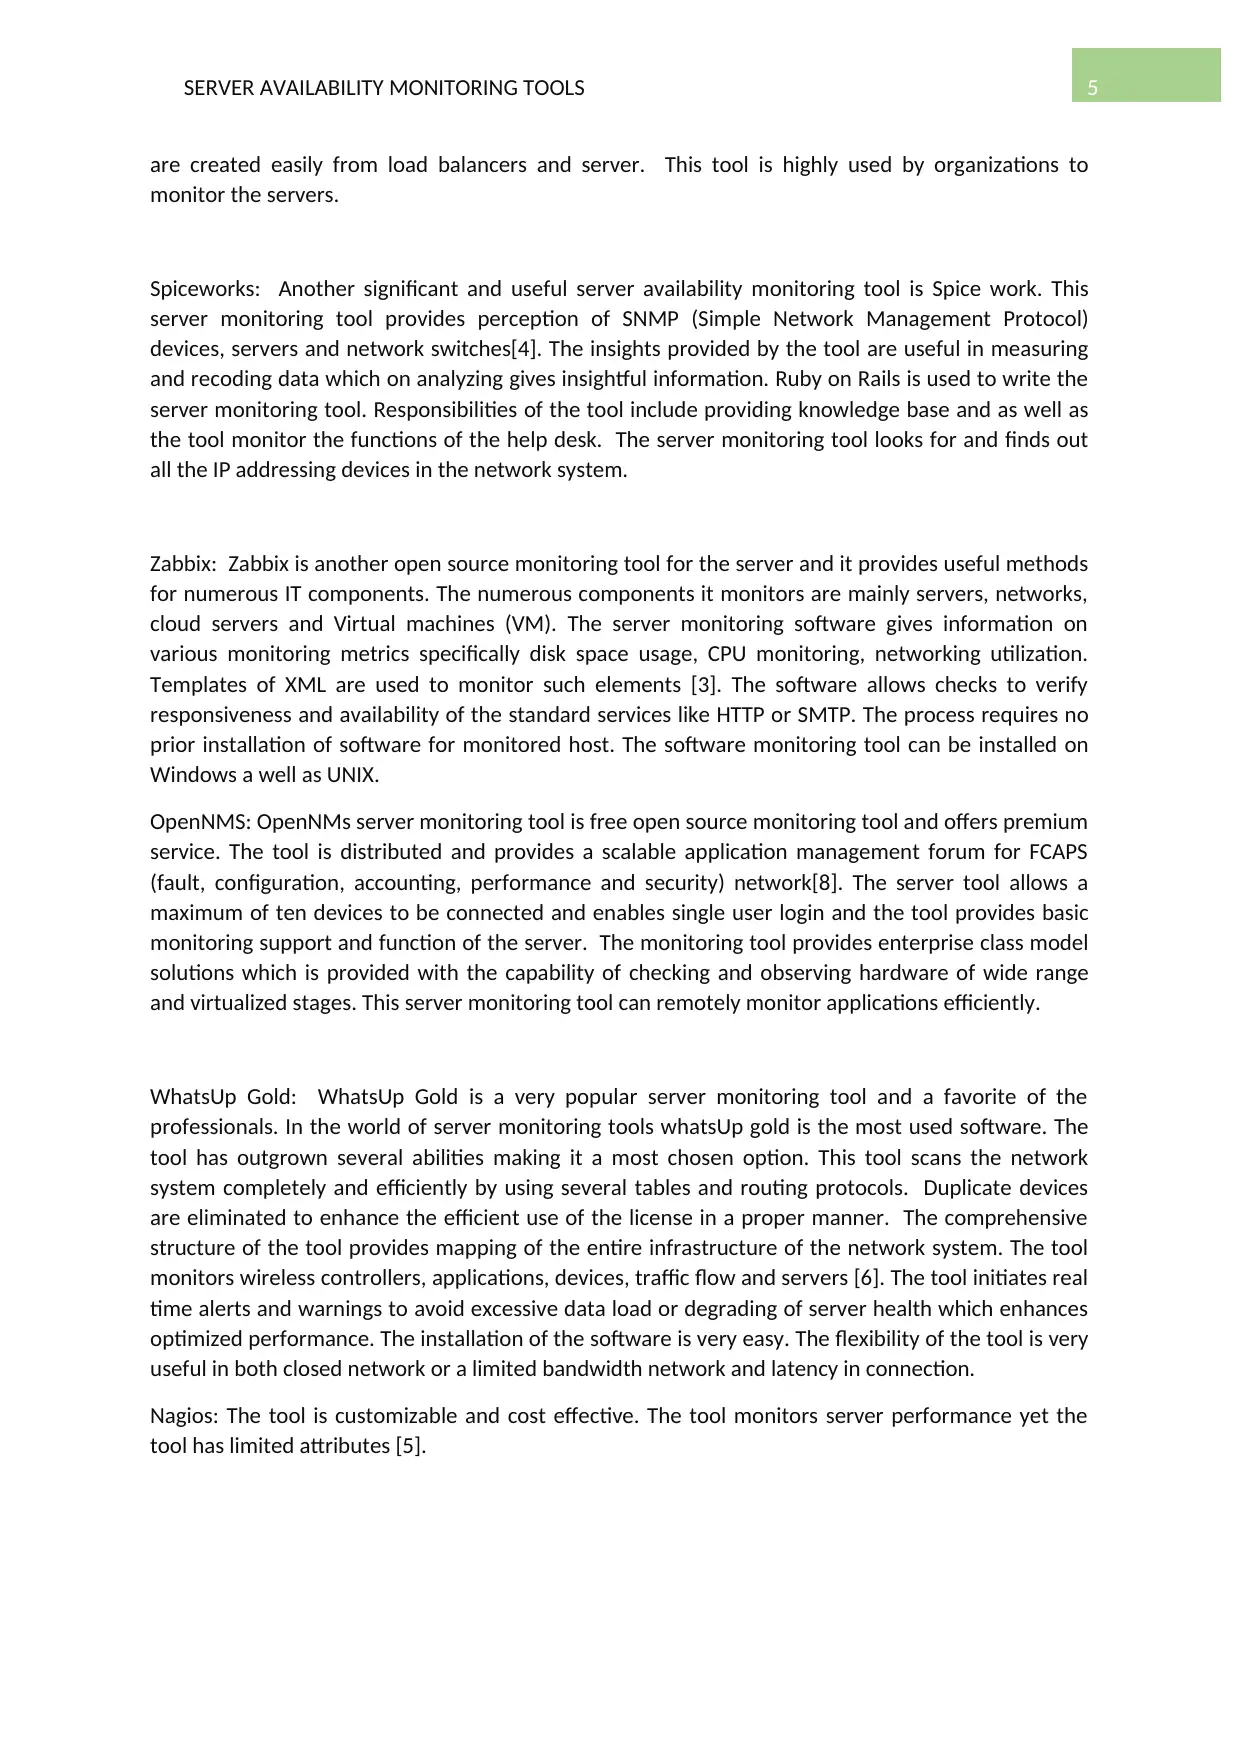
Ganglia
Disk usage
Figure 1: Disk Usage
Source: (Created by Author)
Comparison
Ganglia
Disk usage
Figure 1: Disk Usage
Source: (Created by Author)
Paraphrase This Document
Need a fresh take? Get an instant paraphrase of this document with our AI Paraphraser
7SERVER AVAILABILITY MONITORING TOOLS
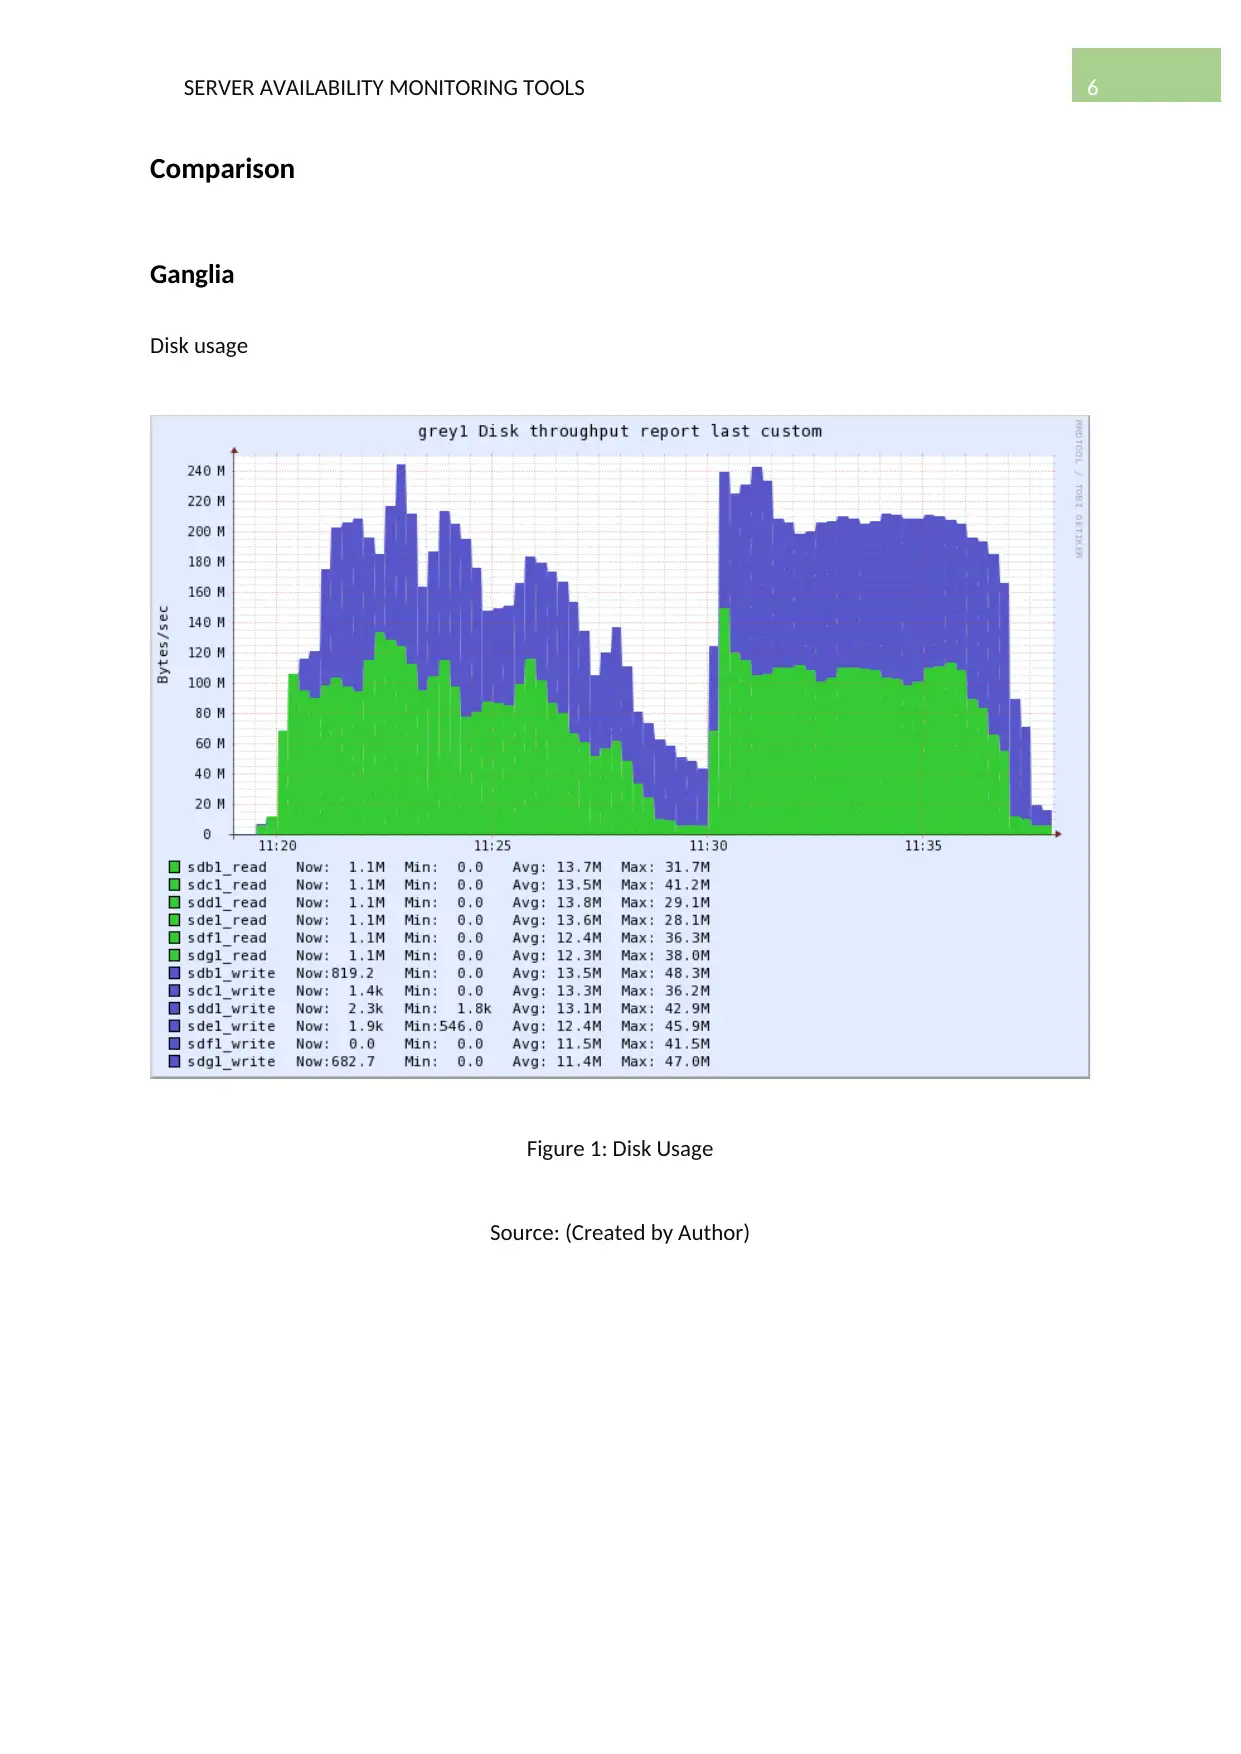
CPU Monitoring
Figure 2: CPU Monitoring
Source: (Created by Author)
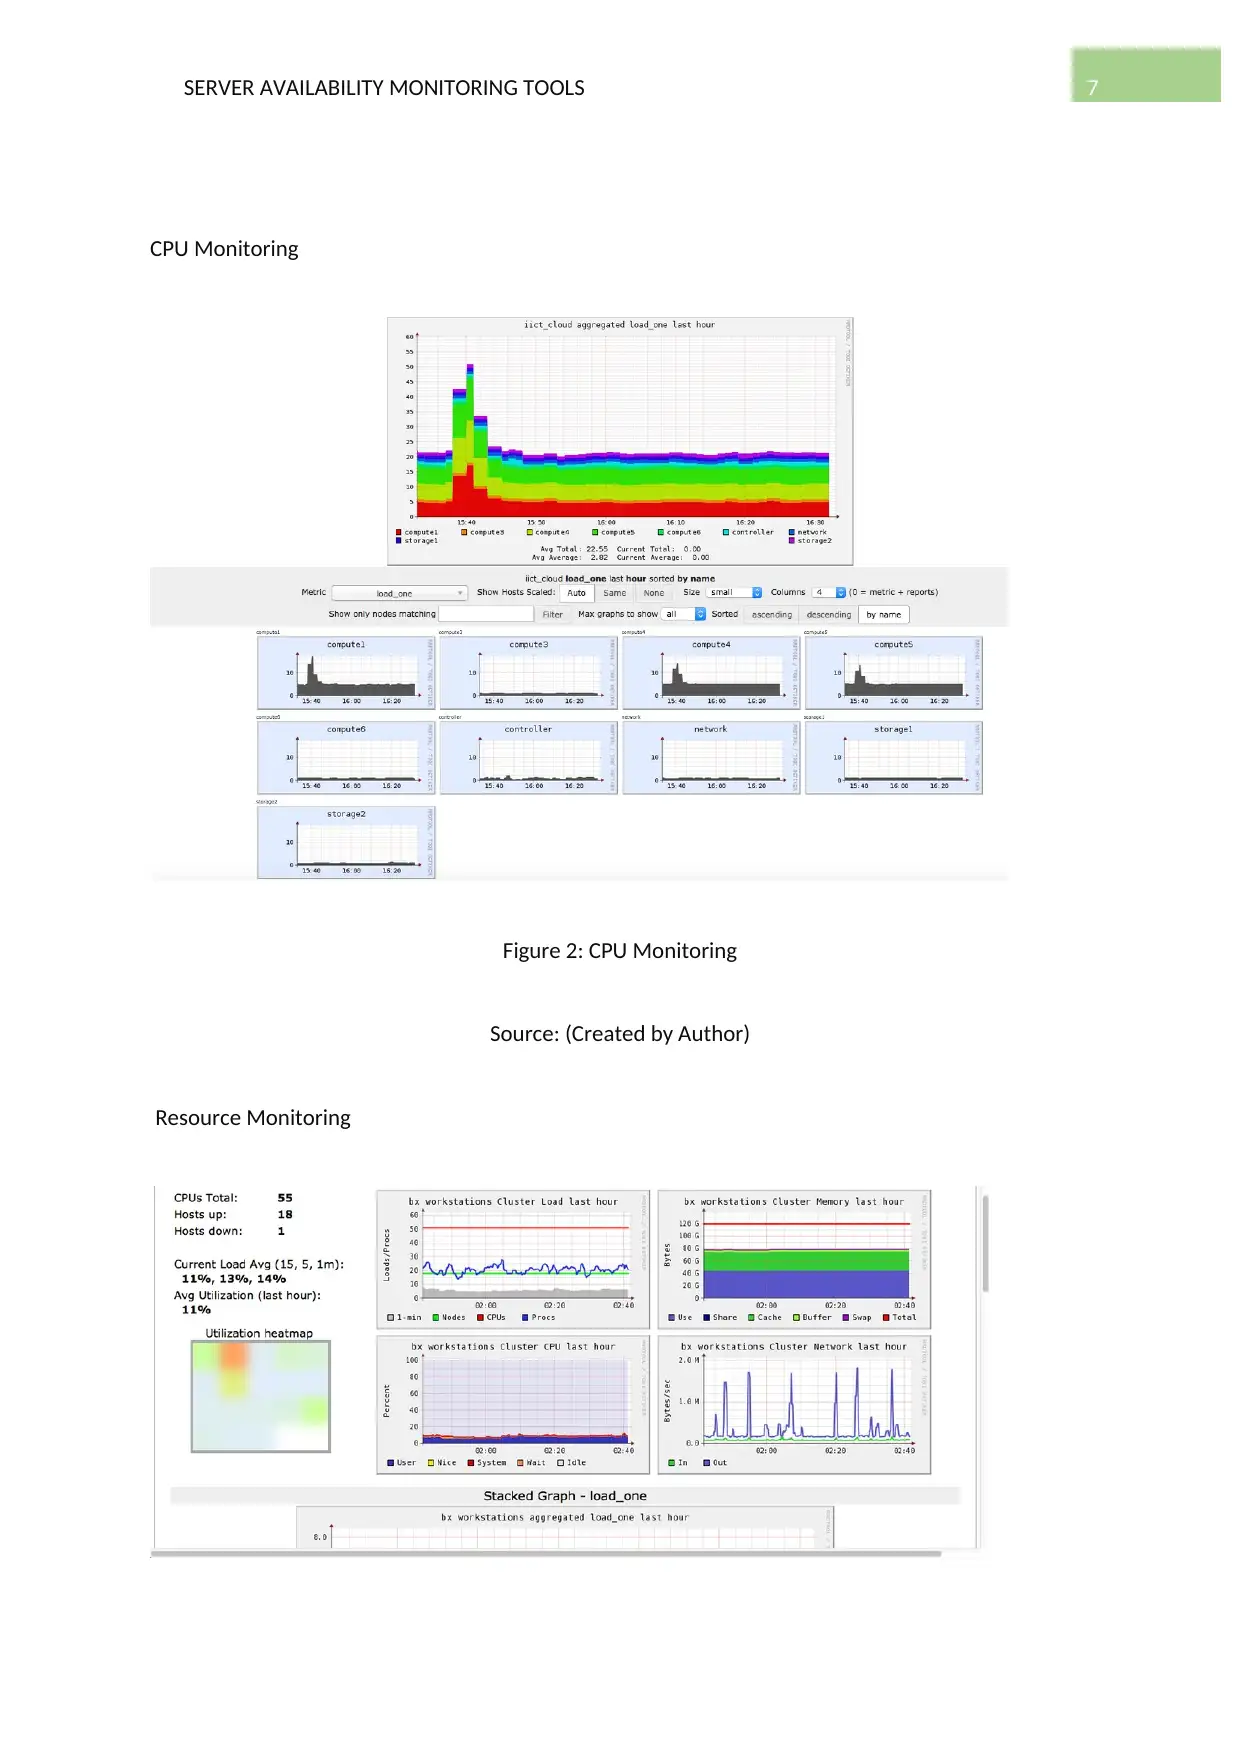
Resource Monitoring
CPU Monitoring
Figure 2: CPU Monitoring
Source: (Created by Author)
Resource Monitoring
8SERVER AVAILABILITY MONITORING TOOLS
Figure 3: Resource Monitoring
Source: (Created by Author)
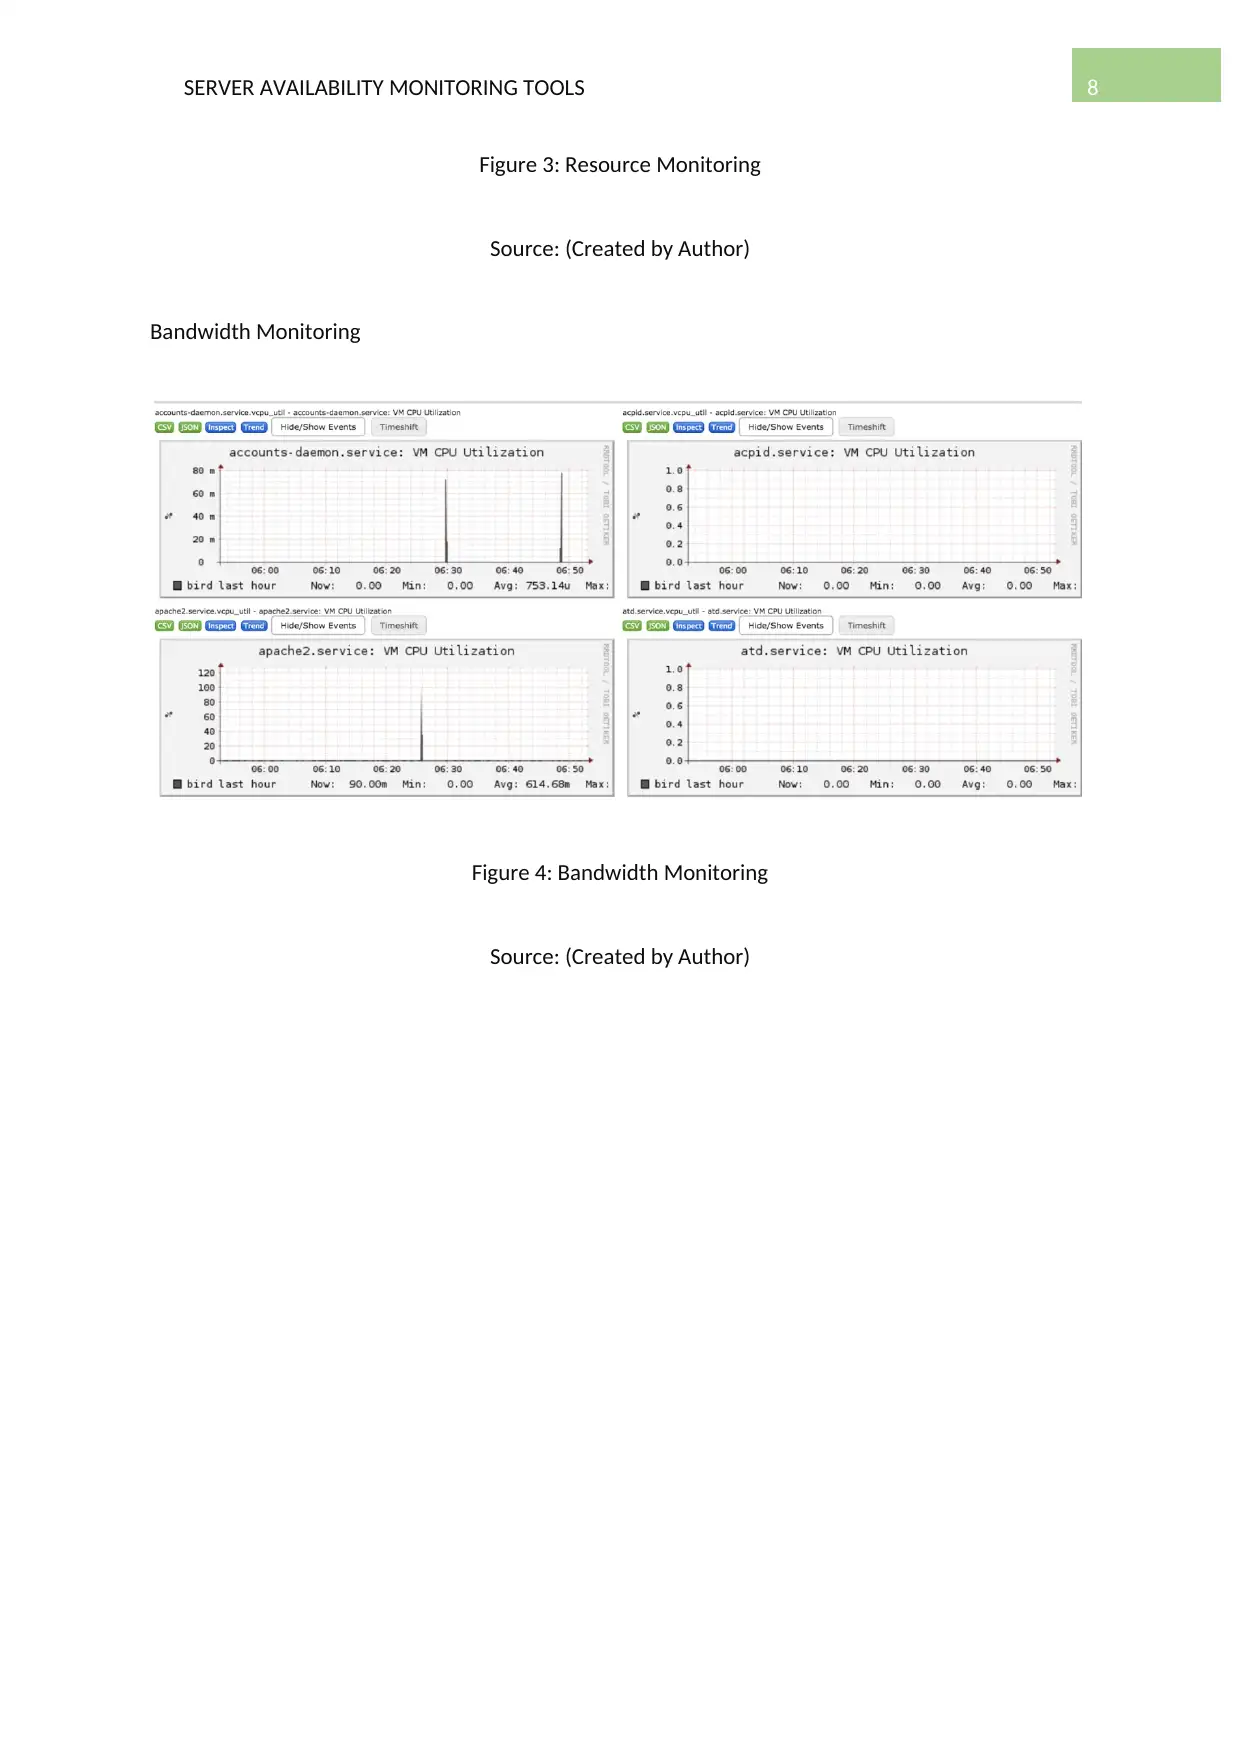
Bandwidth Monitoring
Figure 4: Bandwidth Monitoring
Source: (Created by Author)
Figure 3: Resource Monitoring
Source: (Created by Author)
Bandwidth Monitoring
Figure 4: Bandwidth Monitoring
Source: (Created by Author)
⊘ This is a preview!⊘
Do you want full access?
Subscribe today to unlock all pages.
Trusted by 1+ million students worldwide
9SERVER AVAILABILITY MONITORING TOOLS
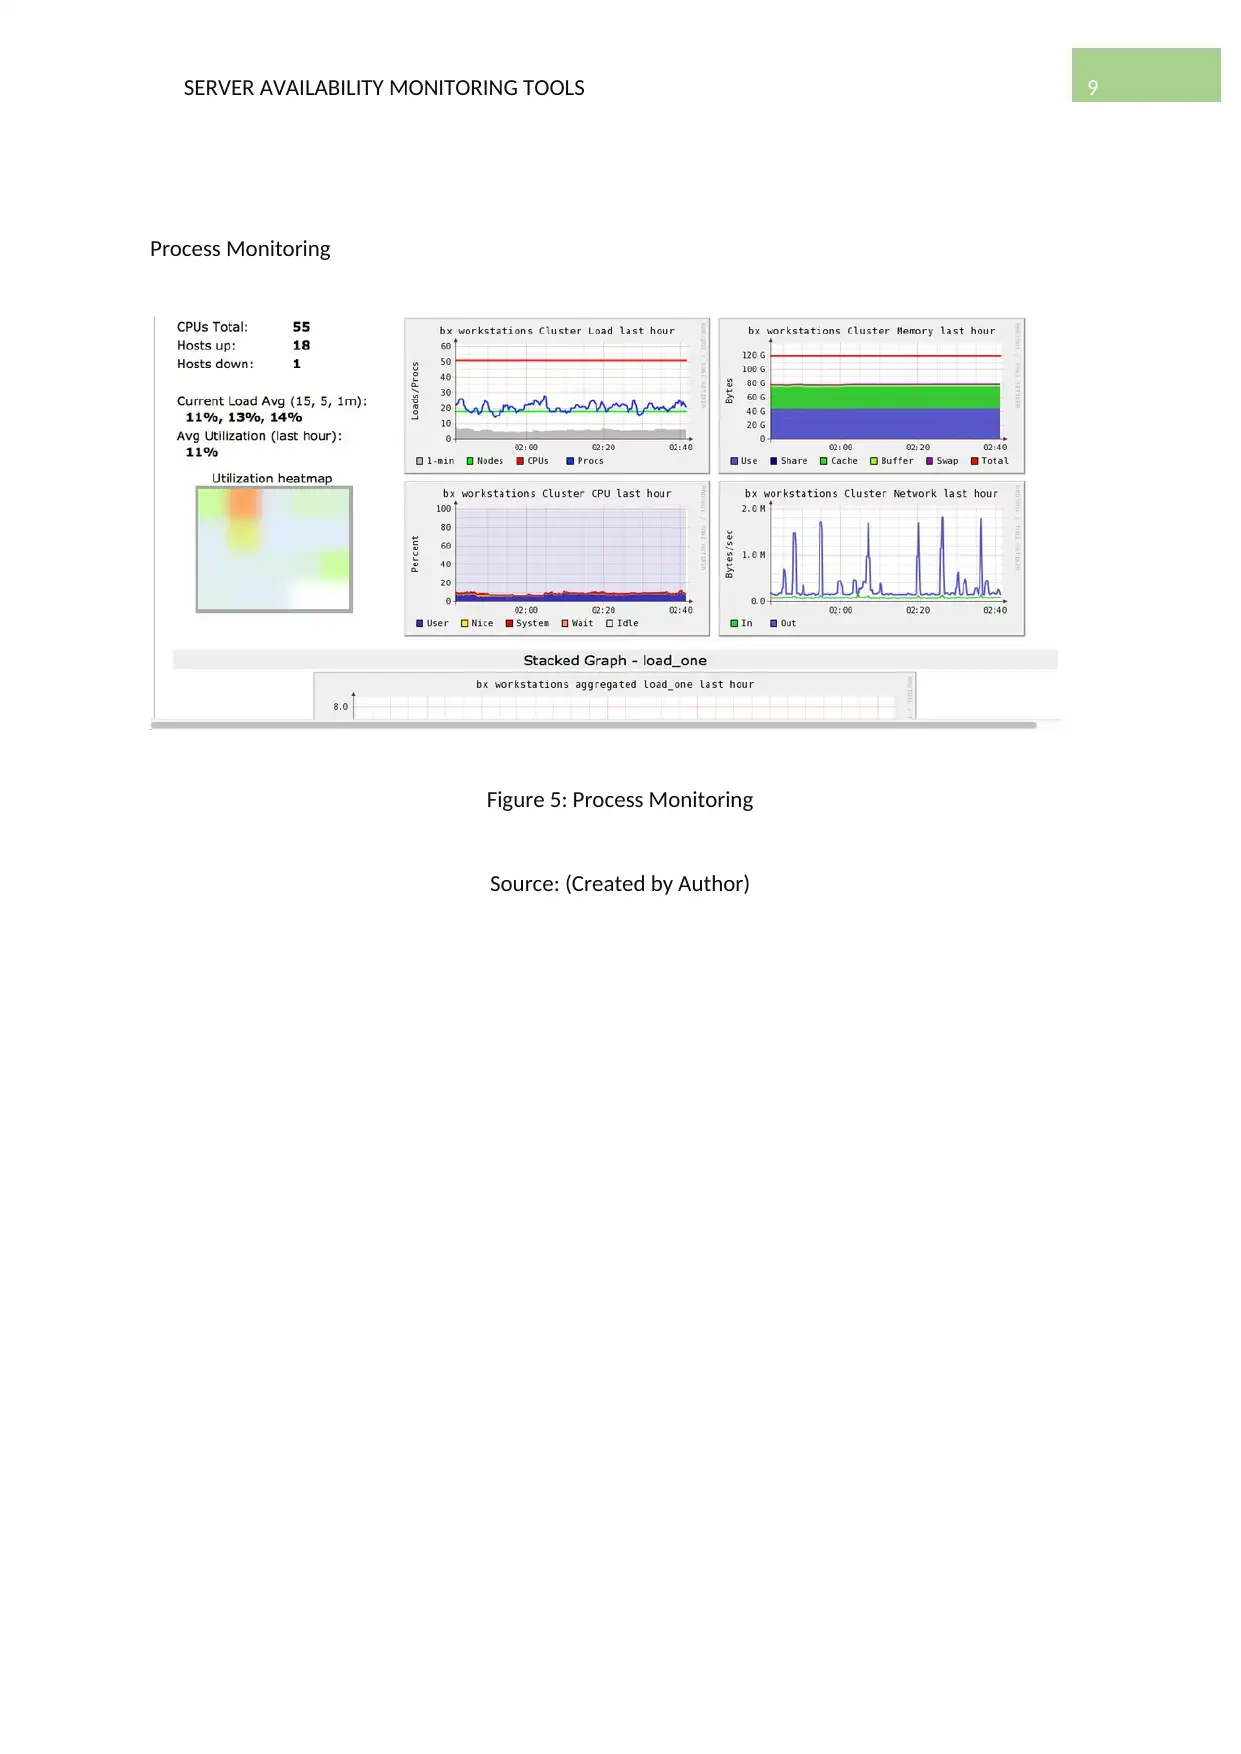
Process Monitoring
Figure 5: Process Monitoring
Source: (Created by Author)
Process Monitoring
Figure 5: Process Monitoring
Source: (Created by Author)
Paraphrase This Document
Need a fresh take? Get an instant paraphrase of this document with our AI Paraphraser
10SERVER AVAILABILITY MONITORING TOOLS
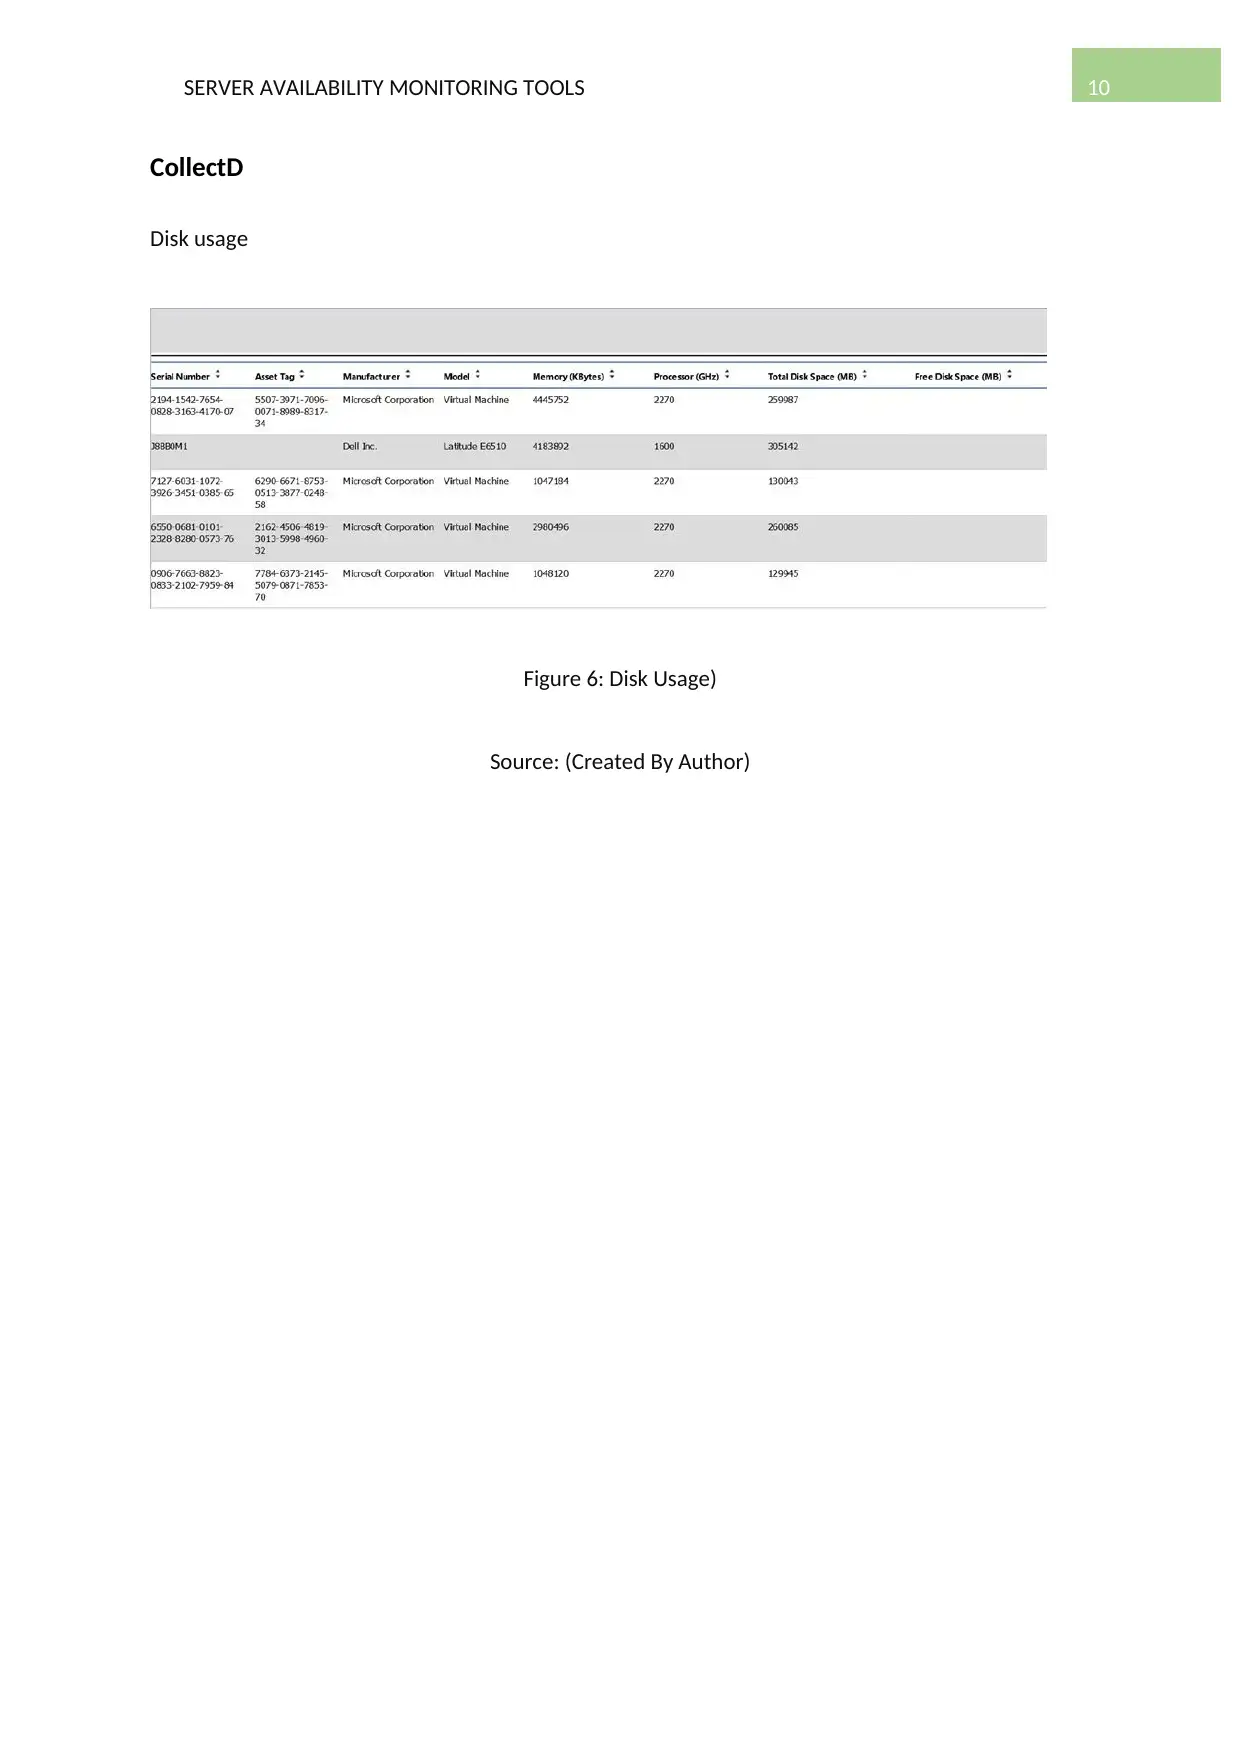
CollectD
Disk usage
Figure 6: Disk Usage)
Source: (Created By Author)
CollectD
Disk usage
Figure 6: Disk Usage)
Source: (Created By Author)
11SERVER AVAILABILITY MONITORING TOOLS
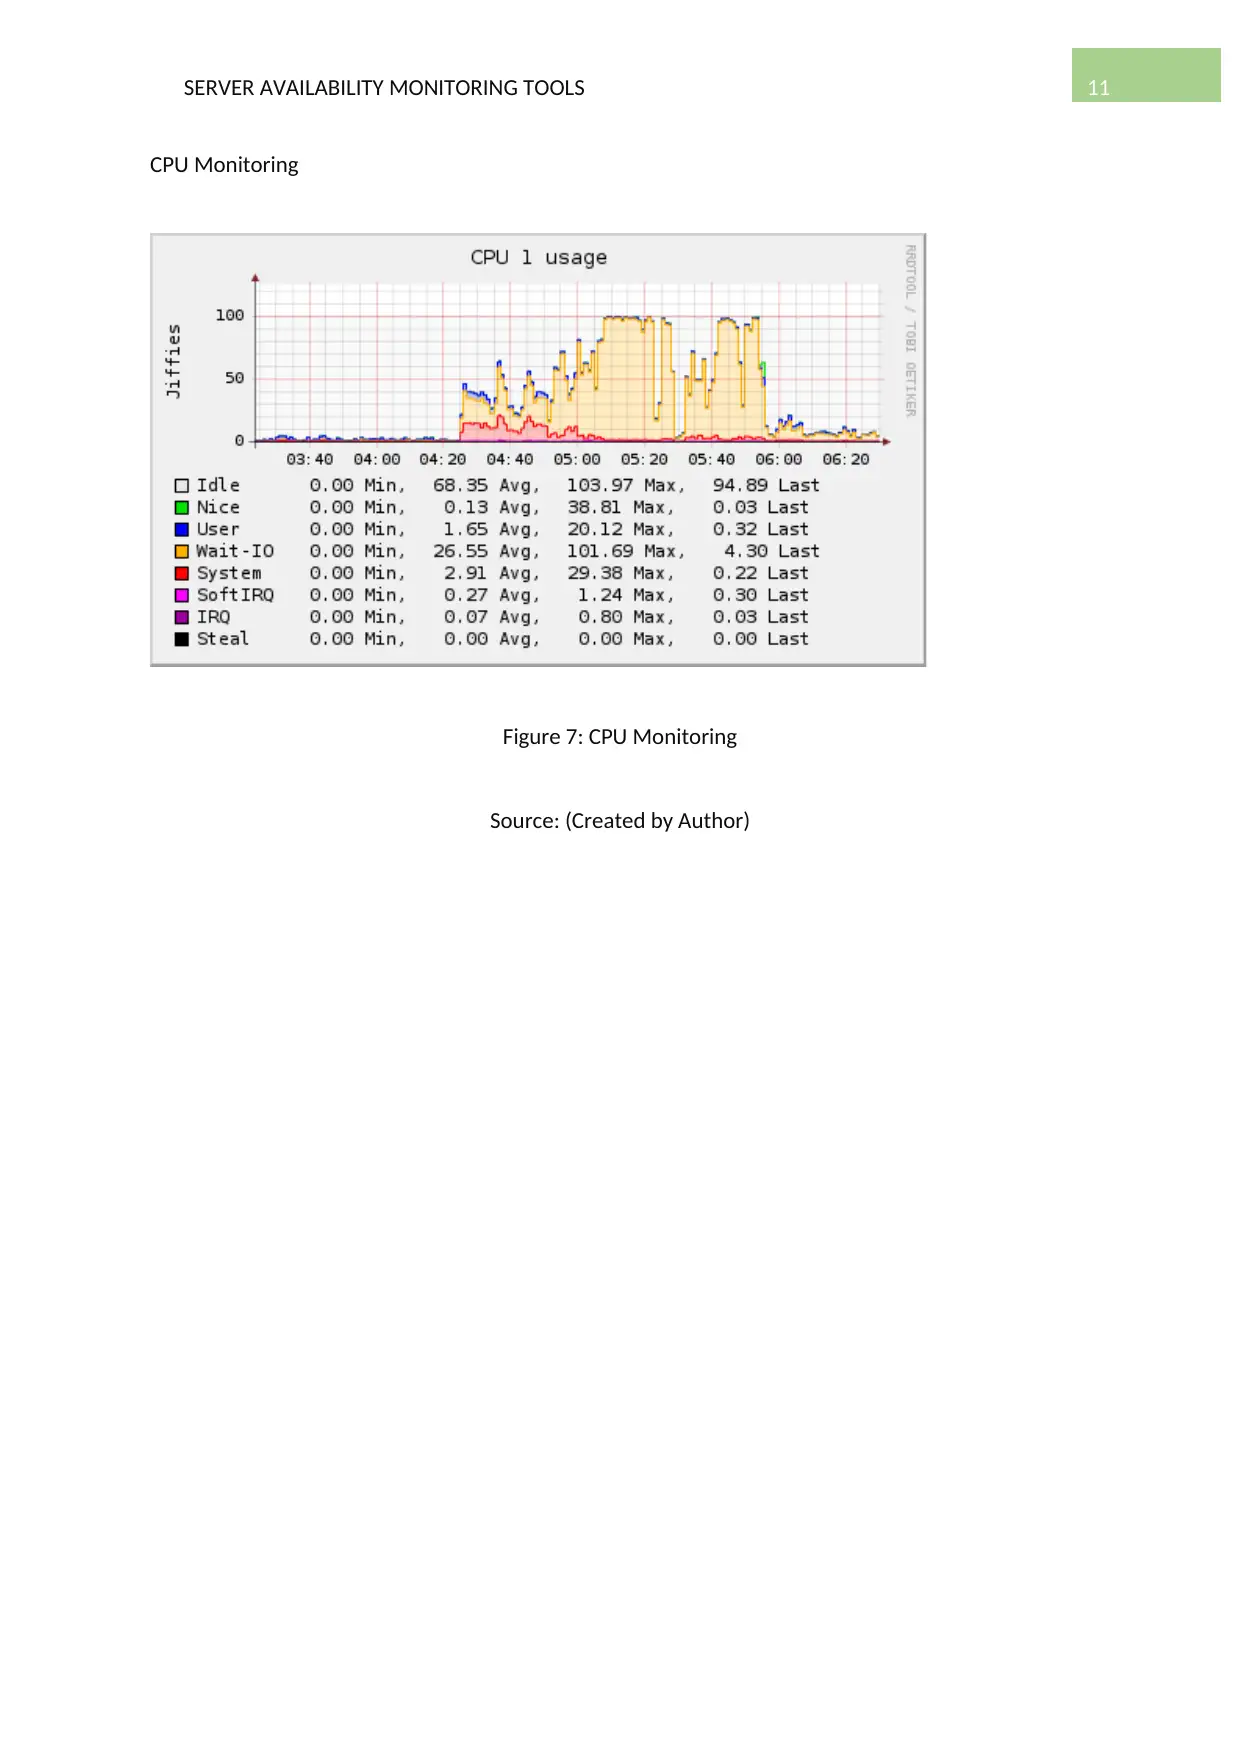
CPU Monitoring
Figure 7: CPU Monitoring
Source: (Created by Author)
CPU Monitoring
Figure 7: CPU Monitoring
Source: (Created by Author)
⊘ This is a preview!⊘
Do you want full access?
Subscribe today to unlock all pages.
Trusted by 1+ million students worldwide
1 out of 45
Related Documents


Your All-in-One AI-Powered Toolkit for Academic Success.
+13062052269
info@desklib.com
Available 24*7 on WhatsApp / Email
![[object Object]](/_next/static/media/star-bottom.7253800d.svg)
Unlock your academic potential
Copyright © 2020–2026 A2Z Services. All Rights Reserved. Developed and managed by ZUCOL.