BSc Accounting: Service vs. Product Accounting Report, Spring 2020
VerifiedAdded on 2022/09/21
|11
|2013
|22
Report
AI Summary
This report provides a comprehensive analysis of service versus product accounting, comparing and contrasting the characteristics of service, manufacturing, and merchandising industries. It explores the implications of limitation of liability clauses in commercial transactions, detailing their advantages and limitations, and their role in mitigating risks. The report further delves into the financial metric of dividend payout ratio, explaining its calculation, interpretation, and significance in assessing a company's financial health and sustainability. Finally, it examines the use of fixed asset usage and fixed asset life ratios, illustrating how they can be used to determine the appropriate time for fixed asset replacement, aiding in budgetary planning and operational efficiency. The report uses examples to illustrate the concepts discussed, providing a practical understanding of the topics covered.
Running head: SERVICE vs. PRODUCT ACCOUNTING
SERVICE vs. PRODUCT ACCOUNTING
Name of Student
Name of University
Author’s Note
SERVICE vs. PRODUCT ACCOUNTING
Name of Student
Name of University
Author’s Note
Paraphrase This Document
Need a fresh take? Get an instant paraphrase of this document with our AI Paraphraser
1SERVICE vs. PRODUCT ACCOUNTING
Table of Contents
QUESTION 1:.....................................................................................................................2
QUESTION 2:.....................................................................................................................5
QUESTION 3:.....................................................................................................................6
QUESTION 4:.....................................................................................................................7
REFERENCES:...................................................................................................................9
2SERVICE vs. PRODUCT ACCOUNTING
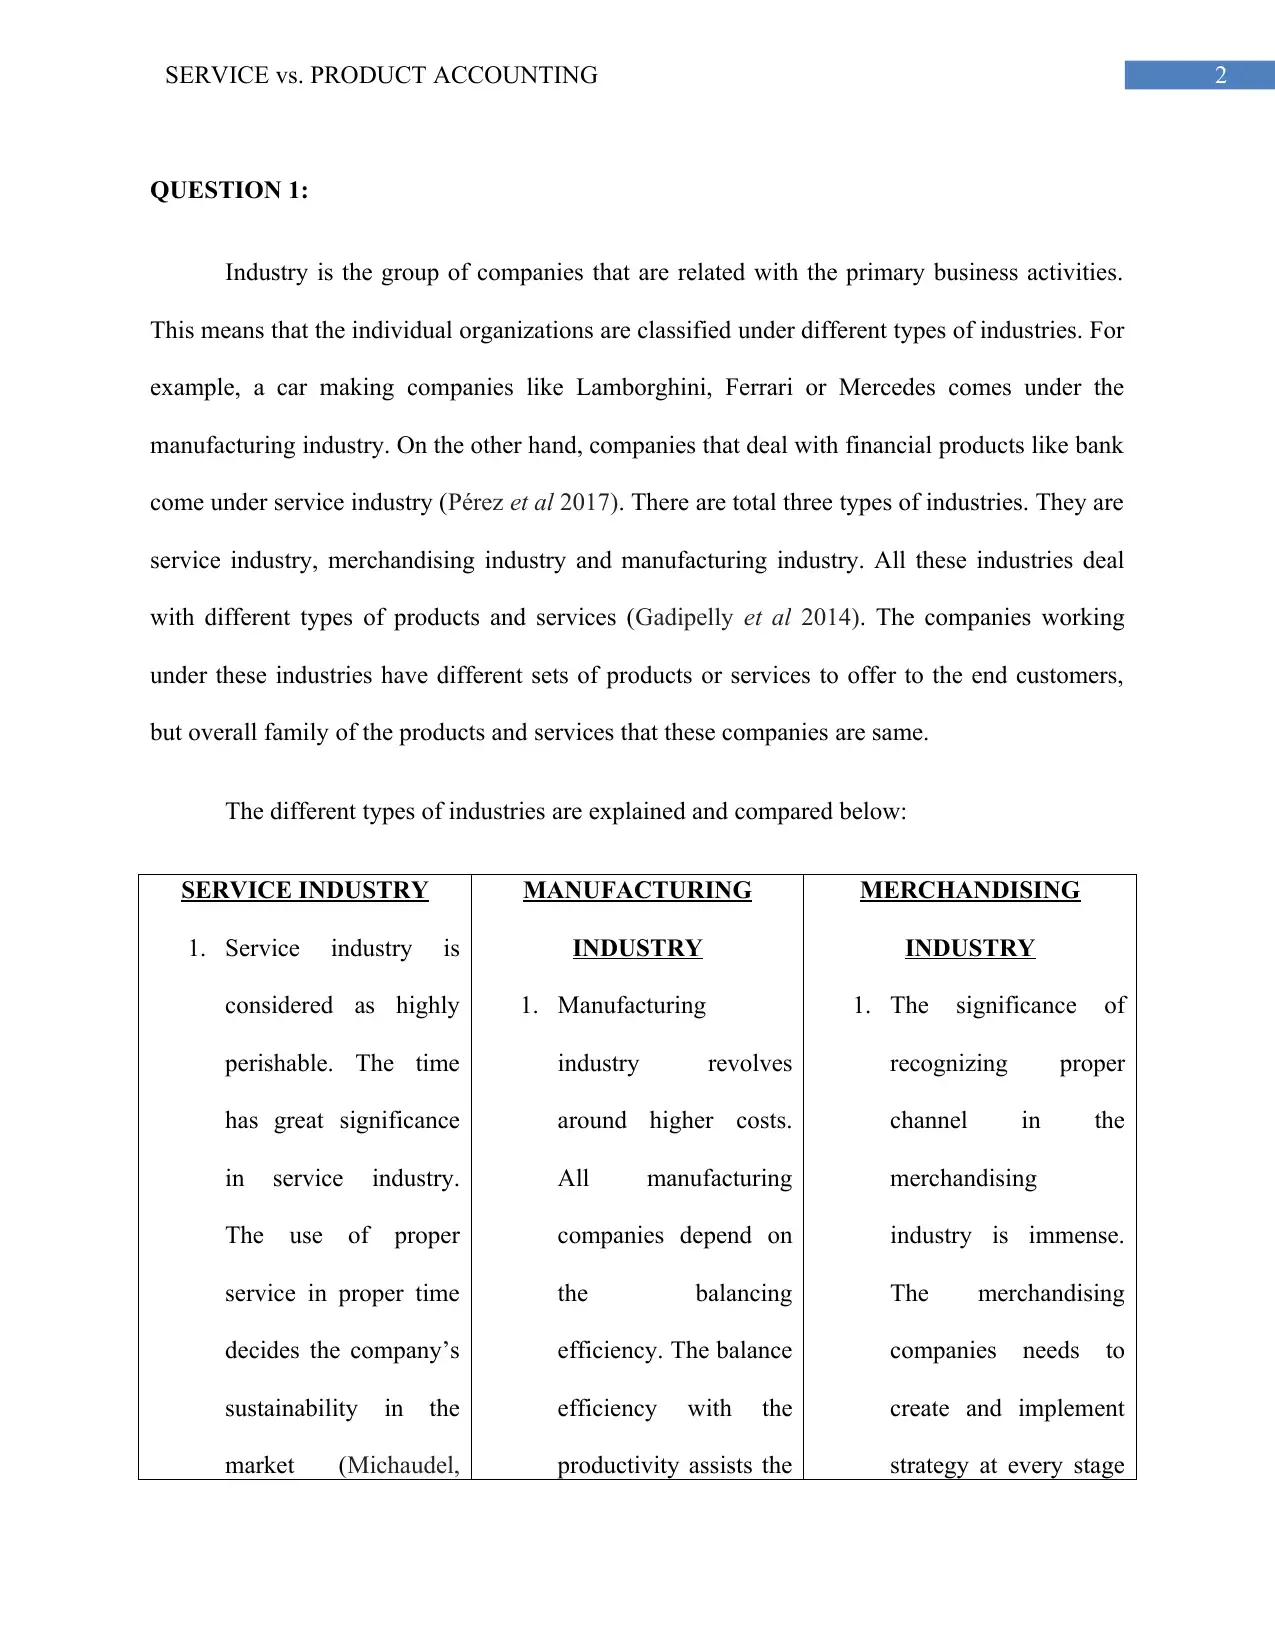
QUESTION 1:
Industry is the group of companies that are related with the primary business activities.
This means that the individual organizations are classified under different types of industries. For
example, a car making companies like Lamborghini, Ferrari or Mercedes comes under the
manufacturing industry. On the other hand, companies that deal with financial products like bank
come under service industry (Pérez et al 2017). There are total three types of industries. They are
service industry, merchandising industry and manufacturing industry. All these industries deal
with different types of products and services (Gadipelly et al 2014). The companies working
under these industries have different sets of products or services to offer to the end customers,
but overall family of the products and services that these companies are same.
The different types of industries are explained and compared below:
SERVICE INDUSTRY
1. Service industry is
considered as highly
perishable. The time
has great significance
in service industry.
The use of proper
service in proper time
decides the company’s
sustainability in the
market (Michaudel,
MANUFACTURING
INDUSTRY
1. Manufacturing
industry revolves
around higher costs.
All manufacturing
companies depend on
the balancing
efficiency. The balance
efficiency with the
productivity assists the
MERCHANDISING
INDUSTRY
1. The significance of
recognizing proper
channel in the
merchandising
industry is immense.
The merchandising
companies needs to
create and implement
strategy at every stage
⊘ This is a preview!⊘
Do you want full access?
Subscribe today to unlock all pages.
Trusted by 1+ million students worldwide
3SERVICE vs. PRODUCT ACCOUNTING
Ishihara and Baran
2015).
2. The service products
are all intangible
products, so no
physical storage is
required in this
industry.
3. Service industry has
high degree of demand
fluctuations. The
demand in this
industry changes
according to the season
or according to the
need of the end
customers.
4. The service of any
company cannot be
separated from
individual. For
example, a haircut is
not possible without
company to earn profit
from the market.
2. The quality control is
one of the most
important aspects of
the manufacturing
industry. In order to
maintain the customer
satisfaction the
manufacturing
companies needs to
increase the quality of
the product.
3. Another major aspect
in the manufacturing
industry is the
designing of the
product. The design of
the product assists the
manufacturing
companies to get
achieves more sales.
4. The cost that
of the marketing.
2. The review of plan for
every stage is very
important for any
company that comes
under the
merchandising
industry.
3. In order to create
greater purchasing
power the companies
of merchandising
industry consolidate
purchasing across
channels.
4. The information
regarding the customer
experience is very
important for the
merchandising
companies.
5. Wal-Mart is the best
example for the
Paraphrase This Document
Need a fresh take? Get an instant paraphrase of this document with our AI Paraphraser
4SERVICE vs. PRODUCT ACCOUNTING
the barber.
5. Pricing of services are
mainly influenced by
perishability,
fluctuations in demand
and insuperability.
6. The best example of
service industry is the
service that IT
companies provide to
their clients.
manufacturing industry
spends in creating a
product determines the
price of the product.
Thus, it is necessary
for the manufacturing
industry to implement
cost-effective strategy,
so that they can reduce
the price of the
product, which will
enable them to gather
more customers in the
market.
5. The car companies like
Mercedes or Aston
Martin creates cars for
their customers are
some of the best
example of
manufacturing
industry.
merchandising
industry who sales
products directly to the
customers.
5SERVICE vs. PRODUCT ACCOUNTING
QUESTION 2:
Commercial transactions carry lots of risks. In order to mitigate the risks the limitation of
liability clause are being created. Limitation of liability is a clause that both parties agree during
any kind of transactions (Aguir et al 2014). As per this clause the amount that one party has to
pay to the other party gets limited if that first party suffers loss. The limitation of liability clause
needs to be created based on the agreement that both the companies have to offer. The limited
liability clause has certain limitations. These limitations are explained below:
1. If one party fails to fulfill the conditions or obligations that are mentioned in the limited
liability clause then the party suffers severe consequences regarding the breach of
contract.
2. The negligence in fulfilling the duty enables the company to make liability, which affects
the profitability of the company (Segerson 2018).
3. If any of the party makes false representation then the contract automatically becomes
null and void.
The main advantage of limitation of liability is as follows:
1. It protects the company from certain liability and claims. The company can safeguard
themselves from unforeseen losses using the limitation of liability.
2. It also protects the company from having any kind of damage by bringing strict rules in
the contract (Elkin-Koren 2014). The rules enable the parties to conduct their business
operations without any kind of problem.
For example an investment company or an individual investor enters into an agreement of
limited liability clause of investment of $1 million, which is also his total liability. This indicates
⊘ This is a preview!⊘
Do you want full access?
Subscribe today to unlock all pages.
Trusted by 1+ million students worldwide
6SERVICE vs. PRODUCT ACCOUNTING
that potentially loss of the investor or investing company is secured. It also states that the
investment company or the individual investor is not liable for any kind of liability till $ 1
million.
QUESTION 3:
The payout ratio is the important financial metric that enable the company to determine
the financial position of the company. It actually does so by analysing the sustainability of the
company. The dividend payout ratio analyses the sustainability through company’s dividend
program. The dividend payment program can be explained as the amount that the company needs
to pay to their shareholders from the net income of the company. The sustainability of the
company can be determined through the total earnings of the company (Giné and Karlan 2014).
The higher the total earnings of the company, it is more likely that the company will pay the high
dividend to their shareholders. The dividend payout ratio is also termed as the payout ratio and it
is calculated using by dividing the total dividends with the net income of the company. The most
favourable payout ratio is 100%. The 100% dividend payout ratio states that the company is
paying high amount of dividend to their shareholders. If the dividend payout ratio is less than
100% then it states that the company’s is paying fewer amounts in comparison to their earnings.
On the contrary if the dividend payout ratio is higher than 100% then it indicates that the
company is paying high dividend in comparison to the total earnings of the company. There is
no specific percentage of dividend payout ratios. The percentage totally depends on the industry
in which company operates in (Hasan et al 2015). The companies who fall under the defensive
industries like pipelines, utilities and telecommunication companies can afford to pay high
dividend after a long haul. Companies that falls under the manufacturing industries works under
Paraphrase This Document
Need a fresh take? Get an instant paraphrase of this document with our AI Paraphraser
7SERVICE vs. PRODUCT ACCOUNTING
very vulnerable market, so it is seen that these companies are more likely to have less dividends
payout ratio in comparison to other industries.
For example, if a company’s total earnings for a single financial year is $1 million and
the management of the company decides to pay dividend of $25,000 then the dividend payout
ratio for the company would be 40% for that company. This also indicates that the company’s
retention ratio is 60%, which will be visible in the retained earnings section of the financial
statements of the annual report.
QUESTION 4:
In order to replace the fixed assets the fixed assets usage and fixed assets life can be used.
Both these ratios state the fixed assets life expectancy. Irrespective of the industry, the
management of the company can use these ratios, so that they can determine the time when the
fixed assets needs to replace. In this way the management of the company can predict the
expenses and create a budget for the company for that financial year.
The fixed assets usage determines the usage of the fixed assets. In this way the
management of the company can easily determine the importance of the fixed assets. The
formula for calculating the fixed assets usage is the Accumulated depreciation divided by the
gross depreciation fixed assets. The fixed usage ratio always provides answers in percentage. On
the other hand, fixed assets life states about the remaining life of the fixed assets. In order to
calculate the fixed assets life net depreciable fixed assets needs to divided from depreciable
expense.
For example, a delivery van, which is considered as the fixed asset has the life usage of
70% and the fixed asset life for that van is 3 months. This indicates that the van has the high

8SERVICE vs. PRODUCT ACCOUNTING
percentage of use and the life expectancy of the van is also less. This states the company needs to
think for changing the van, so that business operation does not get hampered.
percentage of use and the life expectancy of the van is also less. This states the company needs to
think for changing the van, so that business operation does not get hampered.
⊘ This is a preview!⊘
Do you want full access?
Subscribe today to unlock all pages.
Trusted by 1+ million students worldwide
9SERVICE vs. PRODUCT ACCOUNTING
REFERENCES:
Aguir, I., Burns, N., Mansi, S.A. and Wald, J.K., 2014. Liability protection, director
compensation, and incentives. Journal of Financial Intermediation, 23(4), pp.570-589.
Ahmed, I.E., 2015. Liquidity, profitability and the dividends payout policy. World Review of
Business Research, 5(2), pp.73-85.
Demirgüneş, K., 2015. Determinants of target dividend payout ratio: A panel autoregressive
distributed lag analysis. International Journal of Economics and Financial Issues, 5(2), pp.418-
426.
Elkin-Koren, N., 2014. After twenty years: Copyright liability of online intermediaries. The
Evolution and Equilibrium of Copyright in the Digital Age (Susy Frankel & Daniel J Gervais
eds.)(2014 Forthcoming).
Gadipelly, C., Pérez-González, A., Yadav, G.D., Ortiz, I., Ibáñez, R., Rathod, V.K. and Marathe,
K.V., 2014. Pharmaceutical industry wastewater: review of the technologies for water treatment
and reuse. Industrial & Engineering Chemistry Research, 53(29), pp.11571-11592.
Giné, X. and Karlan, D.S., 2014. Group versus individual liability: Short and long term evidence
from Philippine microcredit lending groups. Journal of development Economics, 107, pp.65-83.
Hasan, M., Ahmad, M.I., Rafiq, M.Y. and Rehman, R.U., 2015. Dividend payout ratio and firm’s
profitability. Evidence from Pakistan. Theoretical Economics Letters, 5(03), p.441.
Paraphrase This Document
Need a fresh take? Get an instant paraphrase of this document with our AI Paraphraser
10SERVICE vs. PRODUCT ACCOUNTING
Michaudel, Q., Ishihara, Y. and Baran, P.S., 2015. Academia–industry symbiosis in organic
chemistry. Accounts of chemical research, 48(3), pp.712-721.
Pérez, J.F., Llanos, J., Sá ez, C., López, C., Cañ izares, P. and Rodrigo, M.A., 2017. Treatment of
real effluents from the pharmaceutical industry: a comparison between Fenton oxidation and
conductive-diamond electro-oxidation. Journal of environmental management, 195, pp.216-223.
Segerson, K., 2018. Liability for groundwater contamination from pesticides. The Economics of
Water Quality.
1 out of 11
Related Documents


Your All-in-One AI-Powered Toolkit for Academic Success.
+13062052269
info@desklib.com
Available 24*7 on WhatsApp / Email
![[object Object]](/_next/static/media/star-bottom.7253800d.svg)
Unlock your academic potential
Copyright © 2020–2026 A2Z Services. All Rights Reserved. Developed and managed by ZUCOL.