SERVQUAL Analysis: Service Quality Gaps in McDonald's Dago, Indonesia
VerifiedAdded on 2021/10/27
|10
|4028
|216
Report
AI Summary
This report presents a gap analysis of service quality at McDonald's Dago in Bandung, Indonesia, utilizing the SERVQUAL model. The research, conducted using questionnaires distributed to ITB undergraduate students, assesses customer expectations and perceptions across five dimensions: tangibility, reliability, responsiveness, empathy, and assurance. The study reveals negative customer gaps across all dimensions, indicating that McDonald's Dago did not fully meet customer expectations. The analysis includes demographic data of the respondents, with the majority being from the School of Business and Management and having an income between 1,000,000 to 3,000,000 Rupiahs. Despite a high satisfaction rate reported by the respondents, the gap analysis highlights areas for improvement in service delivery. The research concludes with a call to minimize these gaps to enhance customer satisfaction and competitiveness, suggesting that improvements should start with the dimension exhibiting the widest gap.
755
JOURNAL OF
BUSINESS AND MANAGEMENT
Vol. 4, No.7, 2015: 755-764
GAP ANALYSIS TOWARDS SERVICE QUALITY IN MCDONALD’S DA
Ni Putu Radha Naraswari and Ira Fachira
School of Business and Management
Institut Teknologi Bandung, Indonesia
putu.radha@sbm-itb.ac.id
Abstract.The raising numbers of fast food restaurants nowadays are the result of the increasing
relatively inexpensive, and ready-to-eat food. This condition makes the competition among fast food re
getting bigger. To deal with the high competition in fast food market, McDonald’s Dago as one of the
restaurant in Bandung should provide the best service to make customer satisfied. By measur
quality, McDonald’s Dago will be able to know whether the service that has been provided satisfies its
or not. The purpose of this research is to measure the service quality by using the SERVQUAL method.
five dimensionsin SERVQUAL method,whichare tangibledimension,reliabilitydimension,responsiveness
dimension, empathy dimension, and assurance dimension. In this research, the service quality
Dago will be measured by calculating the differences between customers’ expectation and customers’
This difference is called customer gap. From the customer gap result, it is possible to know w
dimension that customers’ feel satisfied from service that provided by McDonald’s Dago. The d
this research will be from primary data, which is questionnaire. There are 22 statements in the questio
are from SERVQUAL model, and the questionnaire will be spread to 100 respondents of ITB U
students. The data analysis shows that all of the customer gaps are negative, which means the service
been provided by McDonald’s Dago did not meet customers’ expectation.
Keywords: Service quality, SERVQUAL, Customer Gaps, Customer Perception, Customer Expectation, R
industry
Introduction
Migration from rural areas to urban centers has created a daily need among many working p
eat outsidethe home.Demandfor relativelyinexpensive,ready-to-eatfood has increasedas
people, have less time to prepare meals (Food Association Organization, 1991). This conditio
stimulated a rise in the number of fast food restaurants in many countries, including Indones
risingnumbersof fast food restaurantscreatehigh competitionin the market.High levelof
competition makes restaurant have to give attention to many factors, one of them is service
According to Malik, Jaswal, & Awan (2013), customers nowadays not only focused on food qu
and taste, but they also focused on other factors such as serving, atmosphere, decoration, ta
and location.
High quality goods and service are important in business. High service quality perfor
make measurable benefits in profits, market share, and cost savings (Anderson, Fornell, &Le
1994). The other critical factor of business’ success is service quality (Parasuraman,
Berry, 1988). So, it is important for fast food restaurant to have high quality goods and servi
This research limits on the McDonalds Dago as the subject of Fast Food Restaurant
McDonaldsDago, which is locatedin Jalan Juanda.InBandungitself thereare more than 5
McDonalds outlets beside McDonalds Dago. This have greater chance if consumer fe
expectation did not fulfilled, they will not feel satisfied with the service quality in McDonalds
Paraphrase This Document
Need a fresh take? Get an instant paraphrase of this document with our AI Paraphraser
Naraswari and Fachira / Journal of Business and Management, Vol.4, No.7, 2015: 755-764
756
so they will choose another outlet of McDonalds to eat, or other fast food restaurant
Wendy’s, or Burger King. In Dago area itself, there are some other fast food restaurants such
and Pizza Hut. KFC restaurant in Dago, which has almost the same menu and the location is
from McDonald’s Dago could be a threat, if McDonald’s Dago’s servicedo not meet the expec
of the customer, then the customer will choose KFC Dago instead, or another fast food resta
Literature Review
The Definition of Service: According to Philip Kotler (1997) service is an action or an activ
can be offered by a one party to another party, and it is basically intangible and cannot be o
The Definition of Service Quality: Parasuraman, Berry, ad Zeithaml (1985) defined servic
as the difference between customer’s expectation and perception of services, which delivere
service provider. Service quality is important to service firms because it has been shown to i
profit levels, reduce costs, and increase market shares
Customer Expectations are beliefs about service delivery that function as standards
points against which performance of service is judged (Zeithaml, and Bitner, 1996) Th
expectationitself can be determinedfrom WOM (Word of Mouth, personalneeds,and past
experience).
Customer Perception. Perceptions are formed through customers’ assessment of the
service that was provided by service provider and whether they are satisfied with the overal
(Zeithaml and Bitner, 2003).
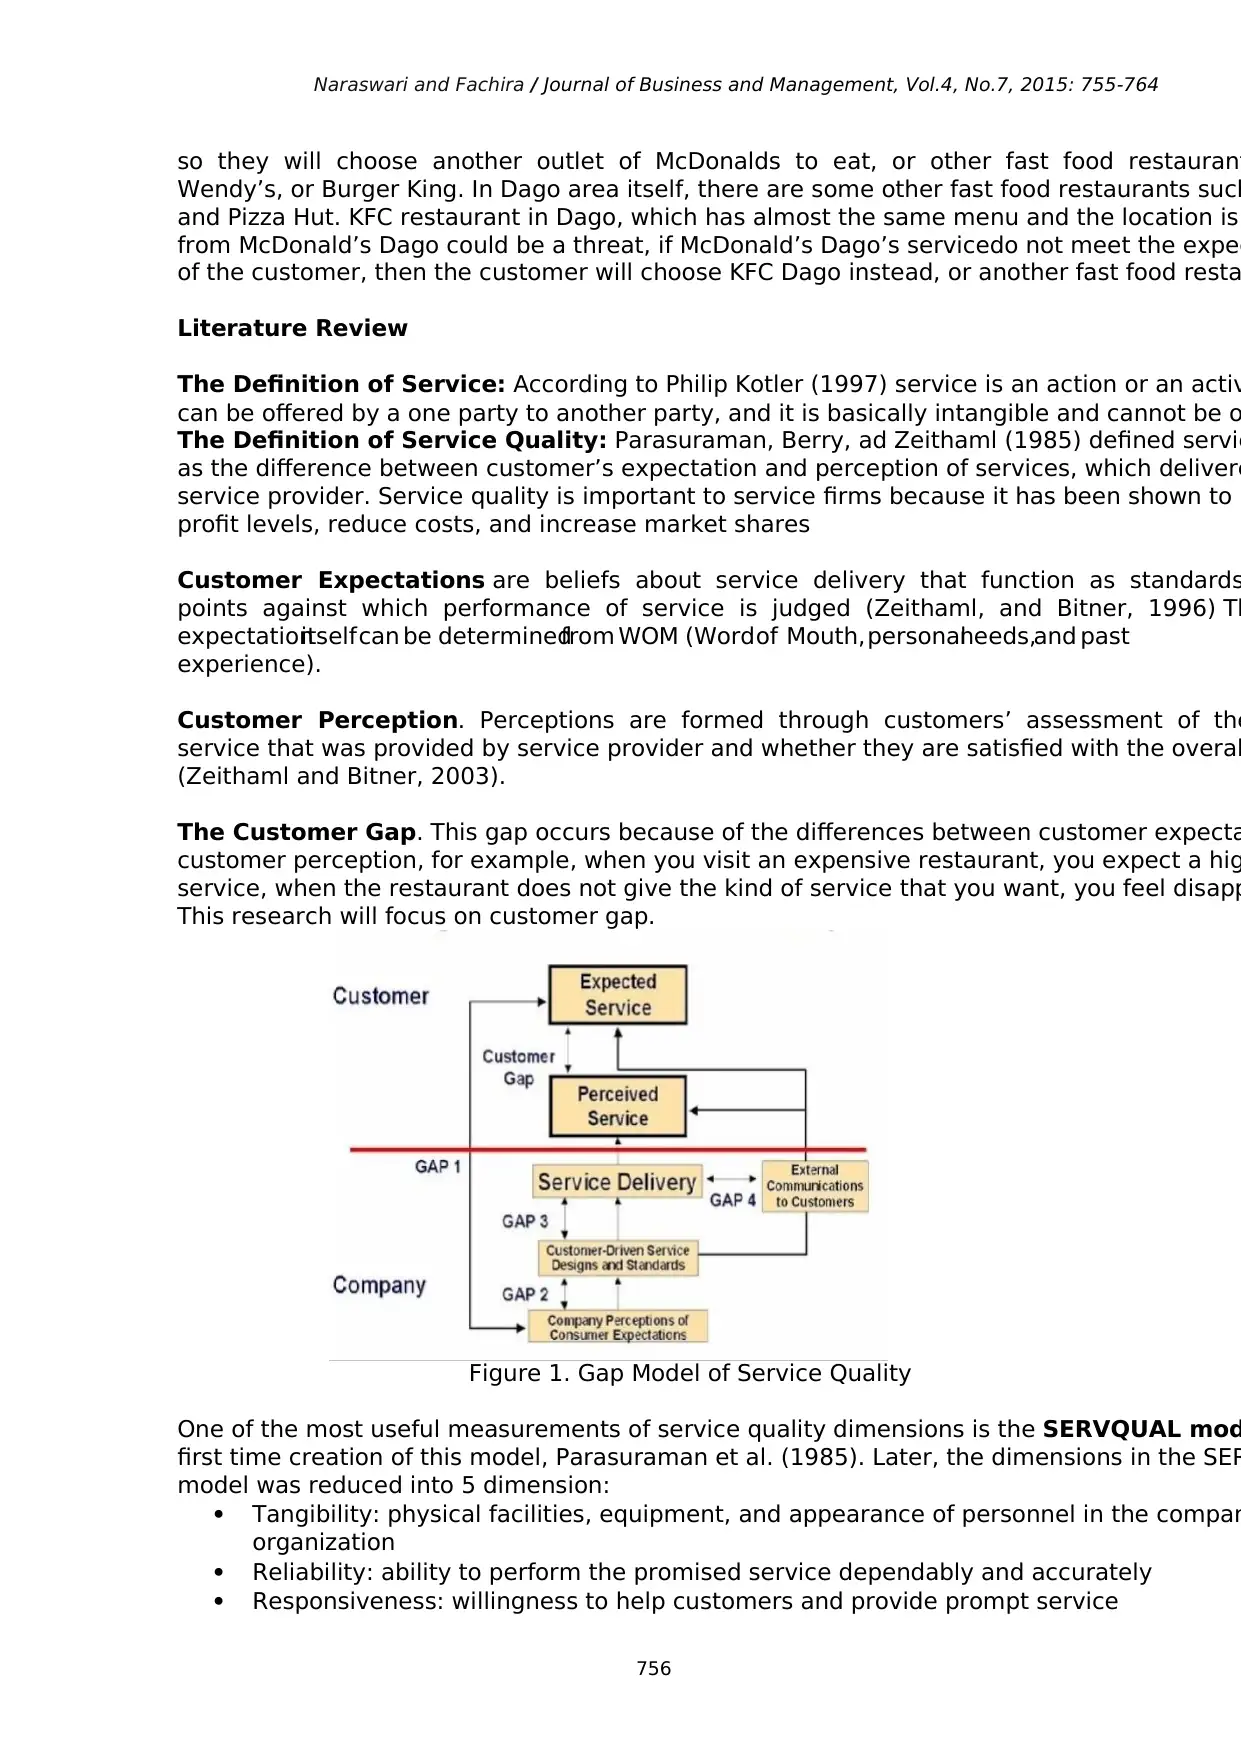
The Customer Gap. This gap occurs because of the differences between customer expecta
customer perception, for example, when you visit an expensive restaurant, you expect a hig
service, when the restaurant does not give the kind of service that you want, you feel disapp
This research will focus on customer gap.
Figure 1. Gap Model of Service Quality
One of the most useful measurements of service quality dimensions is the SERVQUAL mod
first time creation of this model, Parasuraman et al. (1985). Later, the dimensions in the SER
model was reduced into 5 dimension:
Tangibility: physical facilities, equipment, and appearance of personnel in the compan
organization
Reliability: ability to perform the promised service dependably and accurately
Responsiveness: willingness to help customers and provide prompt service
756
so they will choose another outlet of McDonalds to eat, or other fast food restaurant
Wendy’s, or Burger King. In Dago area itself, there are some other fast food restaurants such
and Pizza Hut. KFC restaurant in Dago, which has almost the same menu and the location is
from McDonald’s Dago could be a threat, if McDonald’s Dago’s servicedo not meet the expec
of the customer, then the customer will choose KFC Dago instead, or another fast food resta
Literature Review
The Definition of Service: According to Philip Kotler (1997) service is an action or an activ
can be offered by a one party to another party, and it is basically intangible and cannot be o
The Definition of Service Quality: Parasuraman, Berry, ad Zeithaml (1985) defined servic
as the difference between customer’s expectation and perception of services, which delivere
service provider. Service quality is important to service firms because it has been shown to i
profit levels, reduce costs, and increase market shares
Customer Expectations are beliefs about service delivery that function as standards
points against which performance of service is judged (Zeithaml, and Bitner, 1996) Th
expectationitself can be determinedfrom WOM (Word of Mouth, personalneeds,and past
experience).
Customer Perception. Perceptions are formed through customers’ assessment of the
service that was provided by service provider and whether they are satisfied with the overal
(Zeithaml and Bitner, 2003).
The Customer Gap. This gap occurs because of the differences between customer expecta
customer perception, for example, when you visit an expensive restaurant, you expect a hig
service, when the restaurant does not give the kind of service that you want, you feel disapp
This research will focus on customer gap.
Figure 1. Gap Model of Service Quality
One of the most useful measurements of service quality dimensions is the SERVQUAL mod
first time creation of this model, Parasuraman et al. (1985). Later, the dimensions in the SER
model was reduced into 5 dimension:
Tangibility: physical facilities, equipment, and appearance of personnel in the compan
organization
Reliability: ability to perform the promised service dependably and accurately
Responsiveness: willingness to help customers and provide prompt service

Naraswari and Fachira / Journal of Business and Management, Vol.4, No.7, 2015: 755-764
757
Assurance: knowledge and courtesy of employees and their ability to inspire tr
confidence
Empathy: caring individualized attention the firm provides to its customers
The zone of tolerance is usually defined as the range of customer perceptions of a service
desired and minimum acceptable standards (Zeithaml, Berry, and Parasuraman, 1993).
Figure 2. The Zone of Tolerance
Methodology
Problem Identification:To identify the problem, first, the author will define the object of
research, which is McDonald’s Dago. Then, the author tries to define problems that e
objective of the research. From this, the author decides the topic of the research is
towards service quality in McDonald’s Dago using SERVQUAL model”.
ResearchQuestion:To identify research question, the author do the following steps such
identify the problem, brainstorming possible research question, preliminary research, a
ideas into top two.
DataCollection:This research use primary data. The data collection of this step isby using
questionnaire. The questionnaire is by using Likert scale, with scale range from 1 – 5
Disagree, 2=Disagree, 3=Moderate, 4=Agree, 5=Strongly Agree).
Table 1. Questionnaire Design
Variable Definition Items
Tangible Physical facilities,
equipment, and appearance
of personnel in the
company or organization
McDonald'sDago has modern
looking equipment.
The employeesof McDonald’s
Dago appear neat.
Physical facilities in McDonald’s
Dago are appealing.
Materialsassociatedwith the
service(suchas pamphletsor
logo) are visuallyappealingat
McDonald's Dago.
Reliability Ability to perform the
promised service
dependably and accurately
McDonald’s Dago performs
services like their promise.
McDonald’s Dago sympathizing
towards their customers.
McDonald’sDago giving the
accurate service.
⊘ This is a preview!⊘
Do you want full access?
Subscribe today to unlock all pages.
Trusted by 1+ million students worldwide
Naraswari and Fachira / Journal of Business and Management, Vol.4, No.7, 2015: 755-764
758
McDonald’sDago providesits
services at the time it promises
to do so.
McDonald’s Dago perform
accurate recording.
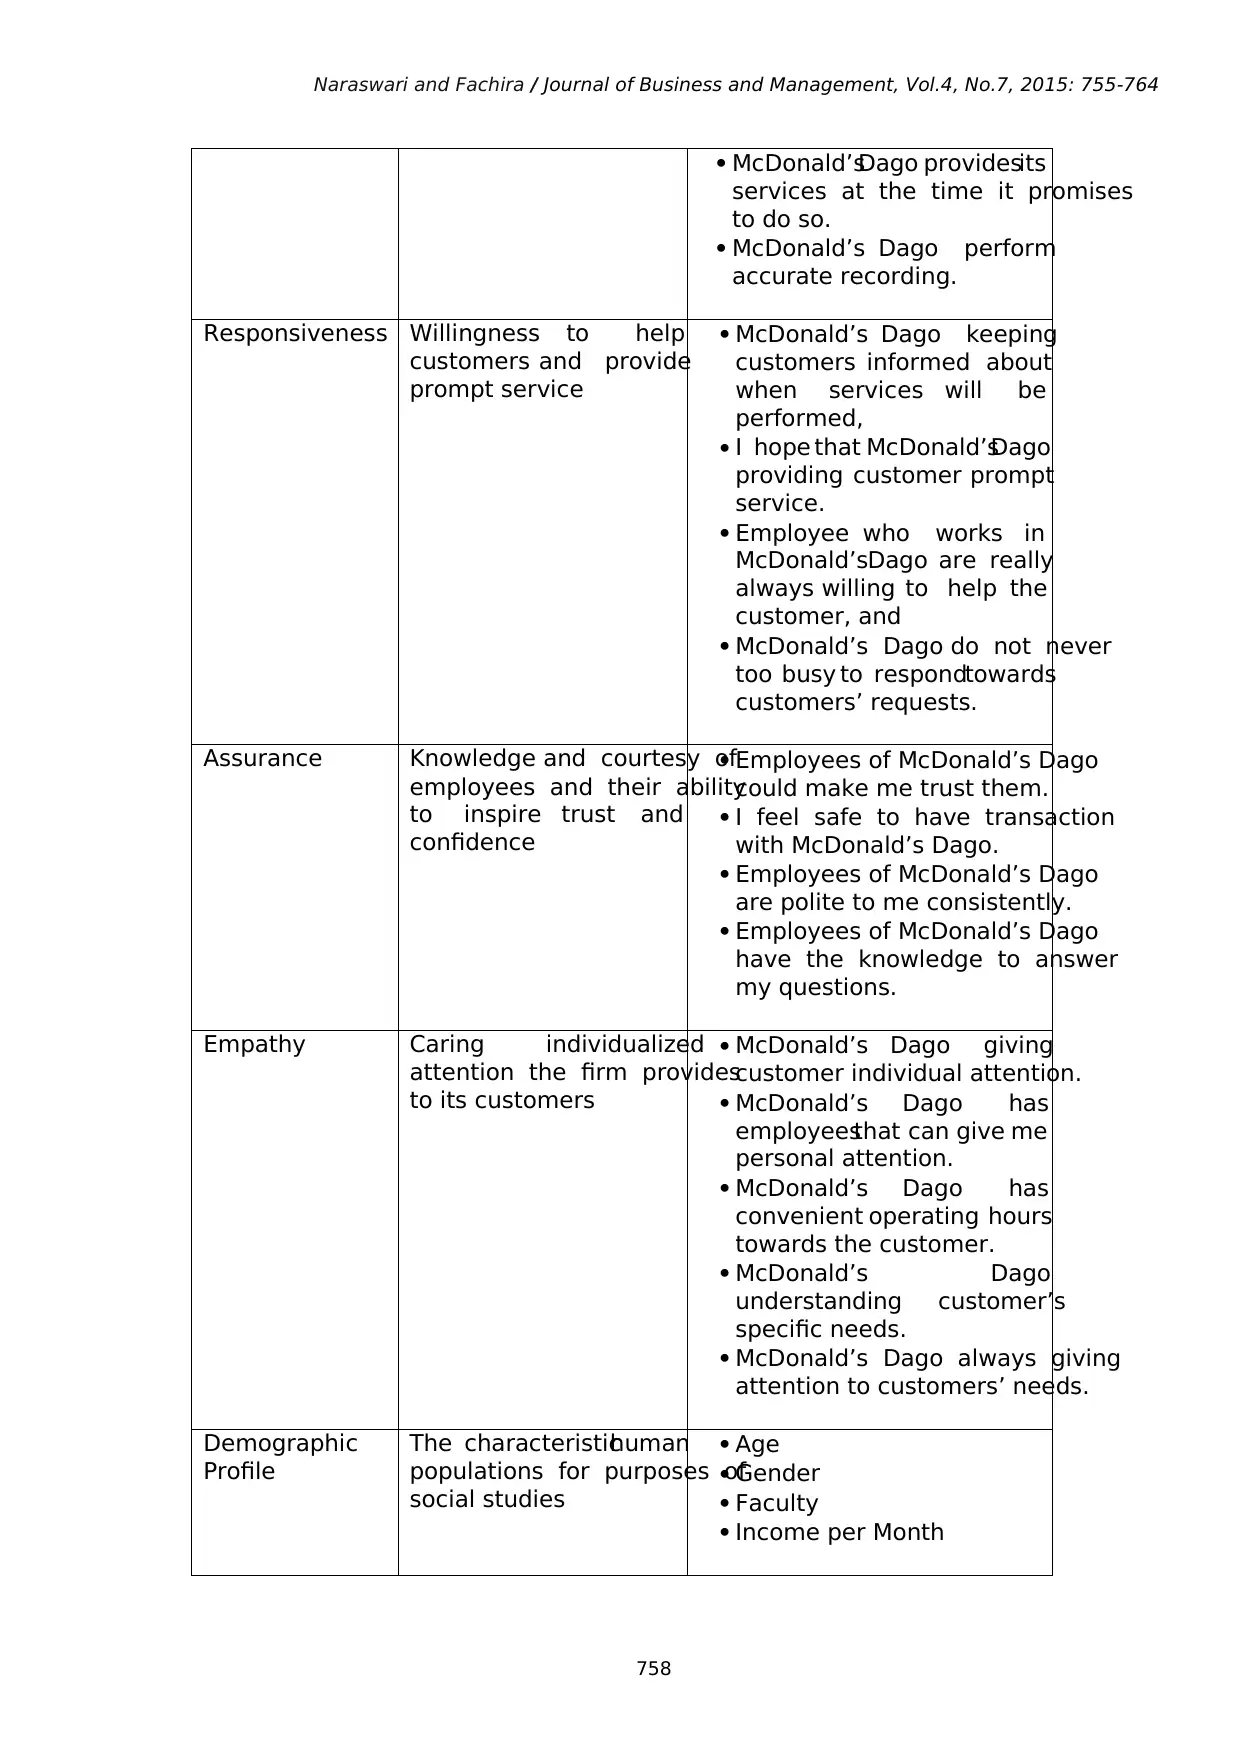
Responsiveness Willingness to help
customers and provide
prompt service
McDonald’s Dago keeping
customers informed about
when services will be
performed,
I hope that McDonald’sDago
providing customer prompt
service.
Employee who works in
McDonald’sDago are really
always willing to help the
customer, and
McDonald’s Dago do not never
too busy to respondtowards
customers’ requests.
Assurance Knowledge and courtesy of
employees and their ability
to inspire trust and
confidence
Employees of McDonald’s Dago
could make me trust them.
I feel safe to have transaction
with McDonald’s Dago.
Employees of McDonald’s Dago
are polite to me consistently.
Employees of McDonald’s Dago
have the knowledge to answer
my questions.
Empathy Caring individualized
attention the firm provides
to its customers
McDonald’s Dago giving
customer individual attention.
McDonald’s Dago has
employeesthat can give me
personal attention.
McDonald’s Dago has
convenient operating hours
towards the customer.
McDonald’s Dago
understanding customer’s
specific needs.
McDonald’s Dago always giving
attention to customers’ needs.
Demographic
Profile
The characteristichuman
populations for purposes of
social studies
Age
Gender
Faculty
Income per Month
758
McDonald’sDago providesits
services at the time it promises
to do so.
McDonald’s Dago perform
accurate recording.
Responsiveness Willingness to help
customers and provide
prompt service
McDonald’s Dago keeping
customers informed about
when services will be
performed,
I hope that McDonald’sDago
providing customer prompt
service.
Employee who works in
McDonald’sDago are really
always willing to help the
customer, and
McDonald’s Dago do not never
too busy to respondtowards
customers’ requests.
Assurance Knowledge and courtesy of
employees and their ability
to inspire trust and
confidence
Employees of McDonald’s Dago
could make me trust them.
I feel safe to have transaction
with McDonald’s Dago.
Employees of McDonald’s Dago
are polite to me consistently.
Employees of McDonald’s Dago
have the knowledge to answer
my questions.
Empathy Caring individualized
attention the firm provides
to its customers
McDonald’s Dago giving
customer individual attention.
McDonald’s Dago has
employeesthat can give me
personal attention.
McDonald’s Dago has
convenient operating hours
towards the customer.
McDonald’s Dago
understanding customer’s
specific needs.
McDonald’s Dago always giving
attention to customers’ needs.
Demographic
Profile
The characteristichuman
populations for purposes of
social studies
Age
Gender
Faculty
Income per Month
Paraphrase This Document
Need a fresh take? Get an instant paraphrase of this document with our AI Paraphraser
Naraswari and Fachira / Journal of Business and Management, Vol.4, No.7, 2015: 755-764
759
Sample of the research will be determined based on Slovin formula from 14320 population o
students year 2014, there will be 99,3 respondents, this number will be rounded to 100 resp
The questionnaire will be spread online throughout social media such as Facebook an
data collection from questionnaire will be from. 17th June until 30th July 2015.
Validity and Reliability:The validity will be tested by comparing the R-value and R-table.
validity test will use by SPSS version 22.00. The item is considered valid if the R va
than R table.The reliabilitytest will be using Cronbach’sAlpha method.This studywill use
Cronbach’s Alpha is 0.700 and above.
Data Analysis
After testing the validity and reliability of the data, then the author of this research will cond
data analysis. The methodology to calculate and analyze the data will be based on gap form
below:
Gap = Perception – Expectation
Result and Conclusion
This research results in finding the gap between customer expectation and customer percep
the gap results were negative, McDonald’s Dago should minimize the gaps by improving its
quality. The improvement of service can start from the dimension that has the widest gap fo
Data Analysis
Respondent Data
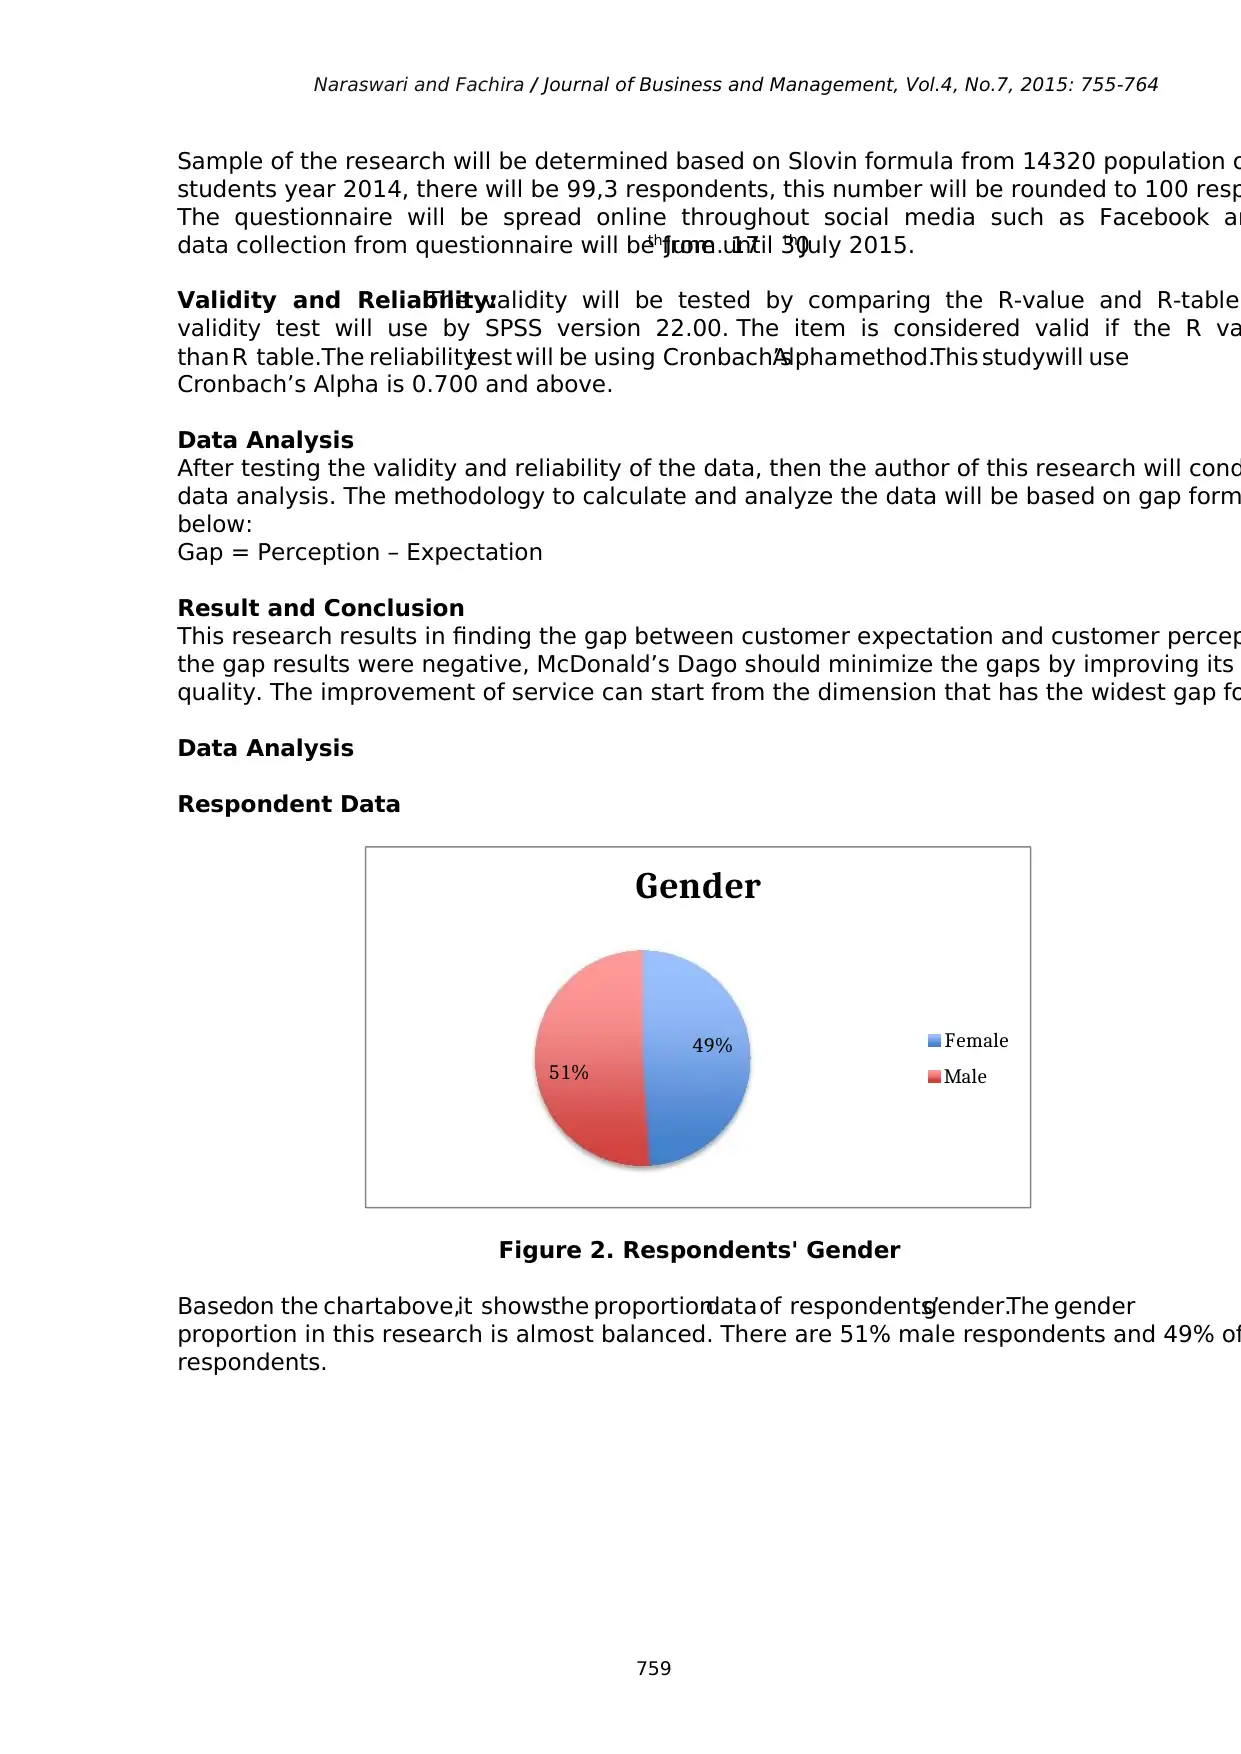
Figure 2. Respondents' Gender
Basedon the chartabove,it showsthe proportiondata of respondents’gender.The gender
proportion in this research is almost balanced. There are 51% male respondents and 49% of
respondents.
49%
51%
Gender
Female
Male
759
Sample of the research will be determined based on Slovin formula from 14320 population o
students year 2014, there will be 99,3 respondents, this number will be rounded to 100 resp
The questionnaire will be spread online throughout social media such as Facebook an
data collection from questionnaire will be from. 17th June until 30th July 2015.
Validity and Reliability:The validity will be tested by comparing the R-value and R-table.
validity test will use by SPSS version 22.00. The item is considered valid if the R va
than R table.The reliabilitytest will be using Cronbach’sAlpha method.This studywill use
Cronbach’s Alpha is 0.700 and above.
Data Analysis
After testing the validity and reliability of the data, then the author of this research will cond
data analysis. The methodology to calculate and analyze the data will be based on gap form
below:
Gap = Perception – Expectation
Result and Conclusion
This research results in finding the gap between customer expectation and customer percep
the gap results were negative, McDonald’s Dago should minimize the gaps by improving its
quality. The improvement of service can start from the dimension that has the widest gap fo
Data Analysis
Respondent Data
Figure 2. Respondents' Gender
Basedon the chartabove,it showsthe proportiondata of respondents’gender.The gender
proportion in this research is almost balanced. There are 51% male respondents and 49% of
respondents.
49%
51%
Gender
Female
Male
Naraswari and Fachira / Journal of Business and Management, Vol.4, No.7, 2015: 755-764
760
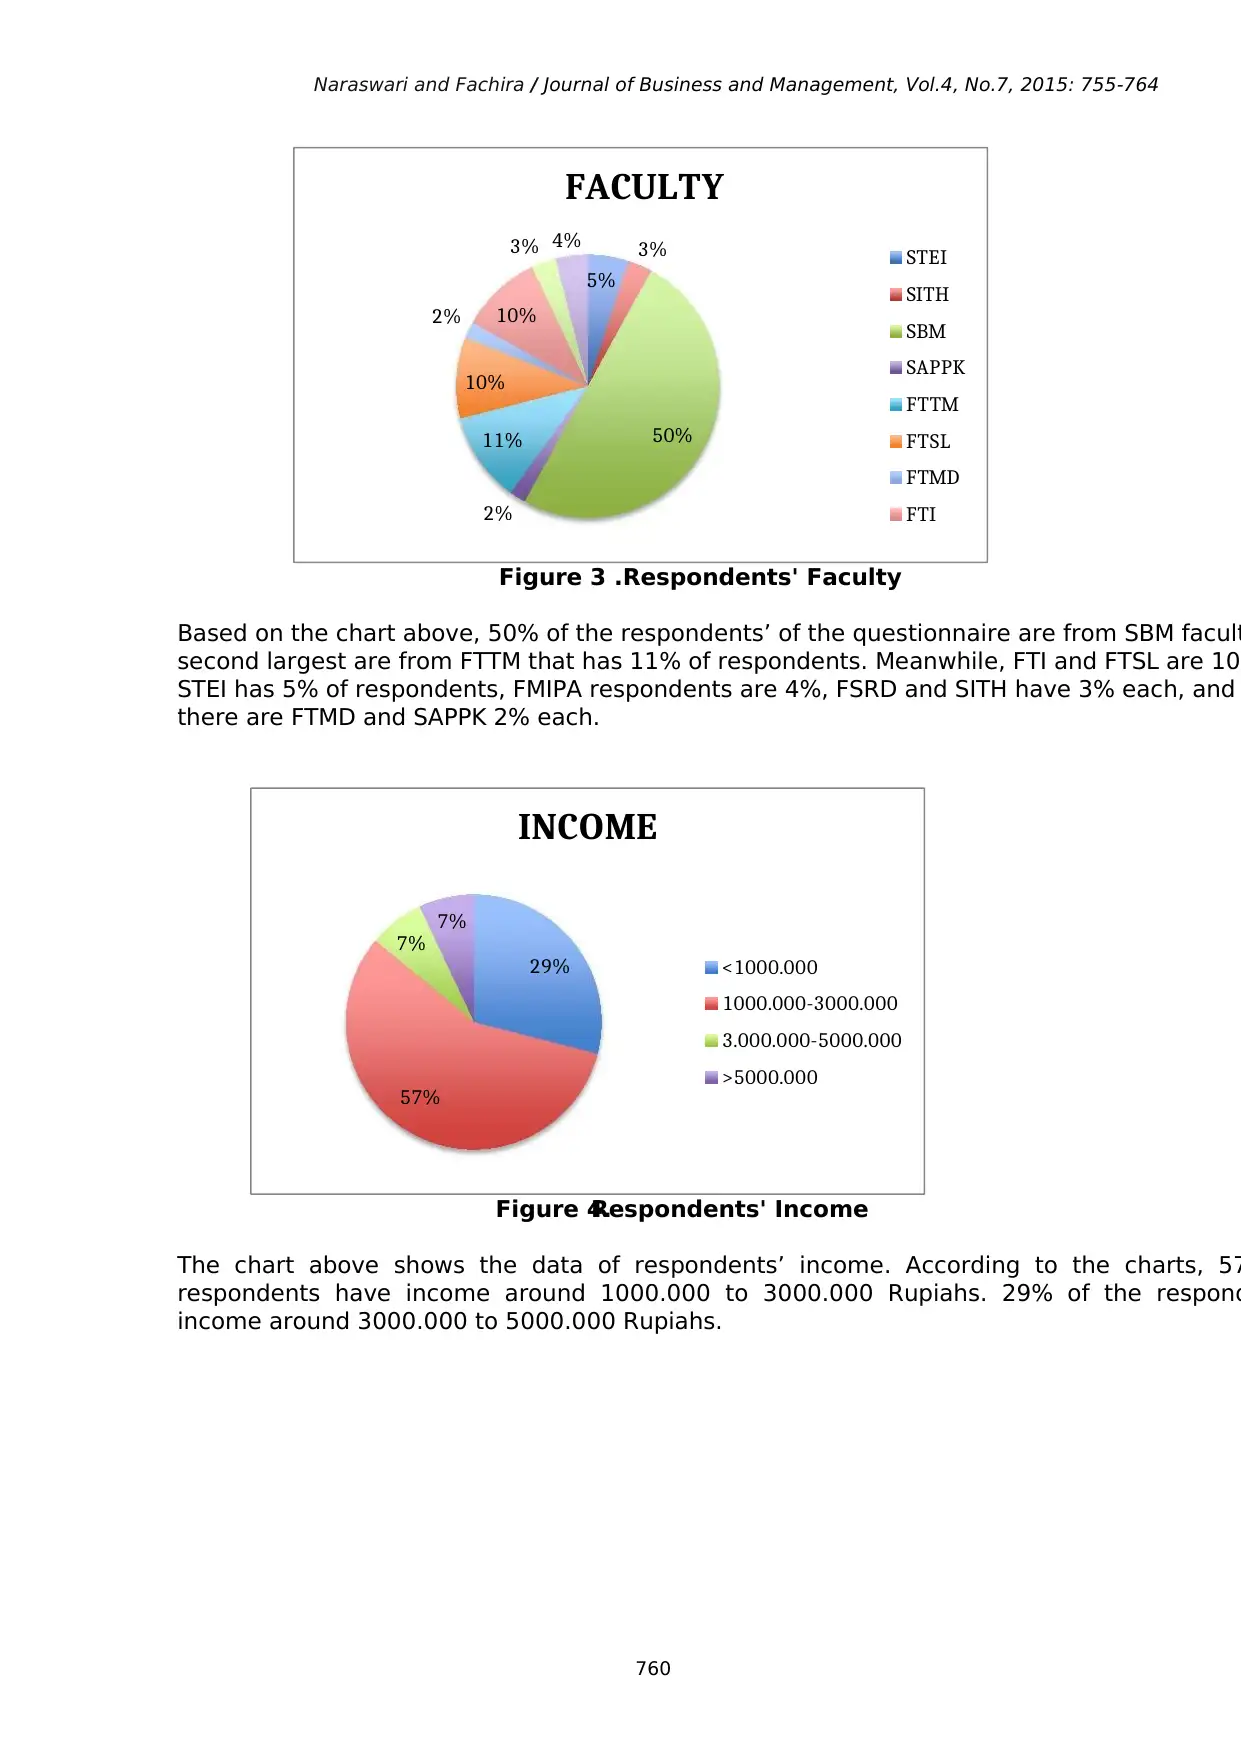
Figure 3 .Respondents' Faculty
Based on the chart above, 50% of the respondents’ of the questionnaire are from SBM facult
second largest are from FTTM that has 11% of respondents. Meanwhile, FTI and FTSL are 10
STEI has 5% of respondents, FMIPA respondents are 4%, FSRD and SITH have 3% each, and
there are FTMD and SAPPK 2% each.
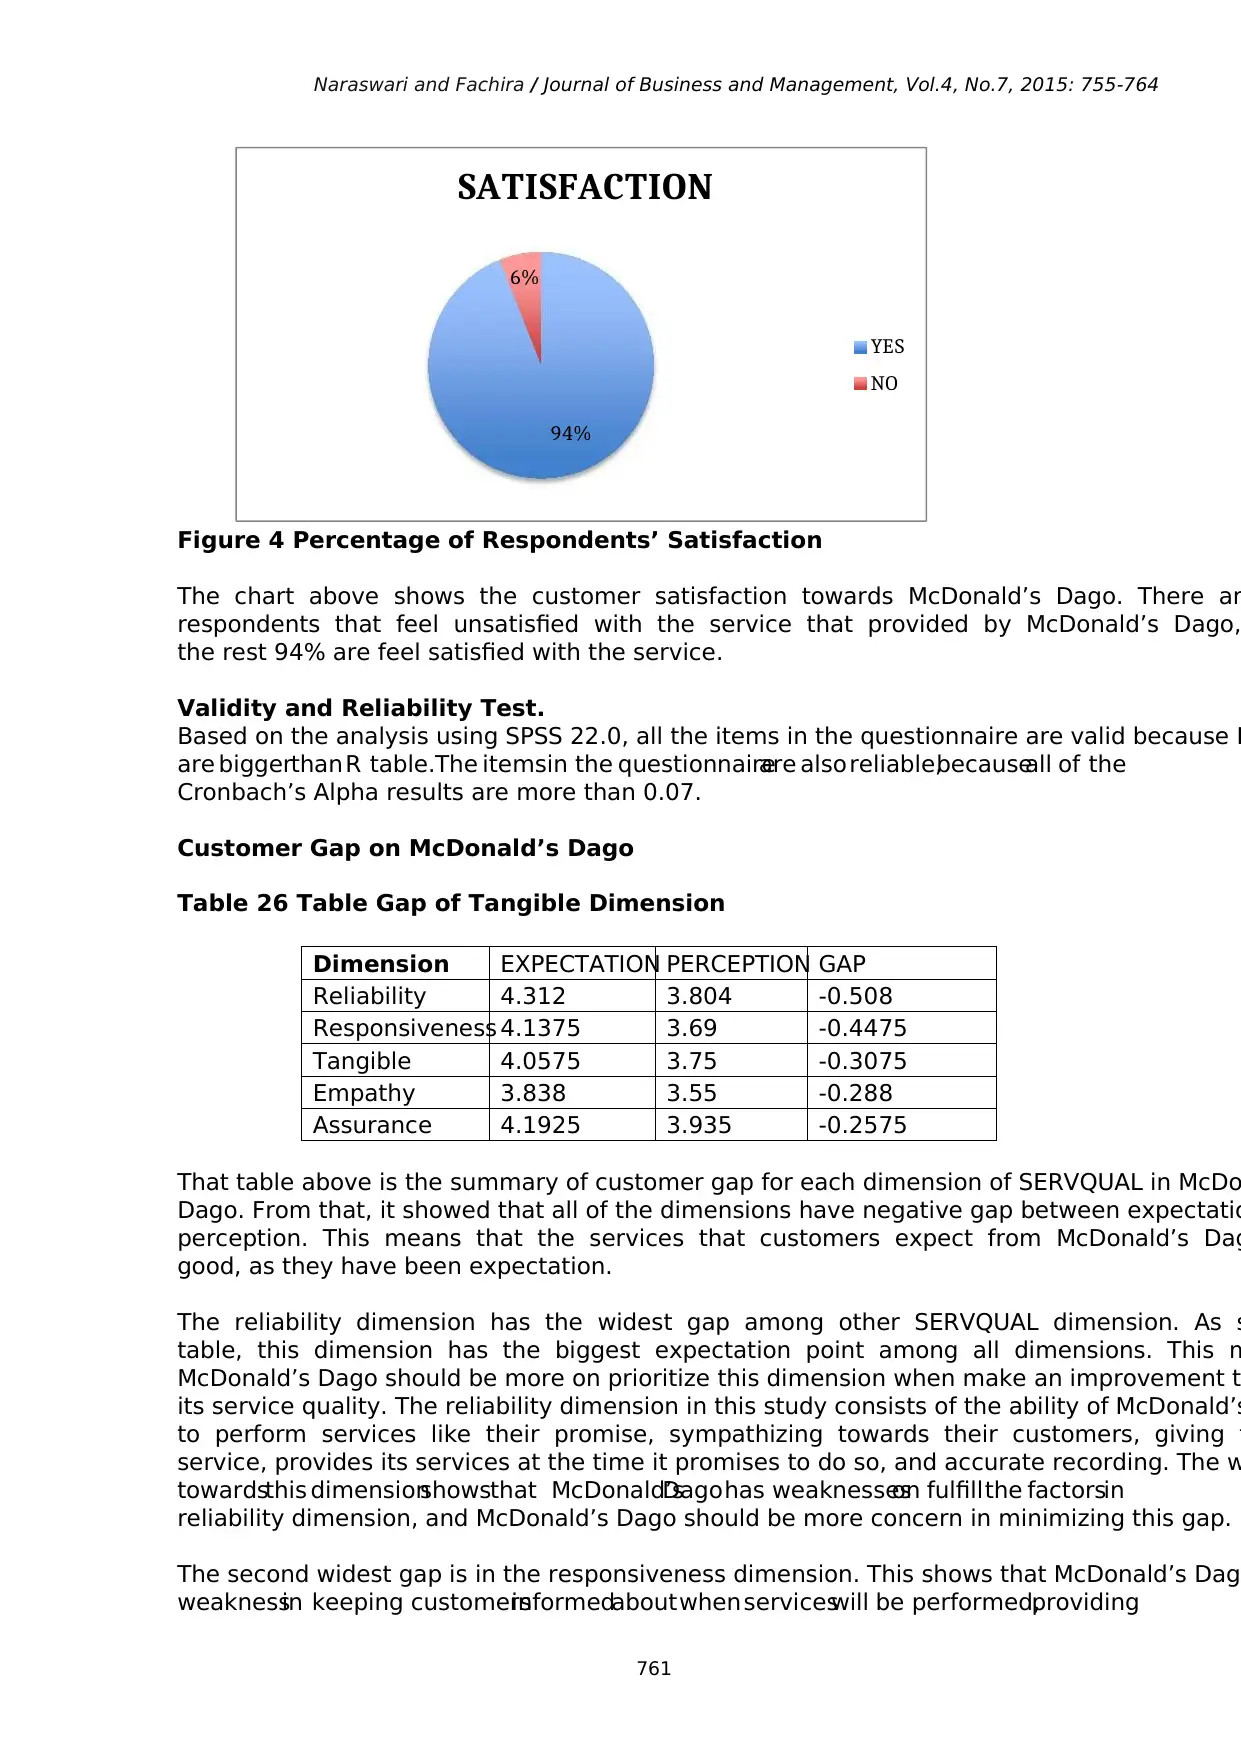
Figure 4.Respondents' Income
The chart above shows the data of respondents’ income. According to the charts, 57
respondents have income around 1000.000 to 3000.000 Rupiahs. 29% of the respond
income around 3000.000 to 5000.000 Rupiahs.
5%
3%
50%
2%
11%
10%
2% 10%
3% 4%
FACULTY
STEI
SITH
SBM
SAPPK
FTTM
FTSL
FTMD
FTI
29%
57%
7%
7%
INCOME
<1000.000
1000.000-3000.000
3.000.000-5000.000
>5000.000
760
Figure 3 .Respondents' Faculty
Based on the chart above, 50% of the respondents’ of the questionnaire are from SBM facult
second largest are from FTTM that has 11% of respondents. Meanwhile, FTI and FTSL are 10
STEI has 5% of respondents, FMIPA respondents are 4%, FSRD and SITH have 3% each, and
there are FTMD and SAPPK 2% each.
Figure 4.Respondents' Income
The chart above shows the data of respondents’ income. According to the charts, 57
respondents have income around 1000.000 to 3000.000 Rupiahs. 29% of the respond
income around 3000.000 to 5000.000 Rupiahs.
5%
3%
50%
2%
11%
10%
2% 10%
3% 4%
FACULTY
STEI
SITH
SBM
SAPPK
FTTM
FTSL
FTMD
FTI
29%
57%
7%
7%
INCOME
<1000.000
1000.000-3000.000
3.000.000-5000.000
>5000.000
⊘ This is a preview!⊘
Do you want full access?
Subscribe today to unlock all pages.
Trusted by 1+ million students worldwide
Naraswari and Fachira / Journal of Business and Management, Vol.4, No.7, 2015: 755-764
761
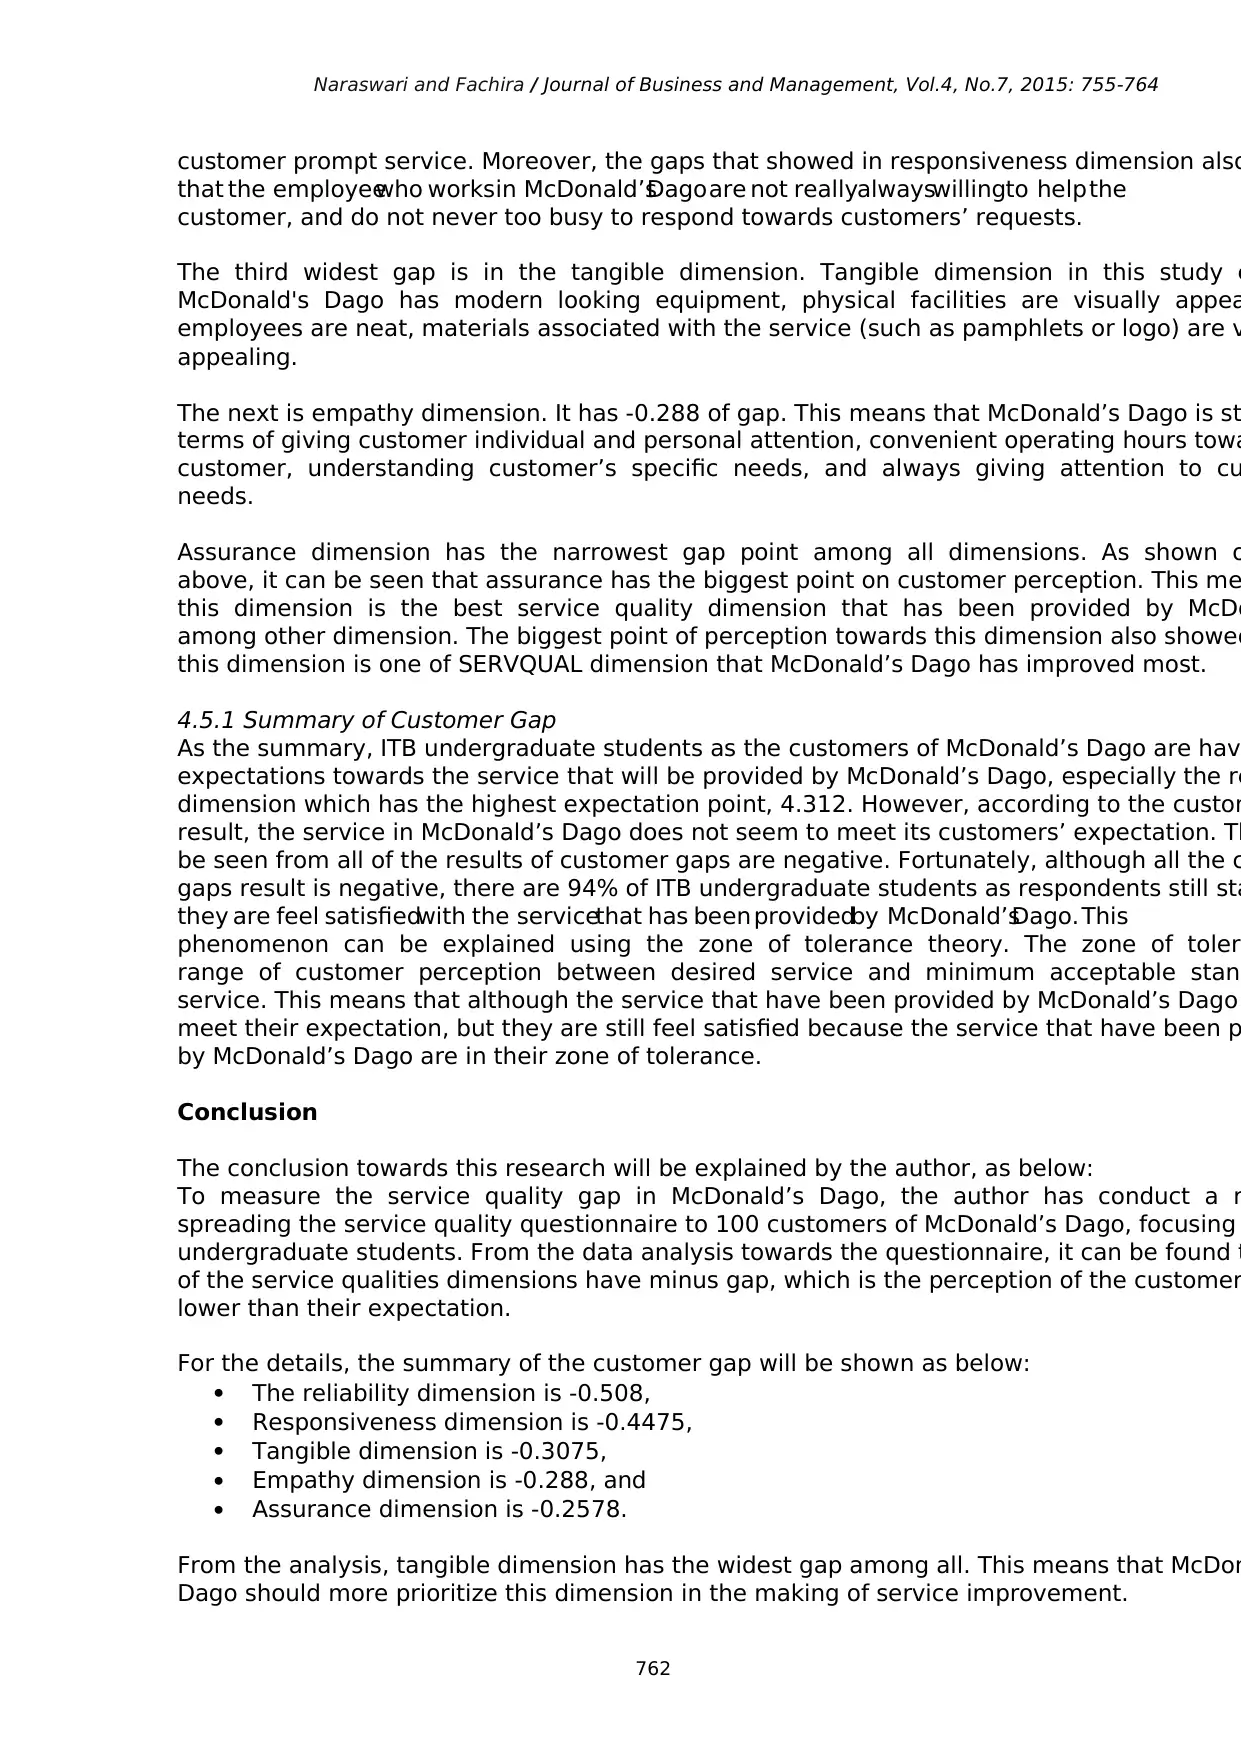
Figure 4 Percentage of Respondents’ Satisfaction
The chart above shows the customer satisfaction towards McDonald’s Dago. There ar
respondents that feel unsatisfied with the service that provided by McDonald’s Dago,
the rest 94% are feel satisfied with the service.
Validity and Reliability Test.
Based on the analysis using SPSS 22.0, all the items in the questionnaire are valid because R
are biggerthan R table.The itemsin the questionnaireare also reliable,becauseall of the
Cronbach’s Alpha results are more than 0.07.
Customer Gap on McDonald’s Dago
Table 26 Table Gap of Tangible Dimension
Dimension EXPECTATION PERCEPTION GAP
Reliability 4.312 3.804 -0.508
Responsiveness 4.1375 3.69 -0.4475
Tangible 4.0575 3.75 -0.3075
Empathy 3.838 3.55 -0.288
Assurance 4.1925 3.935 -0.2575
That table above is the summary of customer gap for each dimension of SERVQUAL in McDo
Dago. From that, it showed that all of the dimensions have negative gap between expectatio
perception. This means that the services that customers expect from McDonald’s Dag
good, as they have been expectation.
The reliability dimension has the widest gap among other SERVQUAL dimension. As s
table, this dimension has the biggest expectation point among all dimensions. This m
McDonald’s Dago should be more on prioritize this dimension when make an improvement t
its service quality. The reliability dimension in this study consists of the ability of McDonald’s
to perform services like their promise, sympathizing towards their customers, giving t
service, provides its services at the time it promises to do so, and accurate recording. The w
towardsthis dimensionshowsthat McDonald’sDago has weaknesseson fulfill the factorsin
reliability dimension, and McDonald’s Dago should be more concern in minimizing this gap.
The second widest gap is in the responsiveness dimension. This shows that McDonald’s Dag
weaknessin keeping customersinformedabout when serviceswill be performed,providing
94%
6%
SATISFACTION
YES
NO
761
Figure 4 Percentage of Respondents’ Satisfaction
The chart above shows the customer satisfaction towards McDonald’s Dago. There ar
respondents that feel unsatisfied with the service that provided by McDonald’s Dago,
the rest 94% are feel satisfied with the service.
Validity and Reliability Test.
Based on the analysis using SPSS 22.0, all the items in the questionnaire are valid because R
are biggerthan R table.The itemsin the questionnaireare also reliable,becauseall of the
Cronbach’s Alpha results are more than 0.07.
Customer Gap on McDonald’s Dago
Table 26 Table Gap of Tangible Dimension
Dimension EXPECTATION PERCEPTION GAP
Reliability 4.312 3.804 -0.508
Responsiveness 4.1375 3.69 -0.4475
Tangible 4.0575 3.75 -0.3075
Empathy 3.838 3.55 -0.288
Assurance 4.1925 3.935 -0.2575
That table above is the summary of customer gap for each dimension of SERVQUAL in McDo
Dago. From that, it showed that all of the dimensions have negative gap between expectatio
perception. This means that the services that customers expect from McDonald’s Dag
good, as they have been expectation.
The reliability dimension has the widest gap among other SERVQUAL dimension. As s
table, this dimension has the biggest expectation point among all dimensions. This m
McDonald’s Dago should be more on prioritize this dimension when make an improvement t
its service quality. The reliability dimension in this study consists of the ability of McDonald’s
to perform services like their promise, sympathizing towards their customers, giving t
service, provides its services at the time it promises to do so, and accurate recording. The w
towardsthis dimensionshowsthat McDonald’sDago has weaknesseson fulfill the factorsin
reliability dimension, and McDonald’s Dago should be more concern in minimizing this gap.
The second widest gap is in the responsiveness dimension. This shows that McDonald’s Dag
weaknessin keeping customersinformedabout when serviceswill be performed,providing
94%
6%
SATISFACTION
YES
NO
Paraphrase This Document
Need a fresh take? Get an instant paraphrase of this document with our AI Paraphraser
Naraswari and Fachira / Journal of Business and Management, Vol.4, No.7, 2015: 755-764
762
customer prompt service. Moreover, the gaps that showed in responsiveness dimension also
that the employeewho worksin McDonald’sDago are not reallyalwayswillingto help the
customer, and do not never too busy to respond towards customers’ requests.
The third widest gap is in the tangible dimension. Tangible dimension in this study c
McDonald's Dago has modern looking equipment, physical facilities are visually appea
employees are neat, materials associated with the service (such as pamphlets or logo) are v
appealing.
The next is empathy dimension. It has -0.288 of gap. This means that McDonald’s Dago is st
terms of giving customer individual and personal attention, convenient operating hours towa
customer, understanding customer’s specific needs, and always giving attention to cu
needs.
Assurance dimension has the narrowest gap point among all dimensions. As shown o
above, it can be seen that assurance has the biggest point on customer perception. This me
this dimension is the best service quality dimension that has been provided by McDo
among other dimension. The biggest point of perception towards this dimension also showed
this dimension is one of SERVQUAL dimension that McDonald’s Dago has improved most.
4.5.1 Summary of Customer Gap
As the summary, ITB undergraduate students as the customers of McDonald’s Dago are hav
expectations towards the service that will be provided by McDonald’s Dago, especially the re
dimension which has the highest expectation point, 4.312. However, according to the custom
result, the service in McDonald’s Dago does not seem to meet its customers’ expectation. Th
be seen from all of the results of customer gaps are negative. Fortunately, although all the c
gaps result is negative, there are 94% of ITB undergraduate students as respondents still sta
they are feel satisfiedwith the servicethat has been providedby McDonald’sDago. This
phenomenon can be explained using the zone of tolerance theory. The zone of toler
range of customer perception between desired service and minimum acceptable stan
service. This means that although the service that have been provided by McDonald’s Dago
meet their expectation, but they are still feel satisfied because the service that have been p
by McDonald’s Dago are in their zone of tolerance.
Conclusion
The conclusion towards this research will be explained by the author, as below:
To measure the service quality gap in McDonald’s Dago, the author has conduct a r
spreading the service quality questionnaire to 100 customers of McDonald’s Dago, focusing
undergraduate students. From the data analysis towards the questionnaire, it can be found t
of the service qualities dimensions have minus gap, which is the perception of the customer
lower than their expectation.
For the details, the summary of the customer gap will be shown as below:
The reliability dimension is -0.508,
Responsiveness dimension is -0.4475,
Tangible dimension is -0.3075,
Empathy dimension is -0.288, and
Assurance dimension is -0.2578.
From the analysis, tangible dimension has the widest gap among all. This means that McDon
Dago should more prioritize this dimension in the making of service improvement.
Naraswari and Fachira / Journal of Business and Management, Vol.4, No.7, 2015: 755-764
763
Althoughall of the dimensionhaveminusgap, but overallthe servicethat was providedby
McDonald’s Dago is not that bad. This is can be seen from the average perception score is a
middle point, which is 3.74 out of 5.
This research also showed that 94% of the respondents state that they are satisfied with Mc
Dago services although all of the service quality dimensions have minus gap. This phenomen
be explained by using the zone of tolerance theory.The zone of tolerance itself is range of cu
perception between desired service (what the customer wished for) and minimum ac
standardsof service.This explainthe phenomenonthat althoughthe servicethat havebeen
provided by McDonald’s Dago did not meet their expectation, but they are still feel satisfied
the service that have been provided by McDonald’s Dago are in their zone of tolerance.
Recommendation
To minimize the service quality gaps that occur in McDonald’s Dago, the author will
recommendation for each dimension of service quality as below:
Tangible Dimension:
Give the restaurant a fresh or appealing decoration
Make sure the employees always appear neat
Having modern equipment
Reliability Dimension:
Make sure that the food served are the same with McDonald’s advertising picture
Always repeat the order from the customer to make sure that the employee have reco
right menu
Increase the speed in preparing the food
Make sure the employees know their job desk well
Responsiveness Dimension:
Tell the customers about what time the service will be provided by McDonald’s Dago
Increase the speed in providing service, by reduce the time in preparing the f
waiting time
Train the employee to always be willing to help the customers
Assurance Dimension:
The employees should act nicely and politely to increase trust in customer
The cashier worker should tell the customer to check on the change money to make s
cashier has give them the right amount of change money
Give the employee knowledge about the menu, and facilities in McDonald’s Dago
Empathy Dimension:
Give more attention to the customer
Try to understand more about the customer’s request
Train the employees to always be willing to help the customers
Limitation, and Further Research
Customer expectations and Customer Perceptions are subjective and are in a state of consta
and change. The other limitation is the sample size is relatively small, so it may not represen
population.
⊘ This is a preview!⊘
Do you want full access?
Subscribe today to unlock all pages.
Trusted by 1+ million students worldwide
Naraswari and Fachira / Journal of Business and Management, Vol.4, No.7, 2015: 755-764
764
The recommendations for further research are:
Try to measure service quality gap of McDonald’s dago with different demographic pro
Using another method to analyze service quality
Measure the importance of service quality
Reference
Allain, A., & Winarno, F. (n.d.). Street foods in developing countries: Lessons from Asia. Retri
August 15, 2015 from http://www.fao.org/docrep/u3550t/u3550t08.htm
Anderson, E.W., Fornell, C. and Lehmann, D.R. (1994). Customer Satisfaction, Market
Profitability: Findings From Sweden. Journal of Marketing, 58, 53– 66.
Malik, S., Jaswal, L., Malik, S., & Awan, T. (2013). MEASURING SERVICE QUALITY PERCEPTION
OF THE CUSTOMERS OF RESTAURANTS IN PAKISTAN.International Journal for Quality
Research, 7(2), 187-200.
Parasuraman, A., Zeithaml, V., & Berry, L. (1985).A Conceptual Model of Service Qua
Implications for Future Research.Journal of Marketing, 41-50.
Parasuraman, A., Berry, L., & Zeithaml, V. (1993). More on improving service quality measur
Journal of Retailing,69(1), 140-147.
Zeithaml, V, A. &Bitner, M, J. (2003). Service Marketing: Integrating Customer Focus
Firm, New York: McGraw-Hill Higher Education.
1 out of 10
Related Documents


Your All-in-One AI-Powered Toolkit for Academic Success.
+13062052269
info@desklib.com
Available 24*7 on WhatsApp / Email
![[object Object]](/_next/static/media/star-bottom.7253800d.svg)
Unlock your academic potential
Copyright © 2020–2026 A2Z Services. All Rights Reserved. Developed and managed by ZUCOL.