Comprehensive Financial Analysis: Seven Group Holdings Report
VerifiedAdded on 2023/06/04
|21
|4454
|357
Report
AI Summary
This report provides a comprehensive financial analysis of Seven Group Holdings, examining its performance across various key areas. The analysis begins with an introduction to Seven Group Holdings, detailing its business segments and operational scope within Australia and China. The core of the report focuses on a detailed financial ratio analysis, categorized into liquidity, solvency, asset utilization, profitability, and market value ratios. The liquidity ratios, including current and quick ratios, are used to assess the company's short-term solvency. Long-term solvency is evaluated through debt-to-asset, debt-to-equity, and interest coverage ratios. Asset utilization is examined through inventory turnover, asset turnover, and receivable turnover ratios. Profitability is assessed using gross margin, ROA, and ROE. Market value is evaluated through EPS and P/E ratios. The analysis also includes an examination of Seven Group Holdings' share price movements and a share valuation based on a dividend growth rate model. The report concludes with an overall evaluation of the company's financial health and provides recommendations based on the analysis.

Fundamental Analysis of Seven Group Holdings 1
FUNDAMENTAL ANALYSIS OF SEVEN GROUP HOLDINGS
Author
Course
Professor
City
Date
FUNDAMENTAL ANALYSIS OF SEVEN GROUP HOLDINGS
Author
Course
Professor
City
Date
Paraphrase This Document
Need a fresh take? Get an instant paraphrase of this document with our AI Paraphraser

Fundamental Analysis of Seven Group Holdings 2
Table of Contents
Introduction....................................................................................................................3
Performance Ratios Analysis of Seven Group Holdings...............................................3
Short-Run Solvency or the Liquidity Ratios..............................................................4
Current ratio...........................................................................................................4
Quick ratio..............................................................................................................5
Long-Term Solvency or the Financial Leverage Ratios............................................6
Debt to total assets.................................................................................................6
Debt to equity.........................................................................................................7
Interest coverage....................................................................................................8
Asset Utilization or Turnover Ratios.........................................................................8
Inventory turnover..................................................................................................9
Assets turnover.......................................................................................................9
Receivable turnover.............................................................................................10
Profitability Ratios...................................................................................................11
Gross Margin........................................................................................................11
ROA.....................................................................................................................12
ROE......................................................................................................................13
Market Value Ratios................................................................................................14
EPS.......................................................................................................................14
P/E ratio................................................................................................................14
Seven Group Share Price Movements.........................................................................15
Share Valuation............................................................................................................17
Conclusion...................................................................................................................18
Recommendation.........................................................................................................18
REFERENCES.............................................................................................................20
Fundamental Analysis of Seven Group Holdings 3
Introduction
Seven Group Holdings is usually a diversified investment and operating firm
operating in construction, mining and media industries (Reuters.com 2018). The
company was established in the year 1991 by the receivers with the aim of bundling
together assets Christopher’s failed business. Its segment comprises of Wes Trac
Australia that is currently the authorized caterpillar seller in the Australian Capital
Territory as well as in New South Wales (Investsmart.com 2018). The second
segment is Wes Trac China that is currently the only authorized caterpillar trader in
North Eastern China. Finally, there is AllightSykes that operates in sales, assembly,
manufacture as well as support of the lighting, dewatering equipment and power
generation as well as in distribution of the Perkins engines. The company operates in
two key countries; that is, China and Australia (Market Index 2018). Seven Group
Holdings has great assets, strong management team as well as engaged personnel that
enable it to capture any opportunity of improving markets where it operates. As such,
the paper present analysis of financial ratio analysis based on five categories; that is,
profitability, market value, liquidity, efficiency and financial leverage in determining
strength and weakness of the firm (Seven Group Holdings 2017). It also presents
historical share trend and value of the company’s stock based on dividend growth rate
model. These would help in the researcher in evaluating Seven Group Holdings and
provide financial advice to the client on whether or not the client should include share
of Seven Group Holding in his investment portfolio.
Performance Ratios Analysis of Seven Group Holdings
Financial ratio analysis is usually the tool developed in performing quantitative
analysis on figures reported on the financial statements (Lewellen 2004). This assists
⊘ This is a preview!⊘
Do you want full access?
Subscribe today to unlock all pages.
Trusted by 1+ million students worldwide
Fundamental Analysis of Seven Group Holdings 4
in linking the three forms of the financial statements all together and provides figures
which are comparable between firms and across sectors. Basically, ratio analysis if the
most widely utilized fundamental analysis approaches (Halkos & Salamouris 2004).
Nonetheless, ratios differ across different sectors and comparisons in between
completely different forms of organization are usually not valid (Kumbirai & Webb
2010). Ratios falls into numerous categories and for this purpose, the analysis would
use the five commonly used categories to analyse financial performance and position
of Seven Group Holdings in the past two years. These categories include profitability
ratios, asset utilizations, liquidity ratios, market value as well as financial leverage
ratios.
Short-Run Solvency or the Liquidity Ratios
Liquidity or short-term solvency ratios are the widely used financial ratios. These
ratios are very significant especially to the creditors as they measure an organization’s
capacity of meeting its immediate or short-term debts (Lewellen 2004). In this case,
quick as well as current ratio would be used in evaluating liquidity of Seven Group
Holdings over the past two years.
Current ratio
This form of financial ratio would be useful in measuring Seven Group Holdings
current assets against current liabilities (Halkos & Salamouris 2004). It would indicate
or signals whether Seven Group Holdings could settle its short-term debts obligations
by liquidating all its current assets (Kumbirai & Webb 2010). In this case, a low ratio
would signal that Seven Group Holdings might be experiencing hard times in settling
its current debts and therefore require immediate investigations; nonetheless, high
ratio means that Seven Group Holdings is having easier times in settling its short-term
Paraphrase This Document
Need a fresh take? Get an instant paraphrase of this document with our AI Paraphraser

Fundamental Analysis of Seven Group Holdings 5
debts. . In this case, Seven Group Holdings current ratio for the past two years was as
follows:
2016 = 1,783.1/907.4 = 1.97
2017 = 1,909.4/686.6= 2.78
Figure 1: trend in current ratio 2016-2017
2016 2017
0
0.5
1
1.5
2
2.5
3
1.97
2.78
Current ratio
Current ratio
Based on the above results, it is evident that Seven Group Holdings current ratio
increased over the last two years moving from 1.97 in 2016 to 2.78 in 2017. The
increase in current ratio is attributable to introduction of assets held for the sales in
2017. Besides, the increase in this ratio implies that for the last two years, Seven
Group Holdings has been having easy time in settling all its short-term debts.
Quick ratio
The ratio is a bit stringent compared to current ratio. It would help in comparing cash,
the short-term marketable stocks as well as the account receivables of Seven Group
Fundamental Analysis of Seven Group Holdings 6
Holdings to its current liabilities (Halkos & Salamouris 2004). In this case, Seven
Group Holdings quick ratio for the past two years was as follows:
2016 = 1,783,100- 831,300 /907,400 = 1.05
2017 = 1,909,400- 654,700 / 686,600 = 1.83
From the above outcome, it is evident that Seven Group Holdings quick ratio
increased over the past two years. The increase implies that the company has been
having easy time in turning its most liquid assets to settle its short-term debts.
Long-Term Solvency or the Financial Leverage Ratios
Financial leverage are the financial ratios used in measuring an organization’s
capacity of meeting most of its long-term debts (Kumbirai & Webb 2010). This offers
some insights on an organization’s capital structure and level of the financial leverage
the company is utilizing. In this case, financial leverage ratios such as debt to asset,
interest coverage and the debt/equity ratios would be useful in Seven Group Holdings
case since it would permit Seven Group Holdings’ potential investors to determine
whether SVW has enough cash flows in settling its interest expenses and other
expenses (Halkos & Salamouris 2004).
Debt to total assets
This ratio is one of the most common solvency ratios and would be used in measuring
percentage of Seven Group Holdings total assets which is mostly financed by the
debts. It is usually computed by dividing the total debts by the total assets (Halkos &
Salamouris 2004). Here, higher figure implies that the company is utilizing huge
⊘ This is a preview!⊘
Do you want full access?
Subscribe today to unlock all pages.
Trusted by 1+ million students worldwide
Fundamental Analysis of Seven Group Holdings 7
amount of the financial leverage that increases their financial risks. In this case, Seven
Group Holdings debt to assets ratio for the past two years was as follows:
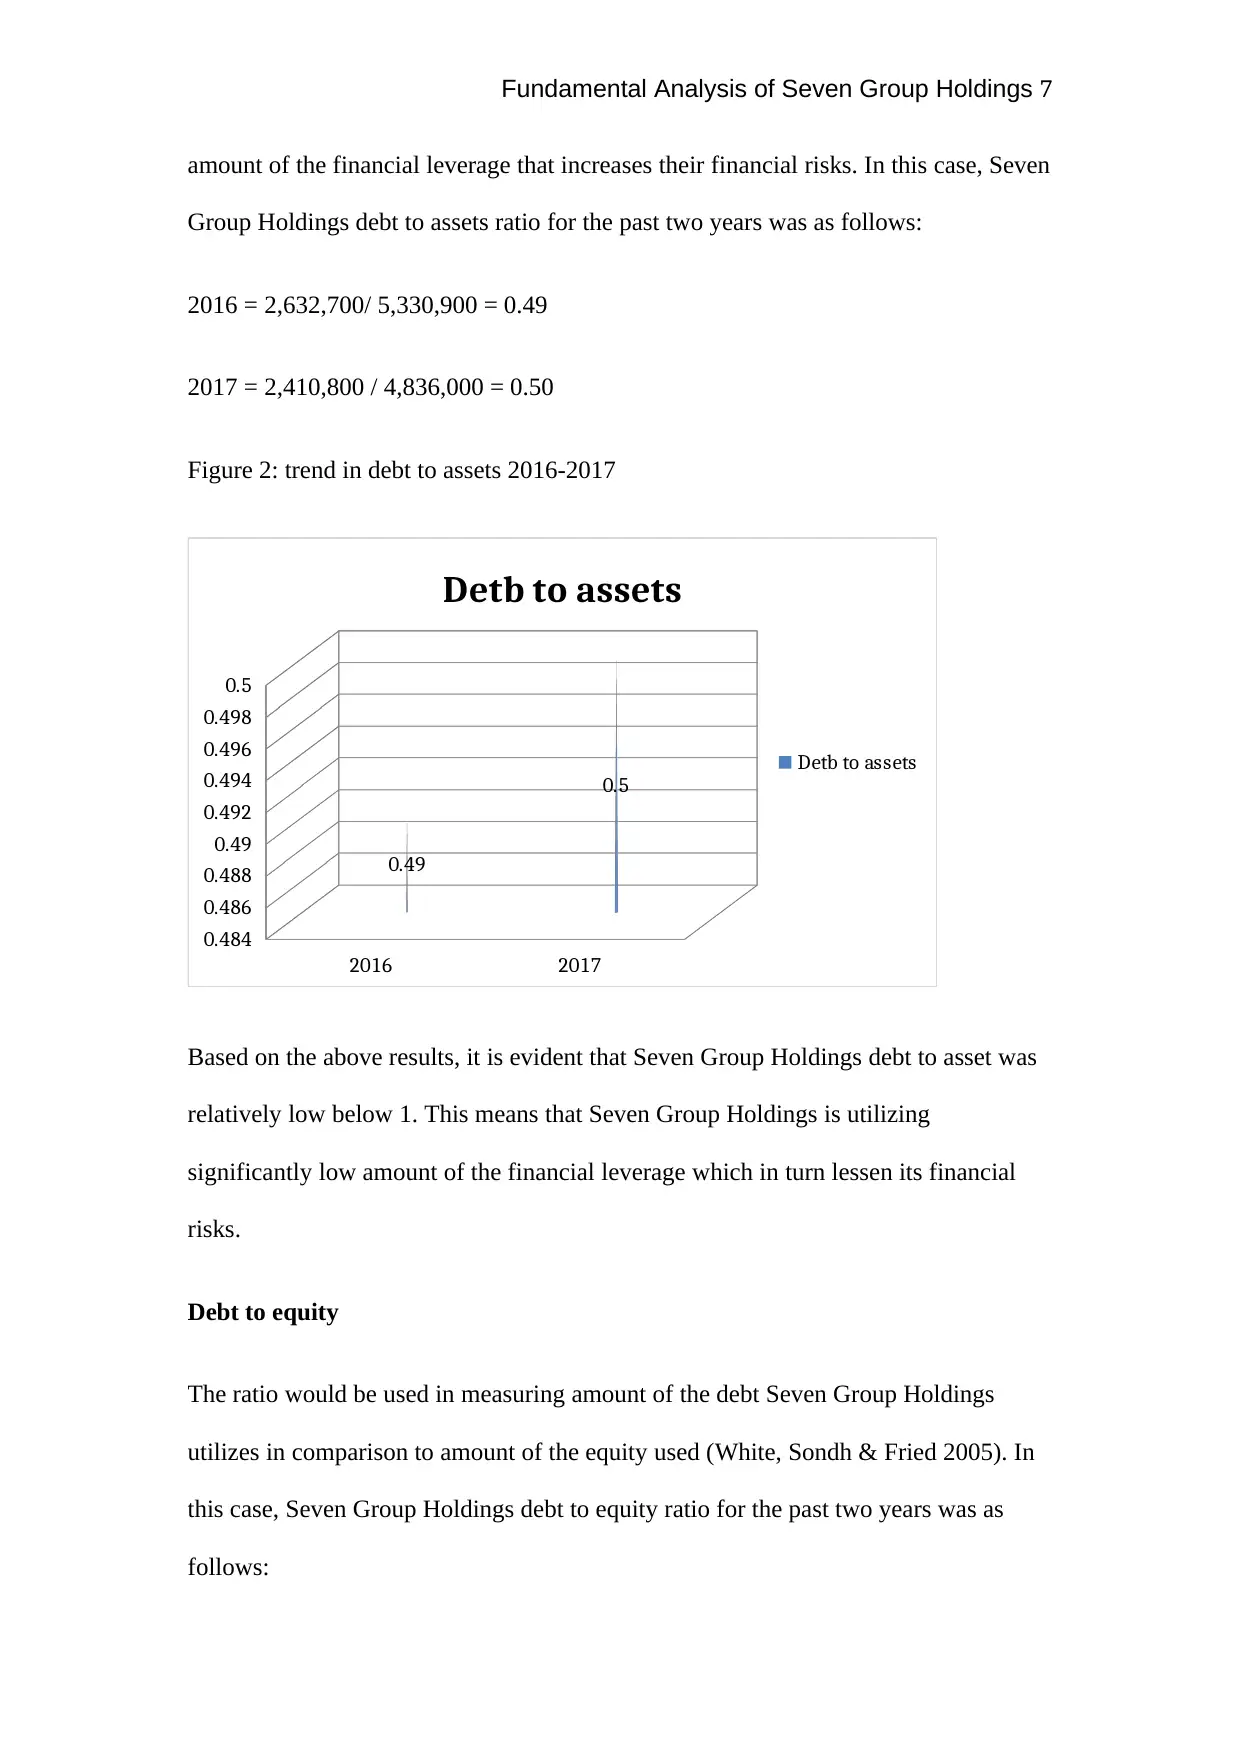
2016 = 2,632,700/ 5,330,900 = 0.49
2017 = 2,410,800 / 4,836,000 = 0.50
Figure 2: trend in debt to assets 2016-2017
2016 2017
0.484
0.486
0.488
0.49
0.492
0.494
0.496
0.498
0.5
0.49
0.5
Detb to assets
Detb to assets
Based on the above results, it is evident that Seven Group Holdings debt to asset was
relatively low below 1. This means that Seven Group Holdings is utilizing
significantly low amount of the financial leverage which in turn lessen its financial
risks.
Debt to equity
The ratio would be used in measuring amount of the debt Seven Group Holdings
utilizes in comparison to amount of the equity used (White, Sondh & Fried 2005). In
this case, Seven Group Holdings debt to equity ratio for the past two years was as
follows:
amount of the financial leverage that increases their financial risks. In this case, Seven
Group Holdings debt to assets ratio for the past two years was as follows:
2016 = 2,632,700/ 5,330,900 = 0.49
2017 = 2,410,800 / 4,836,000 = 0.50
Figure 2: trend in debt to assets 2016-2017
2016 2017
0.484
0.486
0.488
0.49
0.492
0.494
0.496
0.498
0.5
0.49
0.5
Detb to assets
Detb to assets
Based on the above results, it is evident that Seven Group Holdings debt to asset was
relatively low below 1. This means that Seven Group Holdings is utilizing
significantly low amount of the financial leverage which in turn lessen its financial
risks.
Debt to equity
The ratio would be used in measuring amount of the debt Seven Group Holdings
utilizes in comparison to amount of the equity used (White, Sondh & Fried 2005). In
this case, Seven Group Holdings debt to equity ratio for the past two years was as
follows:
Paraphrase This Document
Need a fresh take? Get an instant paraphrase of this document with our AI Paraphraser

Fundamental Analysis of Seven Group Holdings 8
2016 = 2,632,700/ 2,698,200 = 0.98
2017 = 2,410,800 / 2,425,200 = 0.99
As from the above computations, it is evident that Seven Group Holdings debt/equity
ratio decreased in the last two years. Besides, the ratio for the last two years was
below one meaning that Seven Group Holdings was relying on equity financing rather
than the debt financing.
Interest coverage
This ratio would help in measuring Seven Group Holdings cash flow generated in
comparison to the interest paid. It is computed by dividing the EBIT by the interest
expenses (White, Sondh & Fried 2005). In this case, Seven Group Holdings interest
coverage for the past two years was as follows:
2016 = 284,400/ 82,400 = 3.45
2017 = 124,600/ 77,300 = 1.61
Based on the aforementioned calculations, it is evident that Seven Group Holdings
interest coverage for the past two years decreased from 3.45 in 2016 to 1.61 in 2017.
The ratio was also relatively high meaning that the company was not experiencing
hard times in settling its interest expenses over the period.
Asset Utilization or Turnover Ratios
Asset utilization or efficiency ratios are mostly used in measuring how efficiently an
organization employs its assets (Kumbirai & Webb 2010). This offers potential
investors with a rough idea of overall operational performance of the company. In

Fundamental Analysis of Seven Group Holdings 9
essences, asset utilization or efficiency ratios would be useful in this case since they
will help in measuring rate at which Seven Group Holdings is turning its assets into
sales (White, Sondh & Fried 2005). In this case, inventory turnover, asset turnover
and receivable turnover would be used in measuring efficiency of Seven Group
Holdings over the past two years.
Inventory turnover
This ratio usually computed by dividing COGs by inventories would be useful in
determining how fast Seven Group Holdings turns its inventories or how faster the
company sells its inventories (Gapenski & Reiter 2008). A high turnover could means
that the firm’s inventories are too lean and the company might be unable to
correspond to the high demand (White, Sondh & Fried 2005). In this case, Seven
Group Holdings inventory turnover for the past two years was as follows:
2016 = 2,040,000 / (831,300 + 929,200)/2 = 2,040,000/ 1,760,500 = 1.16
2017 = 2,073, 100 / (654,700 + 831,300)/2 = 2,073,100 / 1,486,000 = 1.40
Based on the above computations, it is evident that Seven Group Holdings inventory
turnover increased over the period. The ratio was relatively low implying that Seven
Group Holdings inventories were less lean and that the firm was able to correspond or
to meet the relatively high demand.
Assets turnover
The ratio helps in measuring how efficiently or quickly Seven Group Holdings turns
its assets into revenue or sales (Gapenski & Reiter 2008). It is usually computed by
dividing sales by the average total assets. Where lesser asset turnover is said to imply
⊘ This is a preview!⊘
Do you want full access?
Subscribe today to unlock all pages.
Trusted by 1+ million students worldwide

Fundamental Analysis of Seven Group Holdings 10
that the company is inefficient in utilizing its assets. In this case, Seven Group
Holdings assets turnover for the past two years was as follows:
2016 = 2,418,700 / (5,330,900 + 5,372,900)/2 = 2,418,700/5,351,900 =0.45
2017 = 2,286,400 / (4,836,000 + 5,330,900)/2 = 2,286,400/ 5,083,450 = 0.45
The results above show that Seven Group Holdings asset turnover was relatively
constant over the past two years. In essence, given that the ratio was relatively low in
the past two years, this implies that Seven Group Holdings was inefficient in utilizing
its total assets to generate revenue.
Receivable turnover
The ratio which is usually computed by dividing sales by the average receivables
would be used in measuring how efficiently and quickly Seven Group Holdings
collects most of its outstanding bills from debtors (Gapenski & Reiter 2008). In
essence, it would be used in measuring how many times Seven Group Holdings
collects money owed to them or turns into cash the account receivables (Kumbirai &
Webb 2010). In this case, Seven Group Holdings receivable turnover for the past two
years was as follows:
2016 = 2,418,700 / (551,300 + 482,100)/2 = 2,418,700/516,700 = 4.68 times
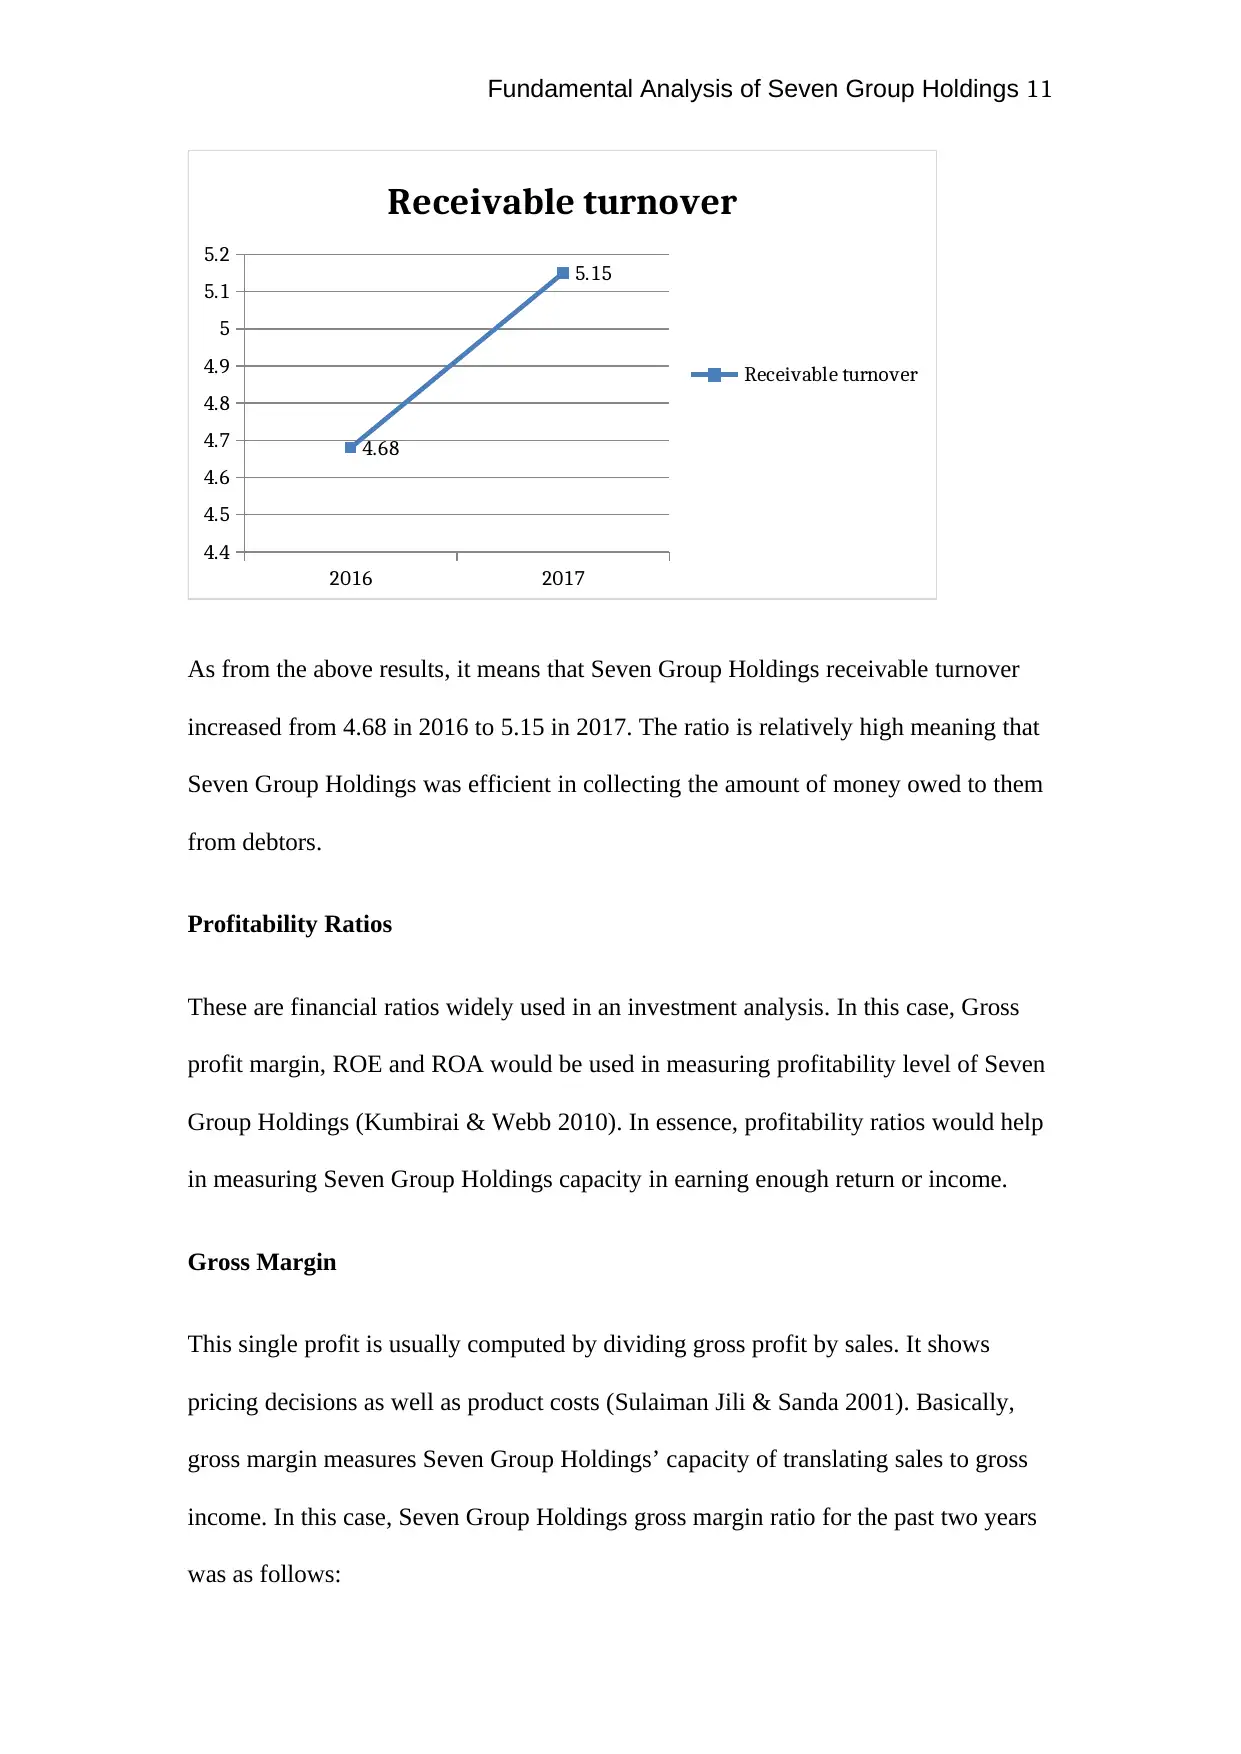
2017 = 2,286,400 / (336,500 + 551,300)/2 =2,286,400 /443,900 = 5.15 times
Figure 3: trend in receivable turnover 2016-2017
that the company is inefficient in utilizing its assets. In this case, Seven Group
Holdings assets turnover for the past two years was as follows:
2016 = 2,418,700 / (5,330,900 + 5,372,900)/2 = 2,418,700/5,351,900 =0.45
2017 = 2,286,400 / (4,836,000 + 5,330,900)/2 = 2,286,400/ 5,083,450 = 0.45
The results above show that Seven Group Holdings asset turnover was relatively
constant over the past two years. In essence, given that the ratio was relatively low in
the past two years, this implies that Seven Group Holdings was inefficient in utilizing
its total assets to generate revenue.
Receivable turnover
The ratio which is usually computed by dividing sales by the average receivables
would be used in measuring how efficiently and quickly Seven Group Holdings
collects most of its outstanding bills from debtors (Gapenski & Reiter 2008). In
essence, it would be used in measuring how many times Seven Group Holdings
collects money owed to them or turns into cash the account receivables (Kumbirai &
Webb 2010). In this case, Seven Group Holdings receivable turnover for the past two
years was as follows:
2016 = 2,418,700 / (551,300 + 482,100)/2 = 2,418,700/516,700 = 4.68 times
2017 = 2,286,400 / (336,500 + 551,300)/2 =2,286,400 /443,900 = 5.15 times
Figure 3: trend in receivable turnover 2016-2017
Paraphrase This Document
Need a fresh take? Get an instant paraphrase of this document with our AI Paraphraser
Fundamental Analysis of Seven Group Holdings 11
2016 2017
4.4
4.5
4.6
4.7
4.8
4.9
5
5.1
5.2
4.68
5.15
Receivable turnover
Receivable turnover
As from the above results, it means that Seven Group Holdings receivable turnover
increased from 4.68 in 2016 to 5.15 in 2017. The ratio is relatively high meaning that
Seven Group Holdings was efficient in collecting the amount of money owed to them
from debtors.
Profitability Ratios
These are financial ratios widely used in an investment analysis. In this case, Gross
profit margin, ROE and ROA would be used in measuring profitability level of Seven
Group Holdings (Kumbirai & Webb 2010). In essence, profitability ratios would help
in measuring Seven Group Holdings capacity in earning enough return or income.
Gross Margin
This single profit is usually computed by dividing gross profit by sales. It shows
pricing decisions as well as product costs (Sulaiman Jili & Sanda 2001). Basically,
gross margin measures Seven Group Holdings’ capacity of translating sales to gross
income. In this case, Seven Group Holdings gross margin ratio for the past two years
was as follows:
Fundamental Analysis of Seven Group Holdings 12
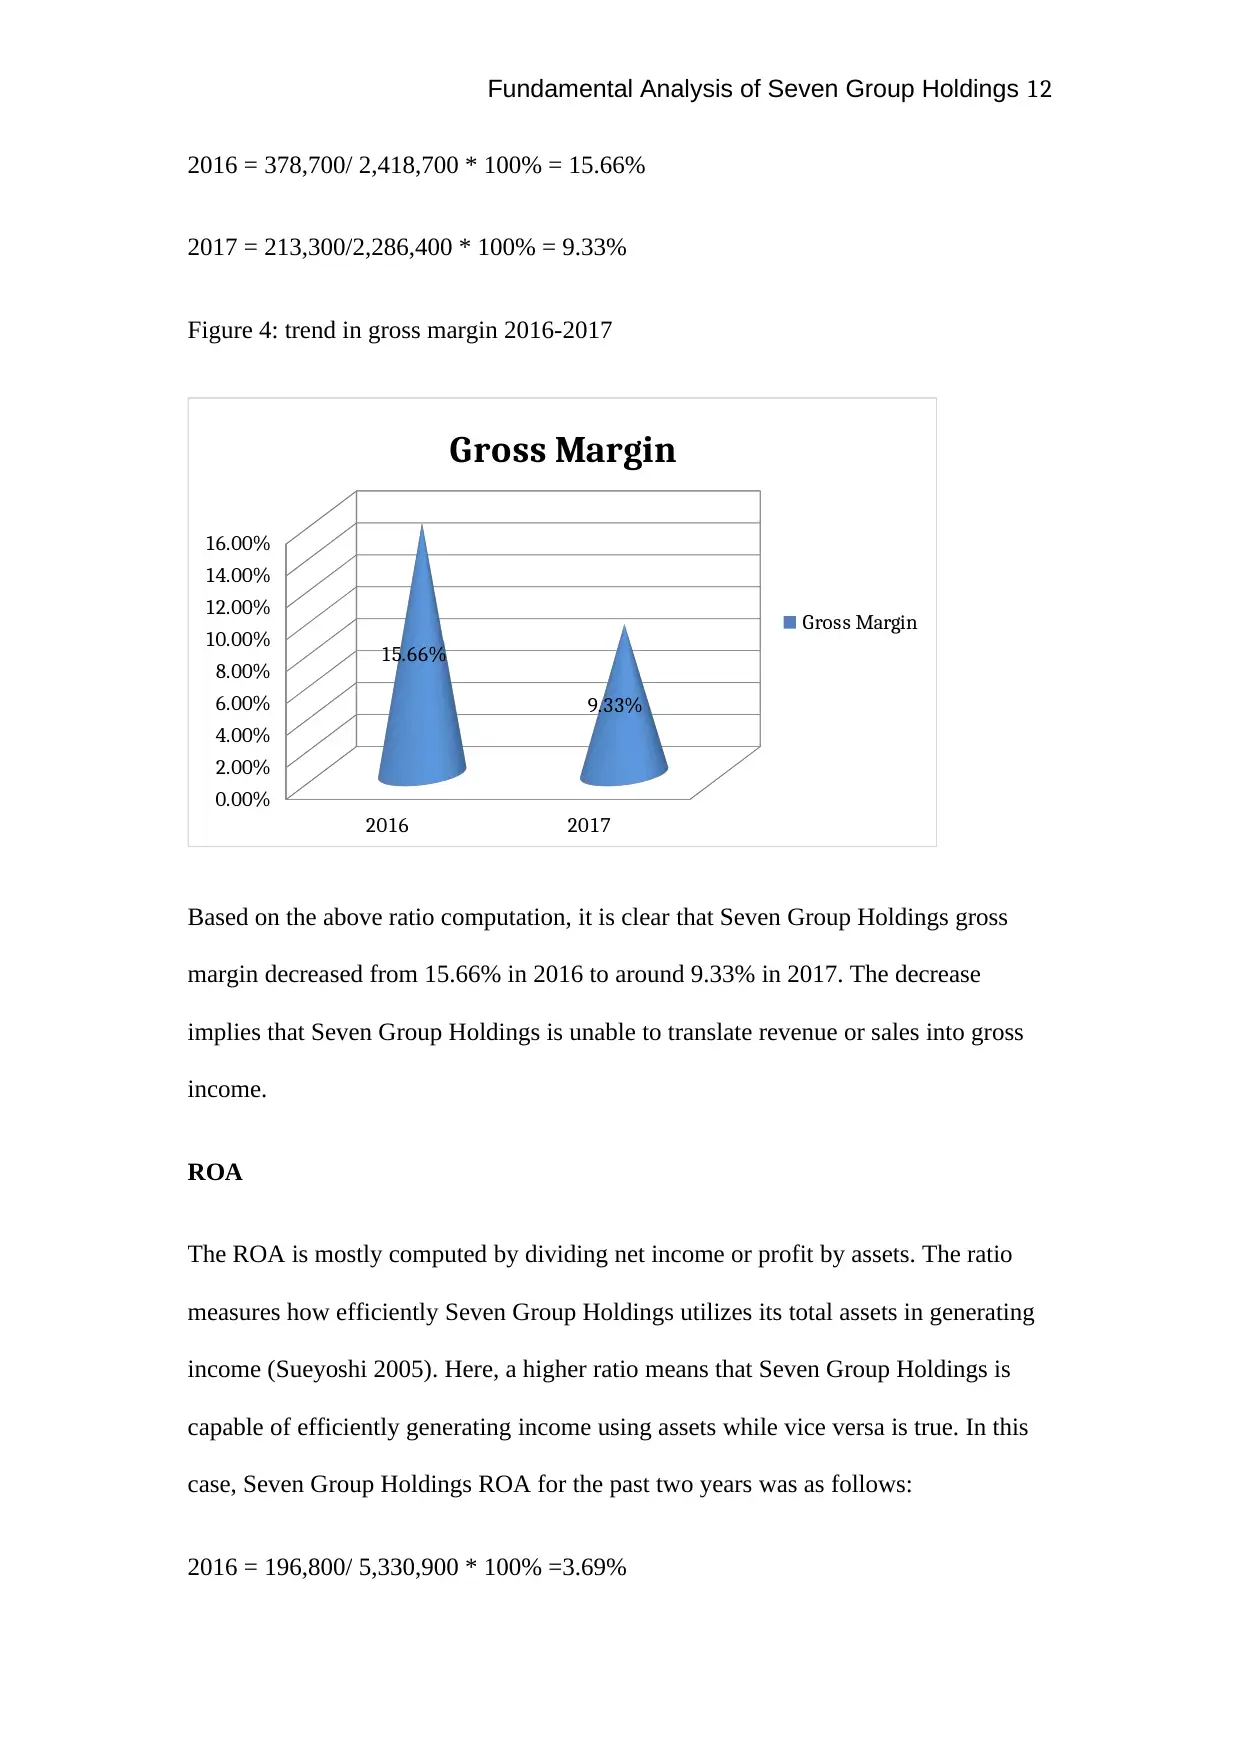
2016 = 378,700/ 2,418,700 * 100% = 15.66%
2017 = 213,300/2,286,400 * 100% = 9.33%
Figure 4: trend in gross margin 2016-2017
2016 2017
0.00%
2.00%
4.00%
6.00%
8.00%
10.00%
12.00%
14.00%
16.00%
15.66%
9.33%
Gross Margin
Gross Margin
Based on the above ratio computation, it is clear that Seven Group Holdings gross
margin decreased from 15.66% in 2016 to around 9.33% in 2017. The decrease
implies that Seven Group Holdings is unable to translate revenue or sales into gross
income.
ROA
The ROA is mostly computed by dividing net income or profit by assets. The ratio
measures how efficiently Seven Group Holdings utilizes its total assets in generating
income (Sueyoshi 2005). Here, a higher ratio means that Seven Group Holdings is
capable of efficiently generating income using assets while vice versa is true. In this
case, Seven Group Holdings ROA for the past two years was as follows:
2016 = 196,800/ 5,330,900 * 100% =3.69%
⊘ This is a preview!⊘
Do you want full access?
Subscribe today to unlock all pages.
Trusted by 1+ million students worldwide
1 out of 21
Related Documents


Your All-in-One AI-Powered Toolkit for Academic Success.
+13062052269
info@desklib.com
Available 24*7 on WhatsApp / Email
![[object Object]](/_next/static/media/star-bottom.7253800d.svg)
Unlock your academic potential
Copyright © 2020–2026 A2Z Services. All Rights Reserved. Developed and managed by ZUCOL.