Comprehensive Review: Sony Financial Holdings 2020 Report
VerifiedAdded on 2023/06/28
|100
|52138
|366
Report
AI Summary
This is Sony Financial Holdings Inc.'s 2020 Annual Report, covering the period from April 1, 2019, to March 31, 2020. The report includes a corporate overview with the mission, vision, and values, a company profile detailing its history, and profiles of group companies. It highlights the value creation story, financial and non-financial performance, and stock information. A message from the President & CEO sets the stage for a review of operations, including segments like Sony Financial Group, Sony Life, Sony Assurance, Sony Bank, and the Nursing Care Business. The report also delves into sustainability, corporate governance, human resources, and risk management. Detailed financial statements, segment information, and other financial data are provided, along with a glossary and editorial policy. The document emphasizes Sony Financial Group's commitment to innovation, customer satisfaction, and adapting to significant social and environmental changes.
2020Annual Report
April 1, 2019March 31, 2020
April 1, 2019March 31, 2020
Paraphrase This Document
Need a fresh take? Get an instant paraphrase of this document with our AI Paraphraser
Introduction
Mission, Vision & Values 1
History 2
Value Creation Story 4
Financial and Non-financial Highlights 8
Message from the President & CEO 10
Strategy and Review
Sony Financial Group 14
Sony Life 18
Sony Assurance 20
Sony Bank 22
Nursing Care Business 24
SFG’s Value Creation
Sustainability, Value Creation and Our
Foundation for Creating Value 26
Initiatives to Strengthen Our Foundation
for Creating Value 28
Corporate Section
Corporate Profile 50
Profiles of Group Companies
(Main subsidiaries) 51
Stock Information 52
Reference Materials
Review of Operations / Organizational Chart
of Business Operations 54
Financial Highlights 55
SFH Consolidated Financial Statements56
Significant Basic Items for the Preparation
of the Consolidated Financial Statements64
Notes to the Consolidated Financial
Statements 68
Segment Information 88
Other Financial Data 90
Relationship with Parent Company, Sony
Corp. 92
Glossary 93
Financial Data Book Contents 96
● The SFG refers to the financial group that comprises SFH, Sony Life,
Sony Assurance, Sony Bank, Sony Lifecare, Sony Financial Ventures, as
well as their subsidiaries and affiliates.
● Unless otherwise indicated, figures less than the indicated unit in this
material have been truncated, while ratios and percentage changes have
been rounded off.
● “Lifeplanner,” “LiPSS” and “Karte” are registered trademarks of Sony Life,
“GOOD DRIVE” is a registered trademark of Sony Assurance. Company
names and product names that appear in this report, other than those
mentioned above, are trademarks or registered trademarks of the
respective company.
● Fiscal 1996–fiscal 2020 represent the fiscal years ended / ending March
31, 1997–2021.
Company Name Abbreviations
The following abbreviations for company names are used in this report.
Sony Financial Group…………………………… SFG
Sony Financial Holdings Inc.…………………… SFH
Sony Life Insurance Co., Ltd. …………………… Sony Life
AEGON Sony Life Insurance Co., Ltd.………… AEGON Sony Life Insurance
SA Reinsurance Ltd. ……………………………… SA Reinsurance
Sony Life With Insurance Co.,Ltd. ……………… Sony Life With Insurance
Sony Life Business Partners Co., Ltd.………… Sony Life Business Partners
Sony Assurance Inc. ……………………………… Sony Assurance
Sony Bank Inc. …………………………………… Sony Bank
Sony Payment Services Inc.……………………… Sony Payment Services
SmartLink Network Hong Kong Limited ………… SmartLink Network Hong Kong
SmartLink Network Europe B.V. ………………… SmartLink Network Europe
Sony Lifecare Inc. ………………………………… Sony Lifecare
Lifecare Design Inc. ……………………………… Lifecare Design
Proud Life Inc.…………………………………… Proud Life
Sony Financial Ventures Inc.…………………… Sony Financial Ventures
Sony Corporation ………………………………… Sony Corp.
Disclaimer
This annual report contains statements concerning the current plans, expecta-
tions, strategies and beliefs of the SFG. Any statements contained herein that
are not historical facts are forward-looking statements or pro forma informa-
tion. Forward-looking statements may include—but are not limited to—words
such as “believe,” “anticipate,” “plan,” “strategy,” “expect,” “assume,” “fore-
cast,” “predict,” “propose,” “intend” and “possibility” that describe future
operating activities, business performance, events or conditions. For-
ward-looking statements, whether spoken or written, may also be included in
other materials released to the public. These forward-looking statements and
pro forma information are based on assumptions, decisions and judgments
made by the management of SFG companies, and are based on information
that is currently available to them. As such, they are subject to various risks
and uncertainties, and actual business results may vary substantially from the
forecasts expressed or implied in forward-looking statements. Consequently,
investors are cautioned not to place undue reliance on forward-looking
statements. SFG companies are under no obligation to revise forward-looking
statements or pro forma information in light of new information, future events
or other findings. The information contained in this annual report does not
constitute or form part of any offer for sale or subscription of or solicitation or
invitation of any offer to buy or subscribe to any securities, nor shall it or any
part of it form the basis of or be relied on in connection with any contract or
commitment whatsoever in Japan or abroad.
SFH refers to “Guidance for Collaborative Value
Creation” published by the Ministry of Economy,
Trade and Industry when organizing and examin-
ing matters to be listed in this report, in order to
make this report a starting point for dialogue with
shareholders and investors.
Editorial Policy
Sony Financial Holdings Inc.Annual Report2020 1
⊘ This is a preview!⊘
Do you want full access?
Subscribe today to unlock all pages.
Trusted by 1+ million students worldwide
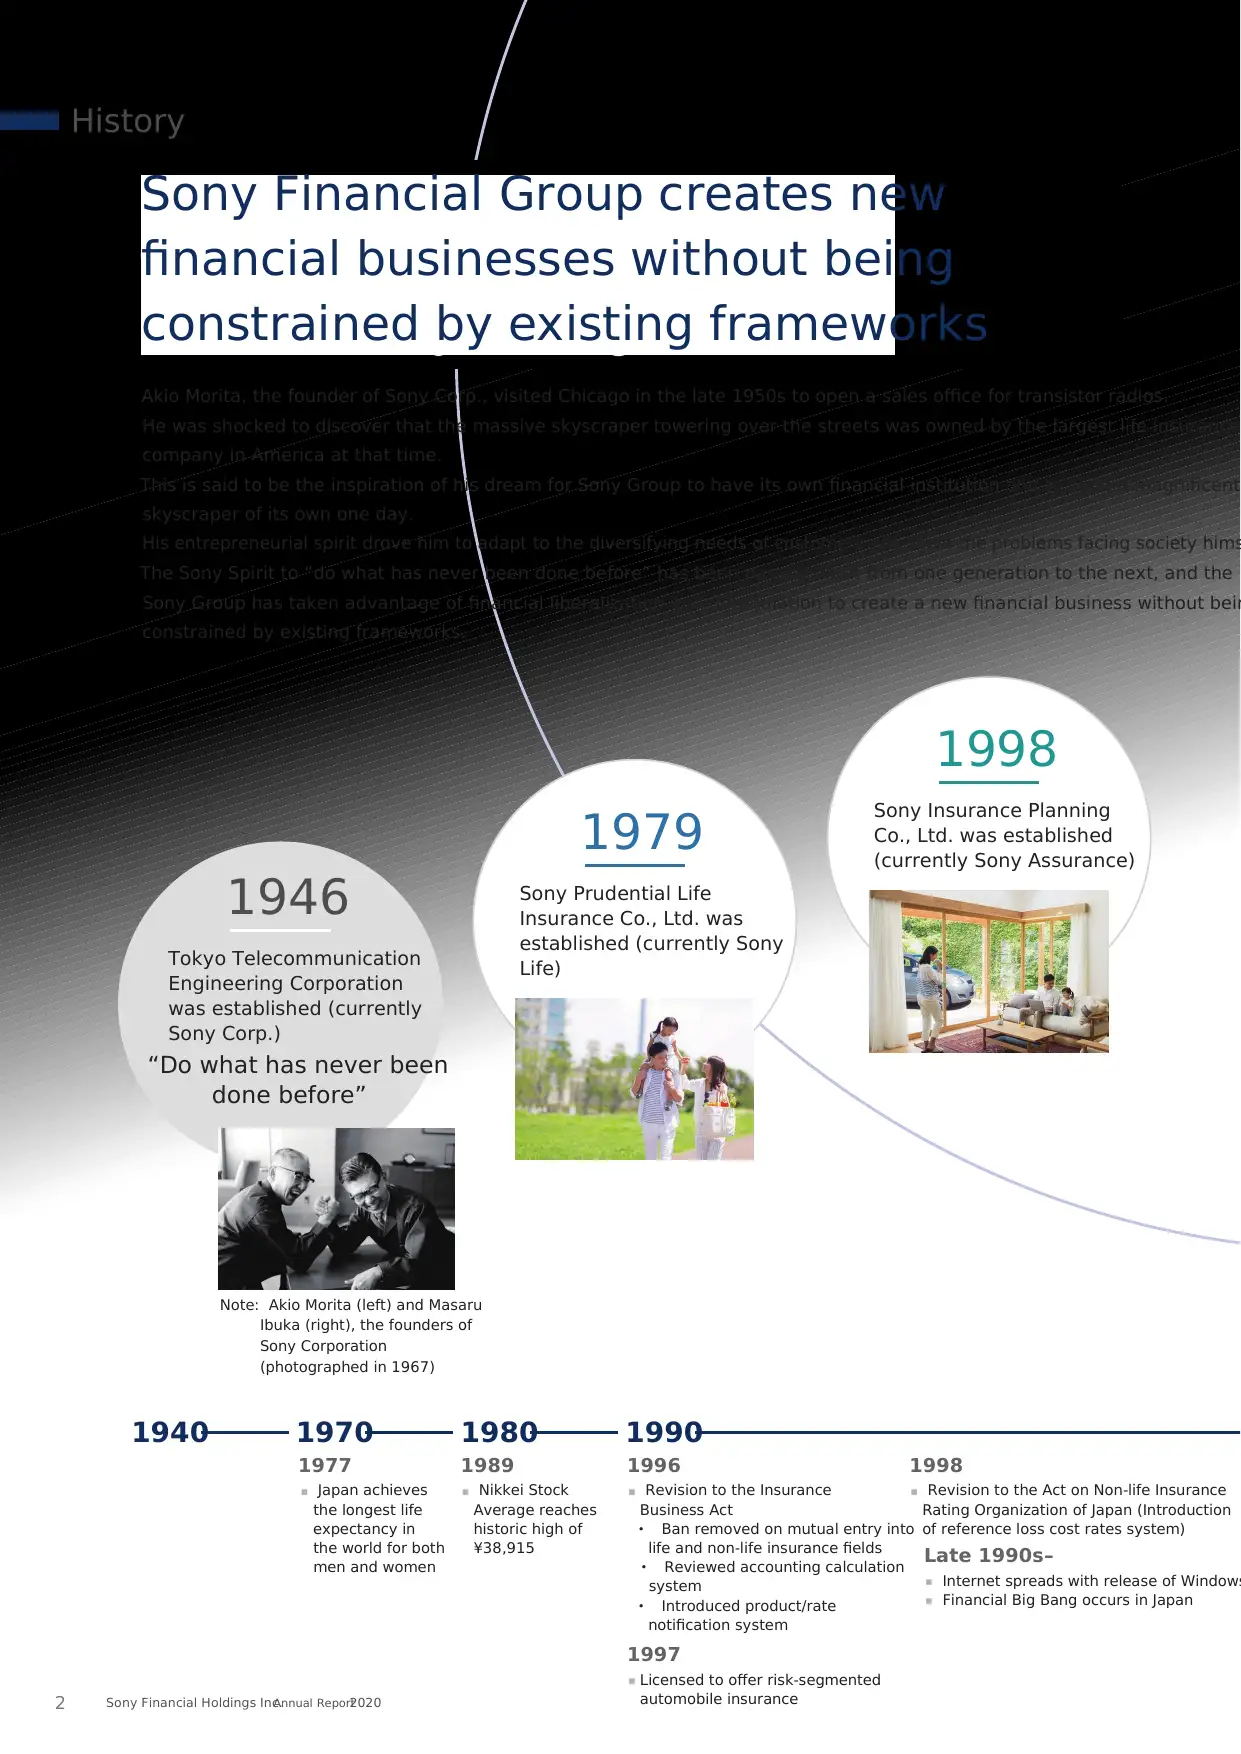
1946
Tokyo Telecommunication
Engineering Corporation
was established (currently
Sony Corp.)
1979
Sony Prudential Life
Insurance Co., Ltd. was
established (currently Sony
Life)
1998
Sony Insurance Planning
Co., Ltd. was established
(currently Sony Assurance)
“Do what has never been
done before”
Note: Akio Morita (left) and Masaru
Ibuka (right), the founders of
Sony Corporation
(photographed in 1967)
1989
■ Nikkei Stock
Average reaches
historic high of
¥38,915
1997
■ Licensed to offer risk-segmented
automobile insurance
Late 1990s–
■ Internet spreads with release of Windows
■ Financial Big Bang occurs in Japan
1998
■ Revision to the Act on Non-life Insurance
Rating Organization of Japan (Introduction
of reference loss cost rates system)
1977
■ Japan achieves
the longest life
expectancy in
the world for both
men and women
Akio Morita, the founder of Sony Corp., visited Chicago in the late 1950s to open a sales office for transistor radios.
He was shocked to discover that the massive skyscraper towering over the streets was owned by the largest life insurance
company in America at that time.
This is said to be the inspiration of his dream for Sony Group to have its own financial institution and to build a magnificent
skyscraper of its own one day.
His entrepreneurial spirit drove him to adapt to the diversifying needs of customers and solve the problems facing society hims
The Sony Spirit to “do what has never been done before” has been passed down from one generation to the next, and the
Sony Group has taken advantage of financial liberalization and deregulation to create a new financial business without bein
constrained by existing frameworks.
Sony Financial Group creates new
financial businesses without being
constrained by existing frameworks
1940 1970 1980
1996
■ Revision to the Insurance
Business Act
・ Ban removed on mutual entry into
life and non-life insurance fields
・ Reviewed accounting calculation
system
・ Introduced product/rate
notification system
1990
History
Sony Financial Holdings Inc.Annual Report20202
Paraphrase This Document
Need a fresh take? Get an instant paraphrase of this document with our AI Paraphraser
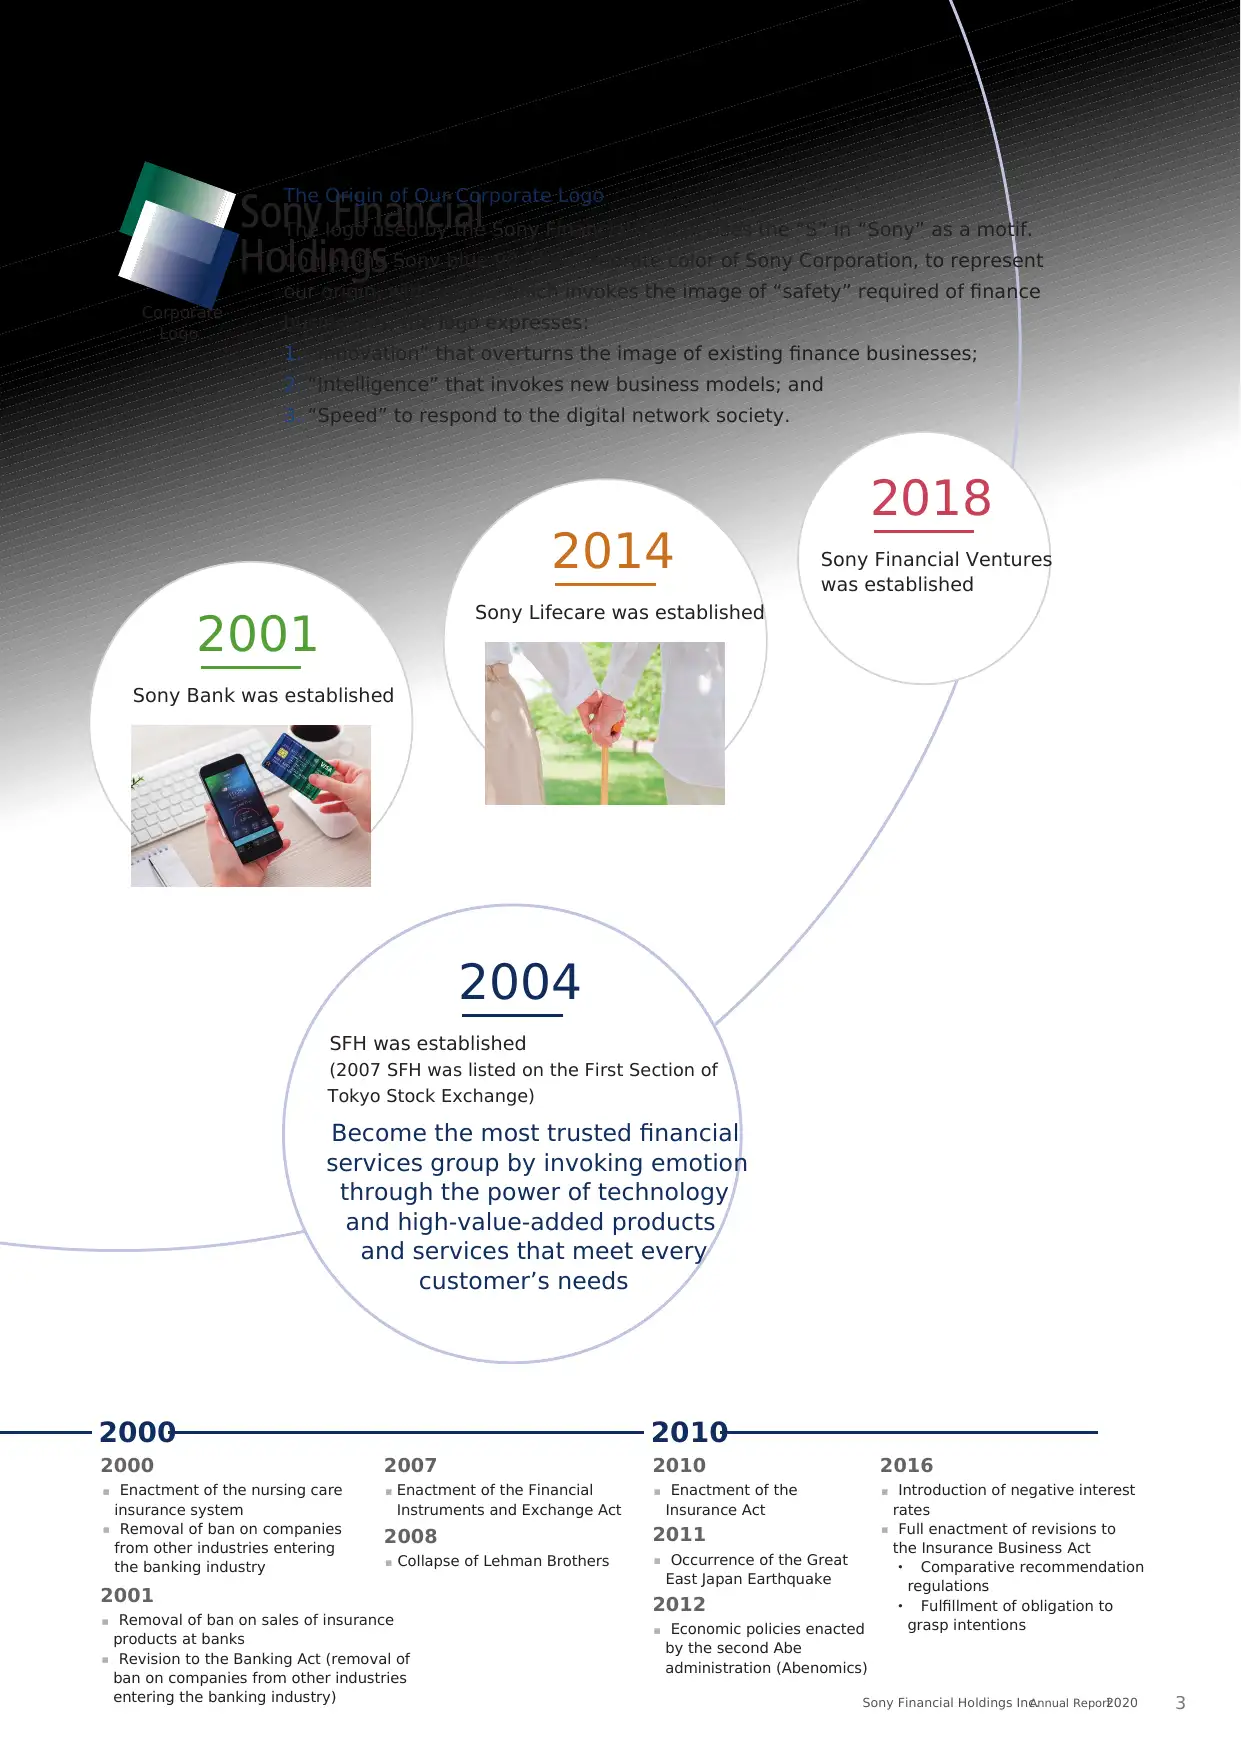
2018
Sony Financial Ventures
was established
2014
Sony Lifecare was established
2001
Sony Bank was established
Become the most trusted financial
services group by invoking emotion
through the power of technology
and high-value-added products
and services that meet every
customer’s needs
2004
SFH was established
(2007 SFH was listed on the First Section of
Tokyo Stock Exchange)
2001
■ Removal of ban on sales of insurance
products at banks
■ Revision to the Banking Act (removal of
ban on companies from other industries
entering the banking industry)
2000
■ Enactment of the nursing care
insurance system
■ Removal of ban on companies
from other industries entering
the banking industry
2007
■ Enactment of the Financial
Instruments and Exchange Act
2008
■ Collapse of Lehman Brothers
2010
■ Enactment of the
Insurance Act
2016
■ Introduction of negative interest
rates
■ Full enactment of revisions to
the Insurance Business Act
・ Comparative recommendation
regulations
・ Fulfillment of obligation to
grasp intentions
2011
■ Occurrence of the Great
East Japan Earthquake
2012
■ Economic policies enacted
by the second Abe
administration (Abenomics)
2000 2010
The logo used by the Sony Financial Group, uses the “S” in “Sony” as a motif.
Combining Sony blue 90, the corporate color of Sony Corporation, to represent
our origin, with green, which invokes the image of “safety” required of finance
businesses, the logo expresses:
1. “Innovation” that overturns the image of existing finance businesses;
2. “Intelligence” that invokes new business models; and
3. “Speed” to respond to the digital network society.
The Origin of Our Corporate Logo
Corporate
Logo
Sony Financial Holdings Inc.Annual Report2020 3
SFG’s Corporate
Philosophy SFG’s Businesses
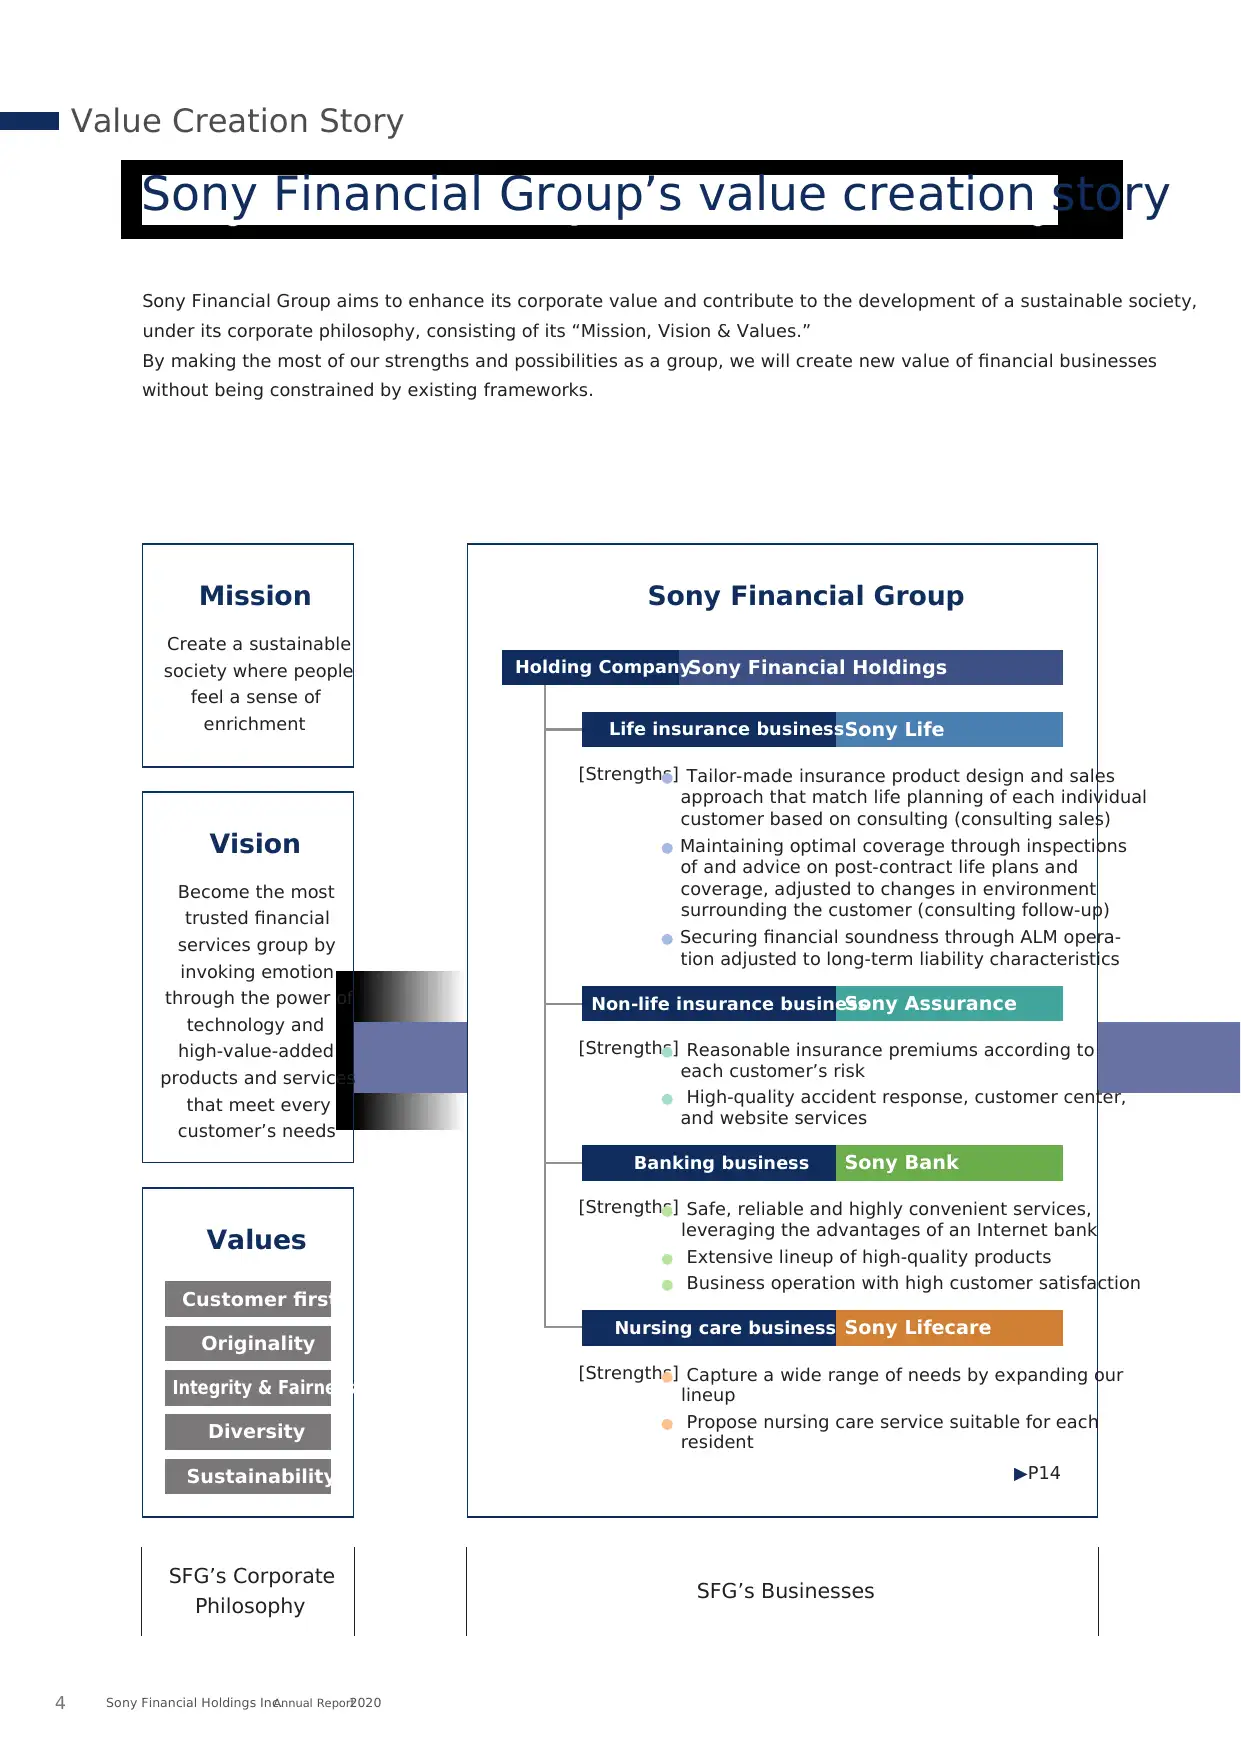
Sony Financial Group aims to enhance its corporate value and contribute to the development of a sustainable society,
under its corporate philosophy, consisting of its “Mission, Vision & Values.”
By making the most of our strengths and possibilities as a group, we will create new value of financial businesses
without being constrained by existing frameworks.
Sony Financial Group’s value creation story
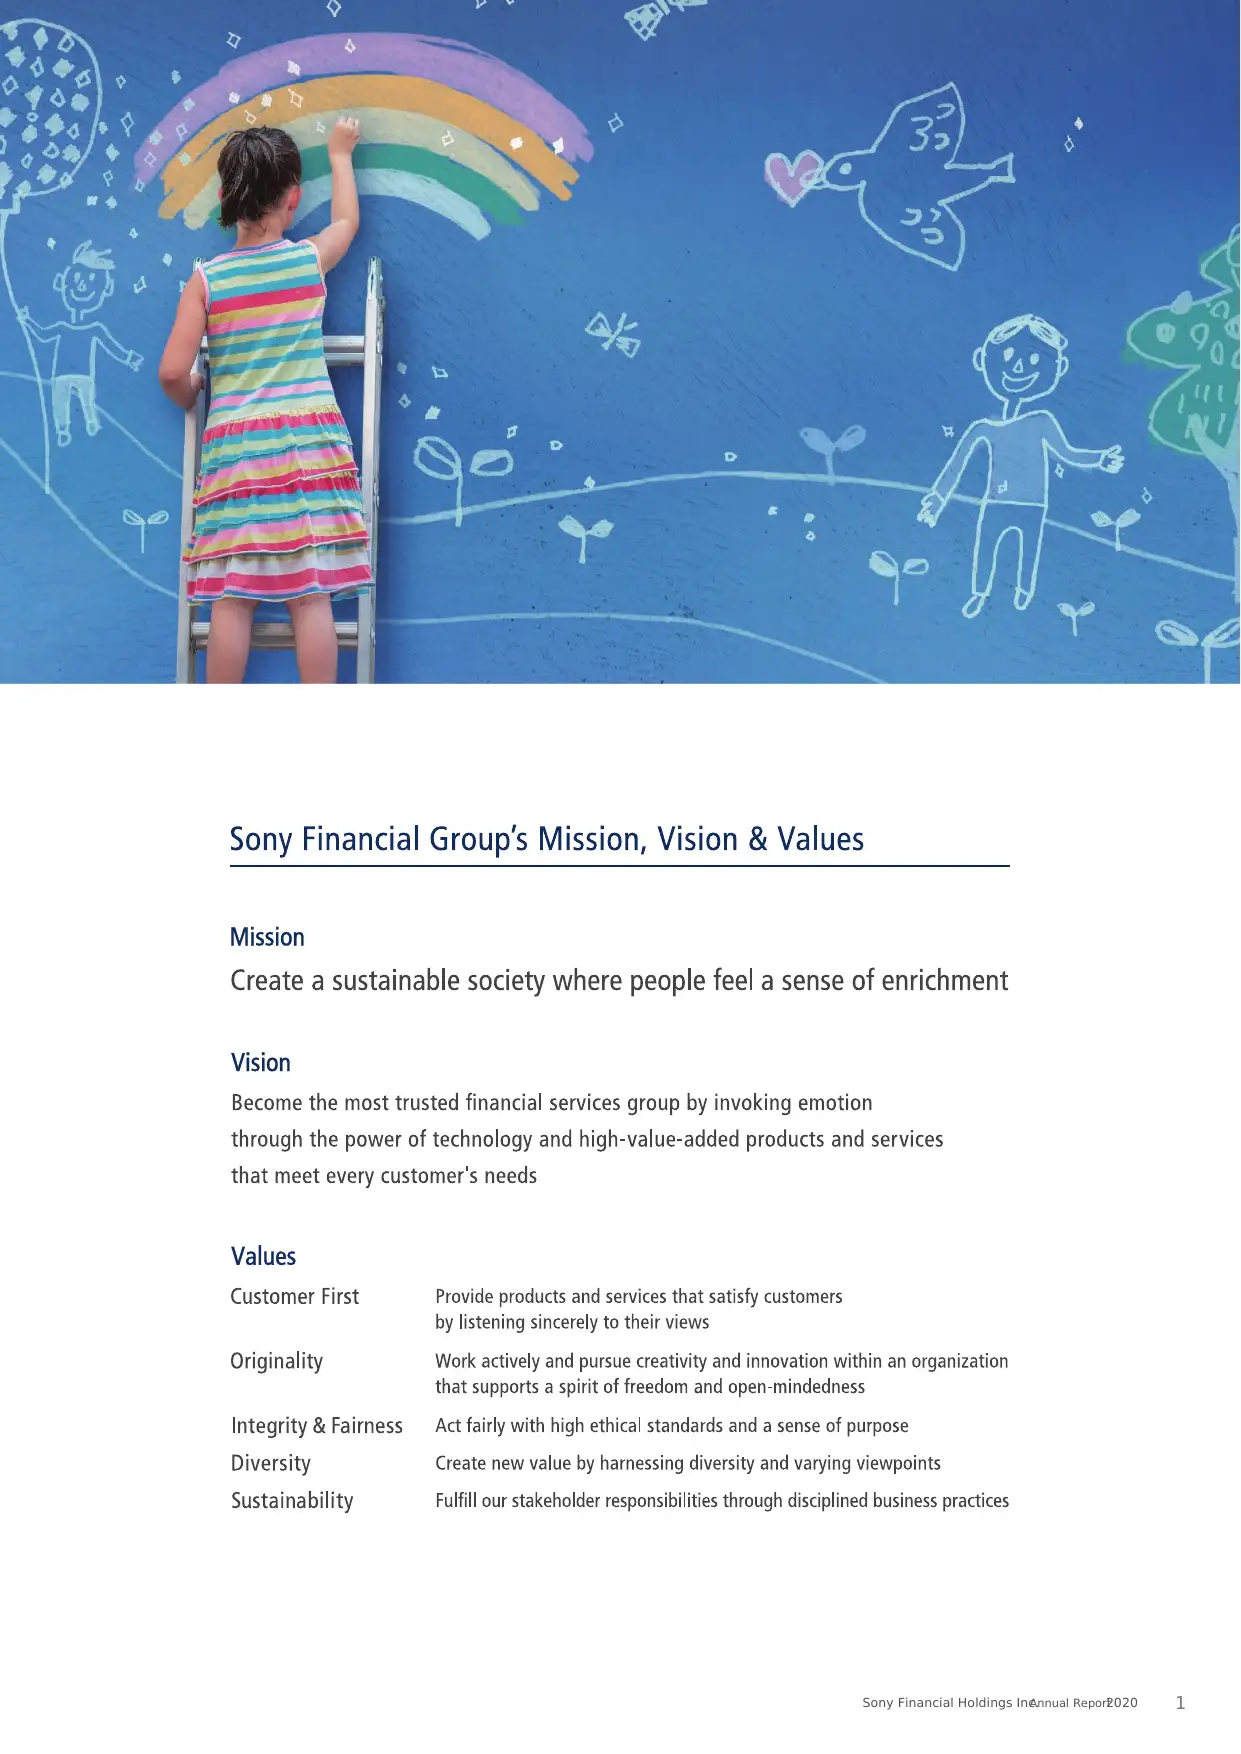
Vision
Become the most
trusted financial
services group by
invoking emotion
through the power of
technology and
high-value-added
products and services
that meet every
customer’s needs
Mission
Create a sustainable
society where people
feel a sense of
enrichment
Values
Customer first
Originality
Integrity & Fairness
Diversity
Sustainability
Sony Financial Group
Sony Financial HoldingsHolding Company
▶P14
Sony LifecareNursing care business
[Strengths]● Capture a wide range of needs by expanding our
lineup
● Propose nursing care service suitable for each
resident
Sony LifeLife insurance business
[Strengths]● Tailor-made insurance product design and sales
approach that match life planning of each individual
customer based on consulting (consulting sales)
● Maintaining optimal coverage through inspections
of and advice on post-contract life plans and
coverage, adjusted to changes in environment
surrounding the customer (consulting follow-up)
● Securing financial soundness through ALM opera-
tion adjusted to long-term liability characteristics
[Strengths]● Reasonable insurance premiums according to
each customer’s risk
● High-quality accident response, customer center,
and website services
Sony AssuranceNon-life insurance business
[Strengths]● Safe, reliable and highly convenient services,
leveraging the advantages of an Internet bank
● Extensive lineup of high-quality products
● Business operation with high customer satisfaction
Sony BankBanking business
Value Creation Story
Sony Financial Holdings Inc.Annual Report20204
Philosophy SFG’s Businesses
Sony Financial Group aims to enhance its corporate value and contribute to the development of a sustainable society,
under its corporate philosophy, consisting of its “Mission, Vision & Values.”
By making the most of our strengths and possibilities as a group, we will create new value of financial businesses
without being constrained by existing frameworks.
Sony Financial Group’s value creation story
Vision
Become the most
trusted financial
services group by
invoking emotion
through the power of
technology and
high-value-added
products and services
that meet every
customer’s needs
Mission
Create a sustainable
society where people
feel a sense of
enrichment
Values
Customer first
Originality
Integrity & Fairness
Diversity
Sustainability
Sony Financial Group
Sony Financial HoldingsHolding Company
▶P14
Sony LifecareNursing care business
[Strengths]● Capture a wide range of needs by expanding our
lineup
● Propose nursing care service suitable for each
resident
Sony LifeLife insurance business
[Strengths]● Tailor-made insurance product design and sales
approach that match life planning of each individual
customer based on consulting (consulting sales)
● Maintaining optimal coverage through inspections
of and advice on post-contract life plans and
coverage, adjusted to changes in environment
surrounding the customer (consulting follow-up)
● Securing financial soundness through ALM opera-
tion adjusted to long-term liability characteristics
[Strengths]● Reasonable insurance premiums according to
each customer’s risk
● High-quality accident response, customer center,
and website services
Sony AssuranceNon-life insurance business
[Strengths]● Safe, reliable and highly convenient services,
leveraging the advantages of an Internet bank
● Extensive lineup of high-quality products
● Business operation with high customer satisfaction
Sony BankBanking business
Value Creation Story
Sony Financial Holdings Inc.Annual Report20204
⊘ This is a preview!⊘
Do you want full access?
Subscribe today to unlock all pages.
Trusted by 1+ million students worldwide
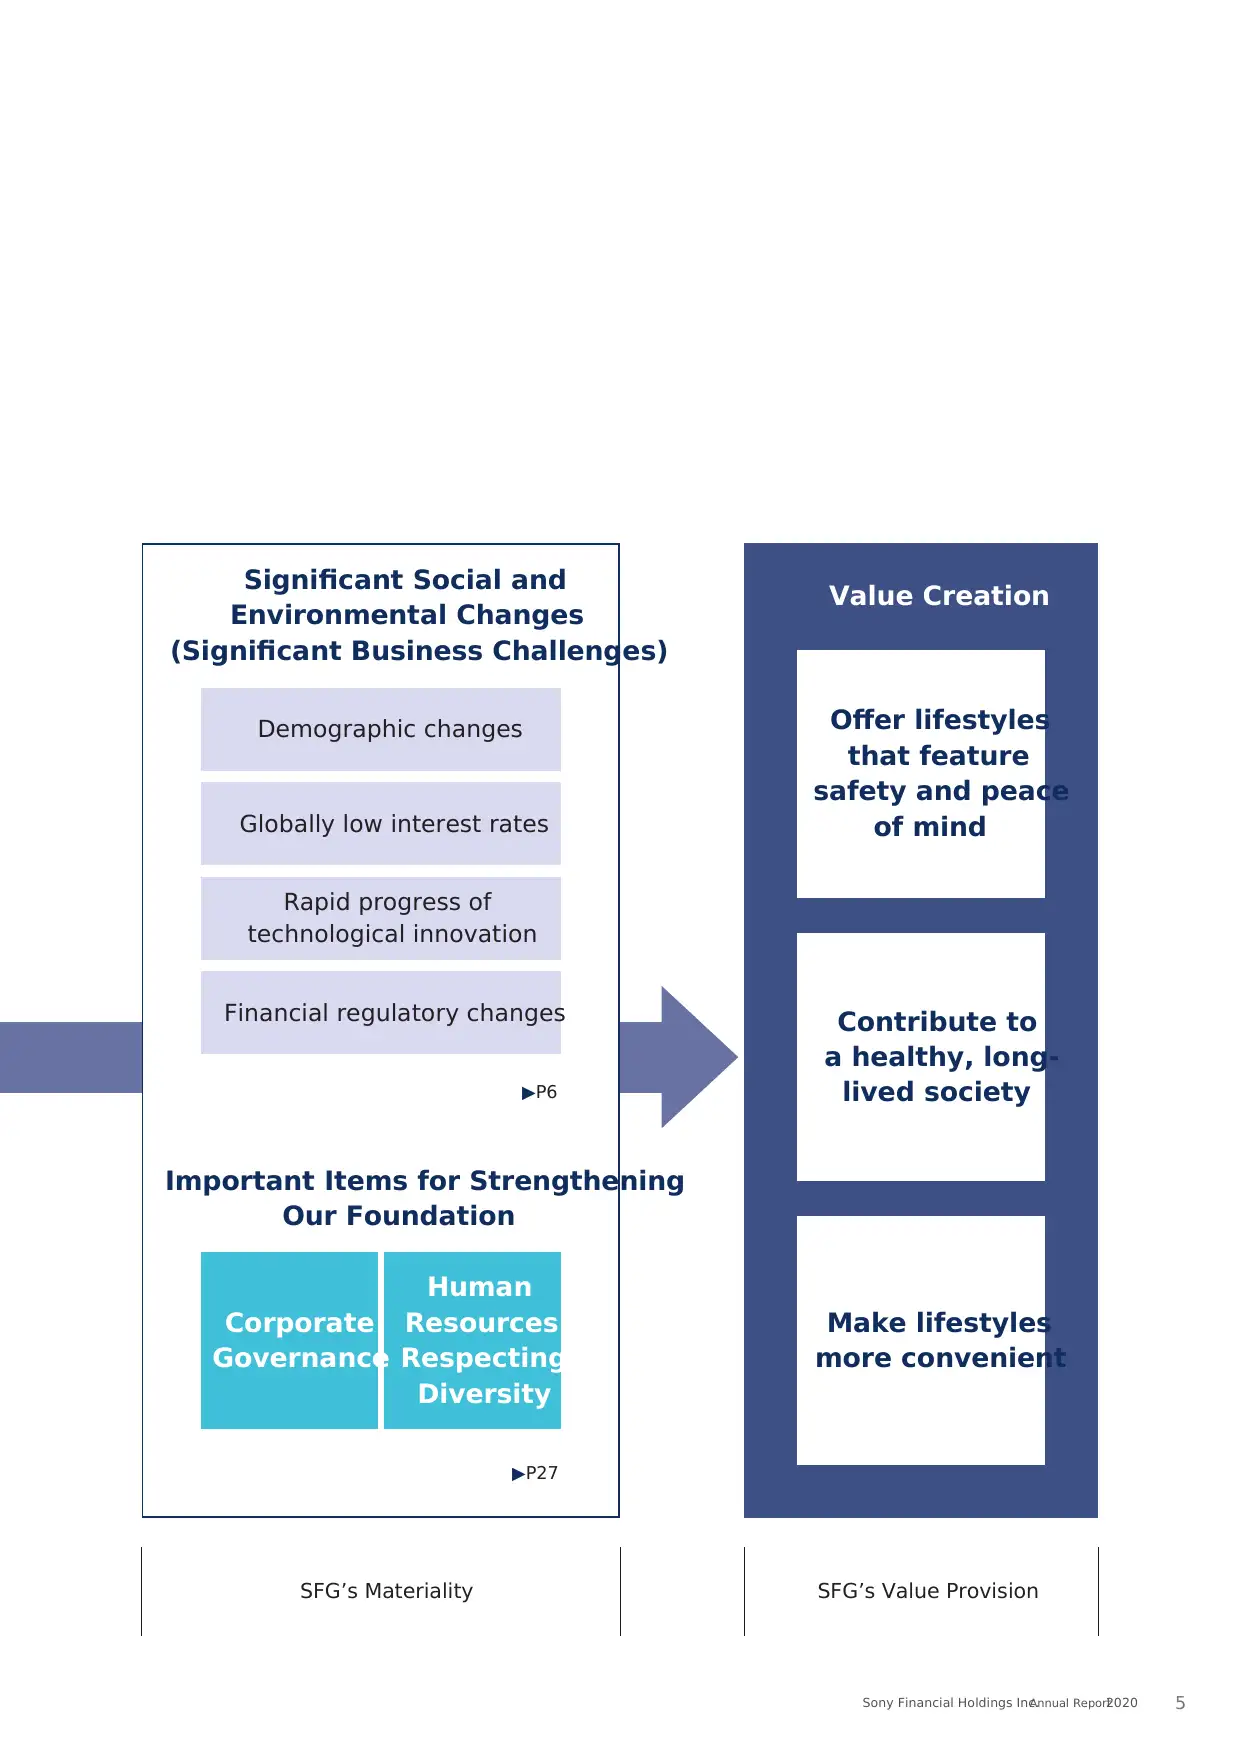
SFG’s Materiality SFG’s Value Provision
Significant Social and
Environmental Changes
(Significant Business Challenges)
Value Creation
Make lifestyles
more convenient
Offer lifestyles
that feature
safety and peace
of mind
Contribute to
a healthy, long-
lived society
▶P27
Corporate
Governance
Human
Resources
Respecting
Diversity
Important Items for Strengthening
Our Foundation
▶P6
Demographic changes
Globally low interest rates
Rapid progress of
technological innovation
Financial regulatory changes
Sony Financial Holdings Inc.Annual Report2020 5
Paraphrase This Document
Need a fresh take? Get an instant paraphrase of this document with our AI Paraphraser
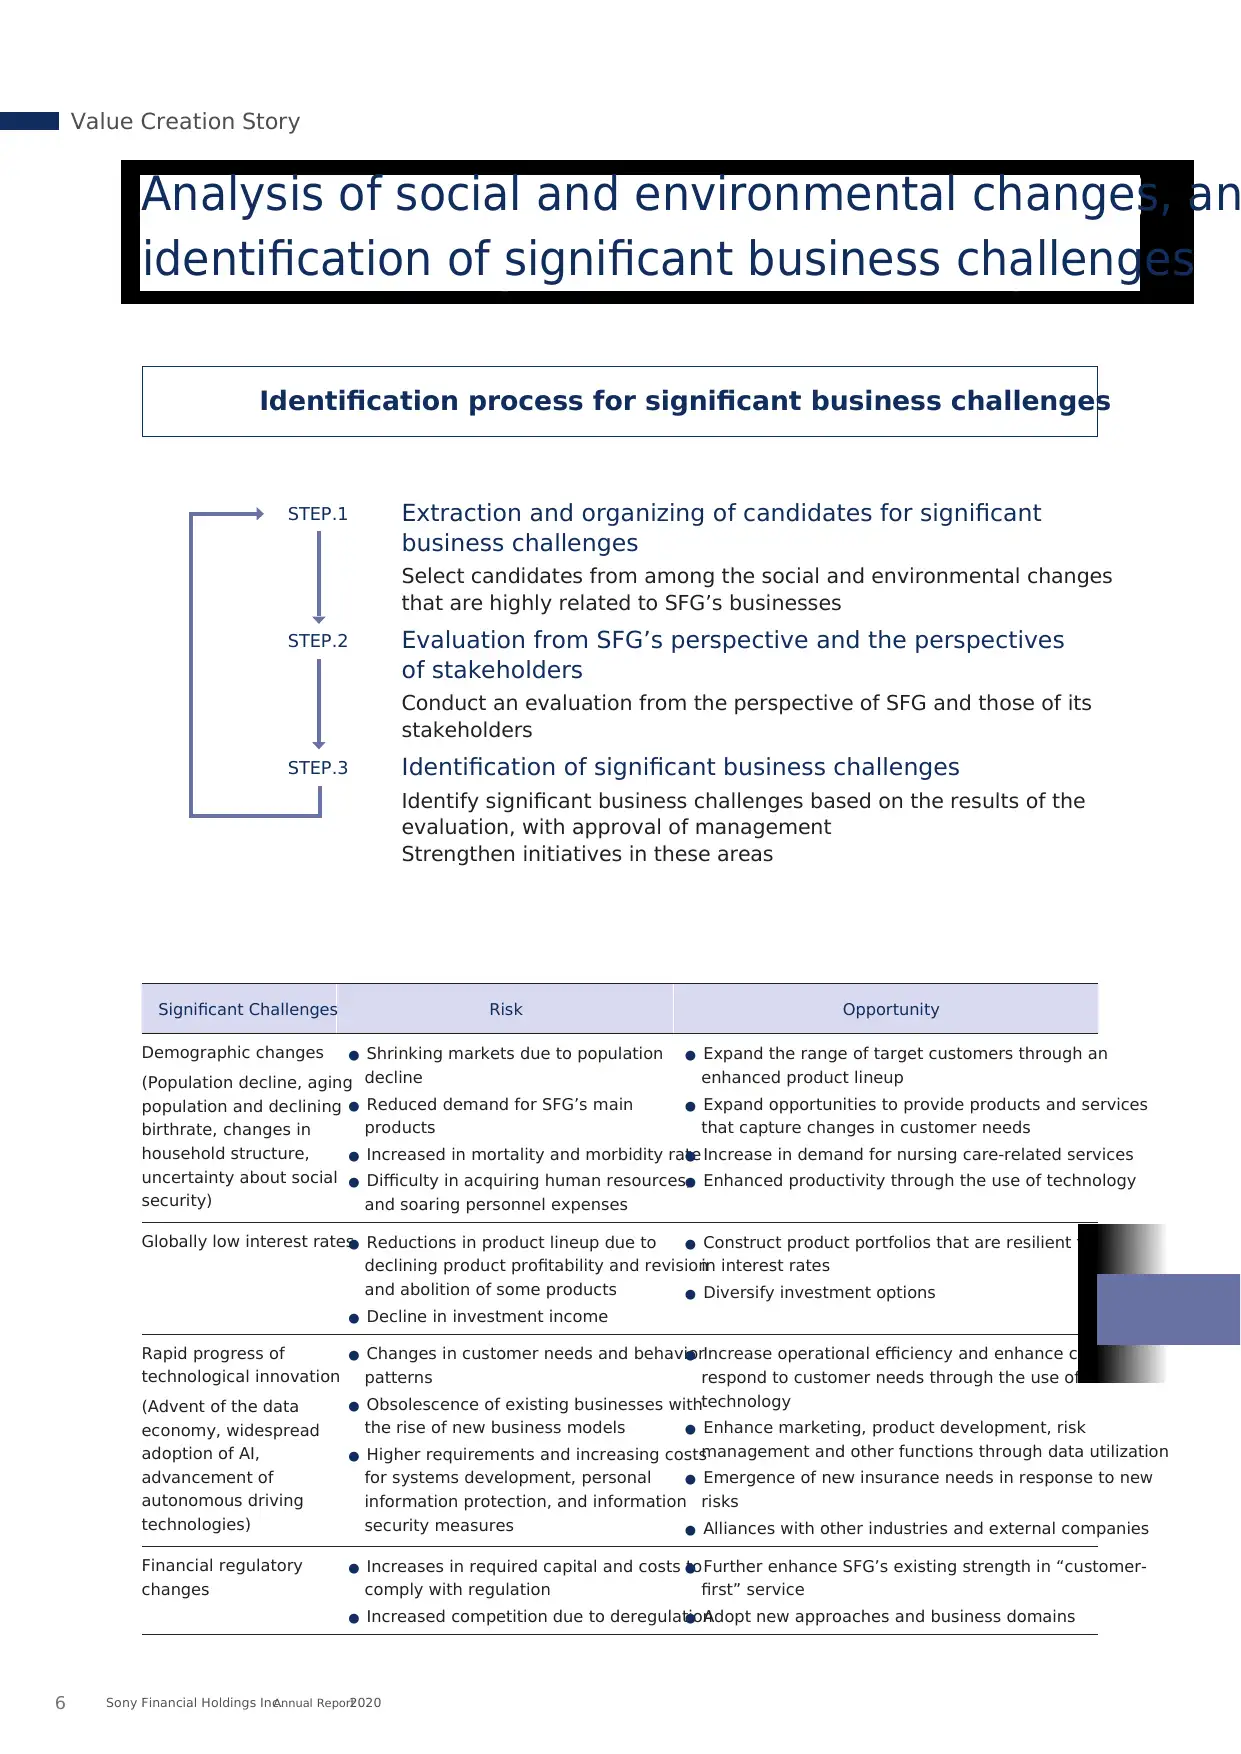
Significant Challenges Risk Opportunity
Demographic changes
(Population decline, aging
population and declining
birthrate, changes in
household structure,
uncertainty about social
security)
● Shrinking markets due to population
decline
● Reduced demand for SFG’s main
products
● Increased in mortality and morbidity rate
● Difficulty in acquiring human resources,
and soaring personnel expenses
● Expand the range of target customers through an
enhanced product lineup
● Expand opportunities to provide products and services
that capture changes in customer needs
● Increase in demand for nursing care-related services
● Enhanced productivity through the use of technology
Globally low interest rates● Reductions in product lineup due to
declining product profitability and revision
and abolition of some products
● Decline in investment income
● Construct product portfolios that are resilient to changes
in interest rates
● Diversify investment options
Rapid progress of
technological innovation
(Advent of the data
economy, widespread
adoption of AI,
advancement of
autonomous driving
technologies)
● Changes in customer needs and behavior
patterns
● Obsolescence of existing businesses with
the rise of new business models
● Higher requirements and increasing costs
for systems development, personal
information protection, and information
security measures
● Increase operational efficiency and enhance capacity to
respond to customer needs through the use of
technology
● Enhance marketing, product development, risk
management and other functions through data utilization
● Emergence of new insurance needs in response to new
risks
● Alliances with other industries and external companies
Financial regulatory
changes
● Increases in required capital and costs to
comply with regulation
● Increased competition due to deregulation
● Further enhance SFG’s existing strength in “customer-
first” service
● Adopt new approaches and business domains
Analysis of social and environmental changes, an
identification of significant business challenges
STEP.2
STEP.3
STEP.1
Evaluation from SFG’s perspective and the perspectives
of stakeholders
Conduct an evaluation from the perspective of SFG and those of its
stakeholders
Identification of significant business challenges
Identify significant business challenges based on the results of the
evaluation, with approval of management
Strengthen initiatives in these areas
Extraction and organizing of candidates for significant
business challenges
Select candidates from among the social and environmental changes
that are highly related to SFG’s businesses
Identification process for significant business challenges
Value Creation Story
Sony Financial Holdings Inc.Annual Report20206
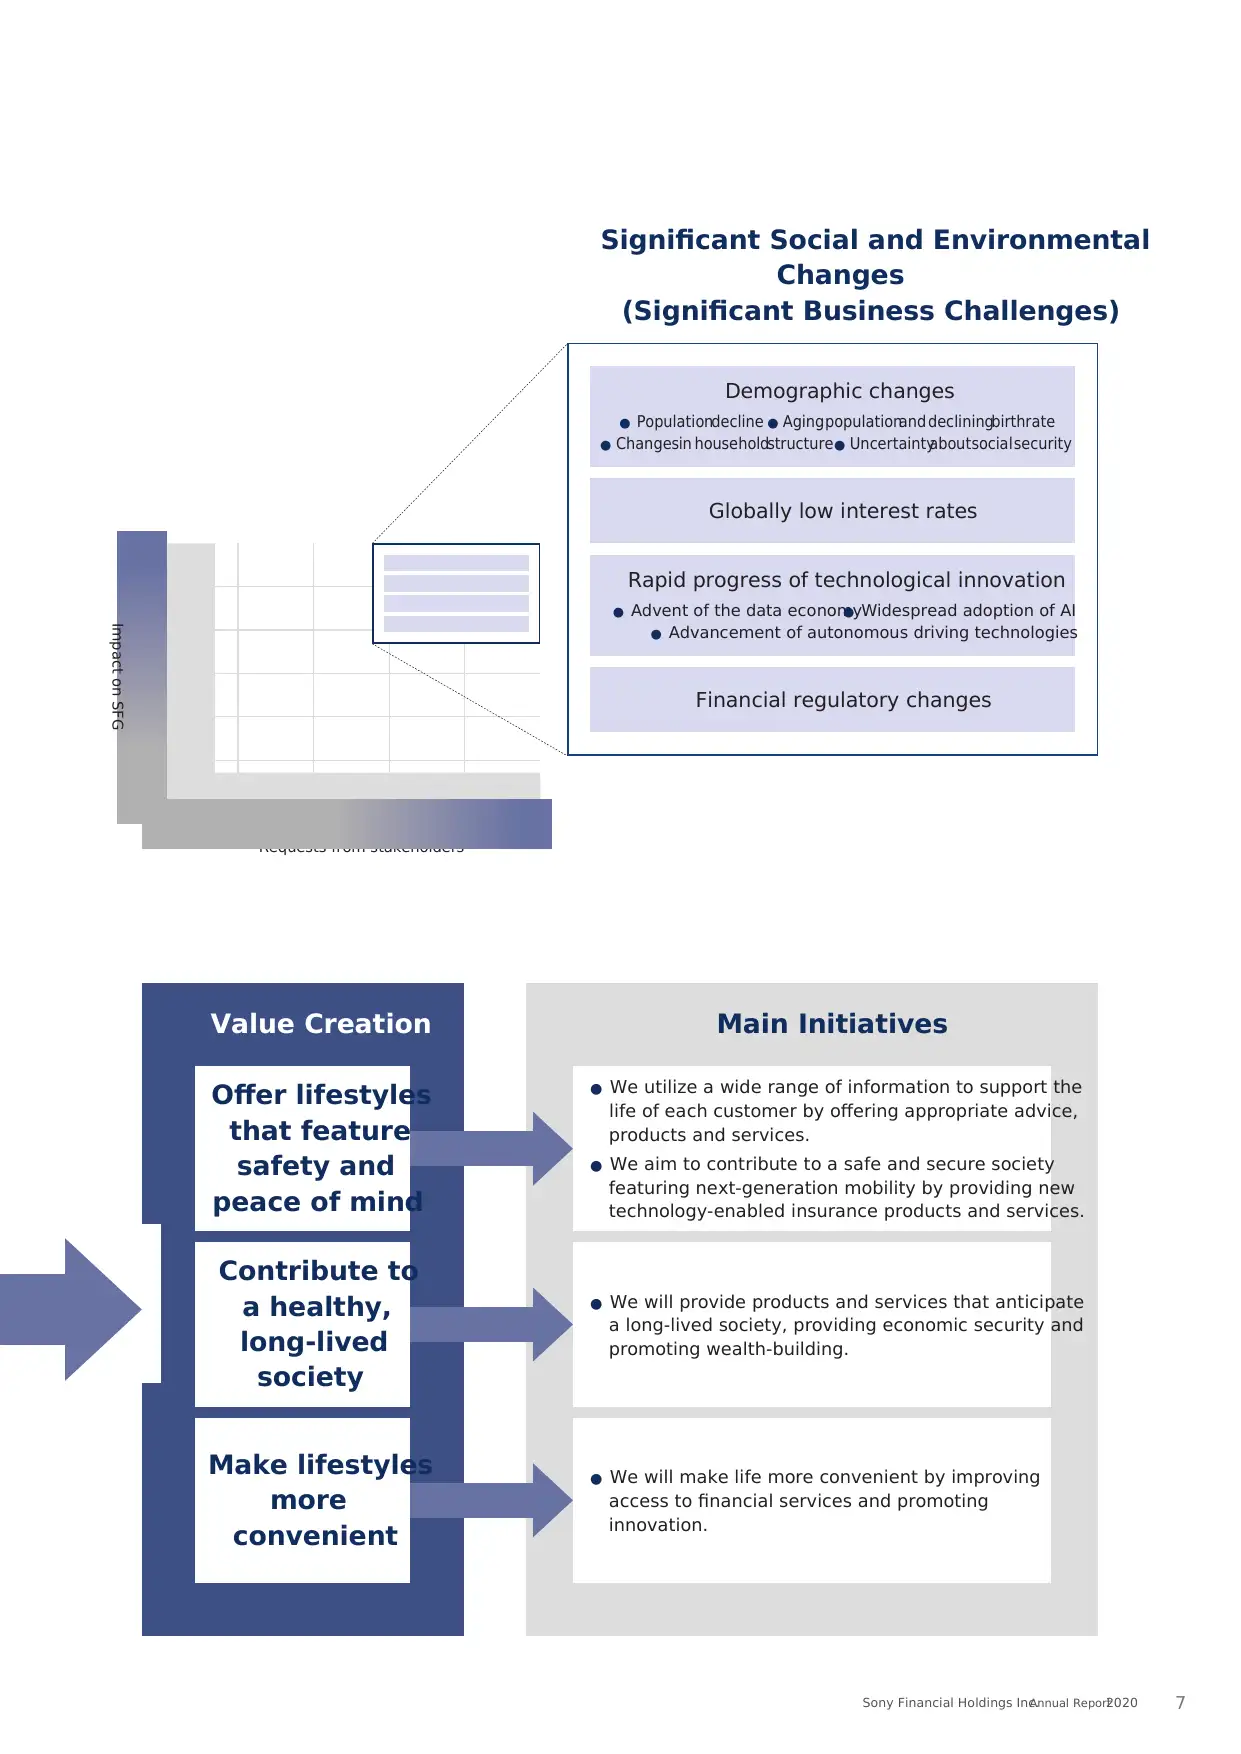
Value Creation Main Initiatives
Make lifestyles
more
convenient
Offer lifestyles
that feature
safety and
peace of mind
● We utilize a wide range of information to support the
life of each customer by offering appropriate advice,
products and services.
● We aim to contribute to a safe and secure society
featuring next-generation mobility by providing new
technology-enabled insurance products and services.
● We will provide products and services that anticipate
a long-lived society, providing economic security and
promoting wealth-building.
● We will make life more convenient by improving
access to financial services and promoting
innovation.
Contribute to
a healthy,
long-lived
society
Requests from stakeholders
Significant Social and Environmental
Changes
(Significant Business Challenges)
Demographic changes
● Populationdecline ● Aging populationand decliningbirthrate
● Changesin householdstructure● Uncertaintyaboutsocial security
Globally low interest rates
Rapid progress of technological innovation
● Advent of the data economy● Widespread adoption of AI
● Advancement of autonomous driving technologies
Financial regulatory changes
Impact on SFG
Sony Financial Holdings Inc.Annual Report2020 7
⊘ This is a preview!⊘
Do you want full access?
Subscribe today to unlock all pages.
Trusted by 1+ million students worldwide
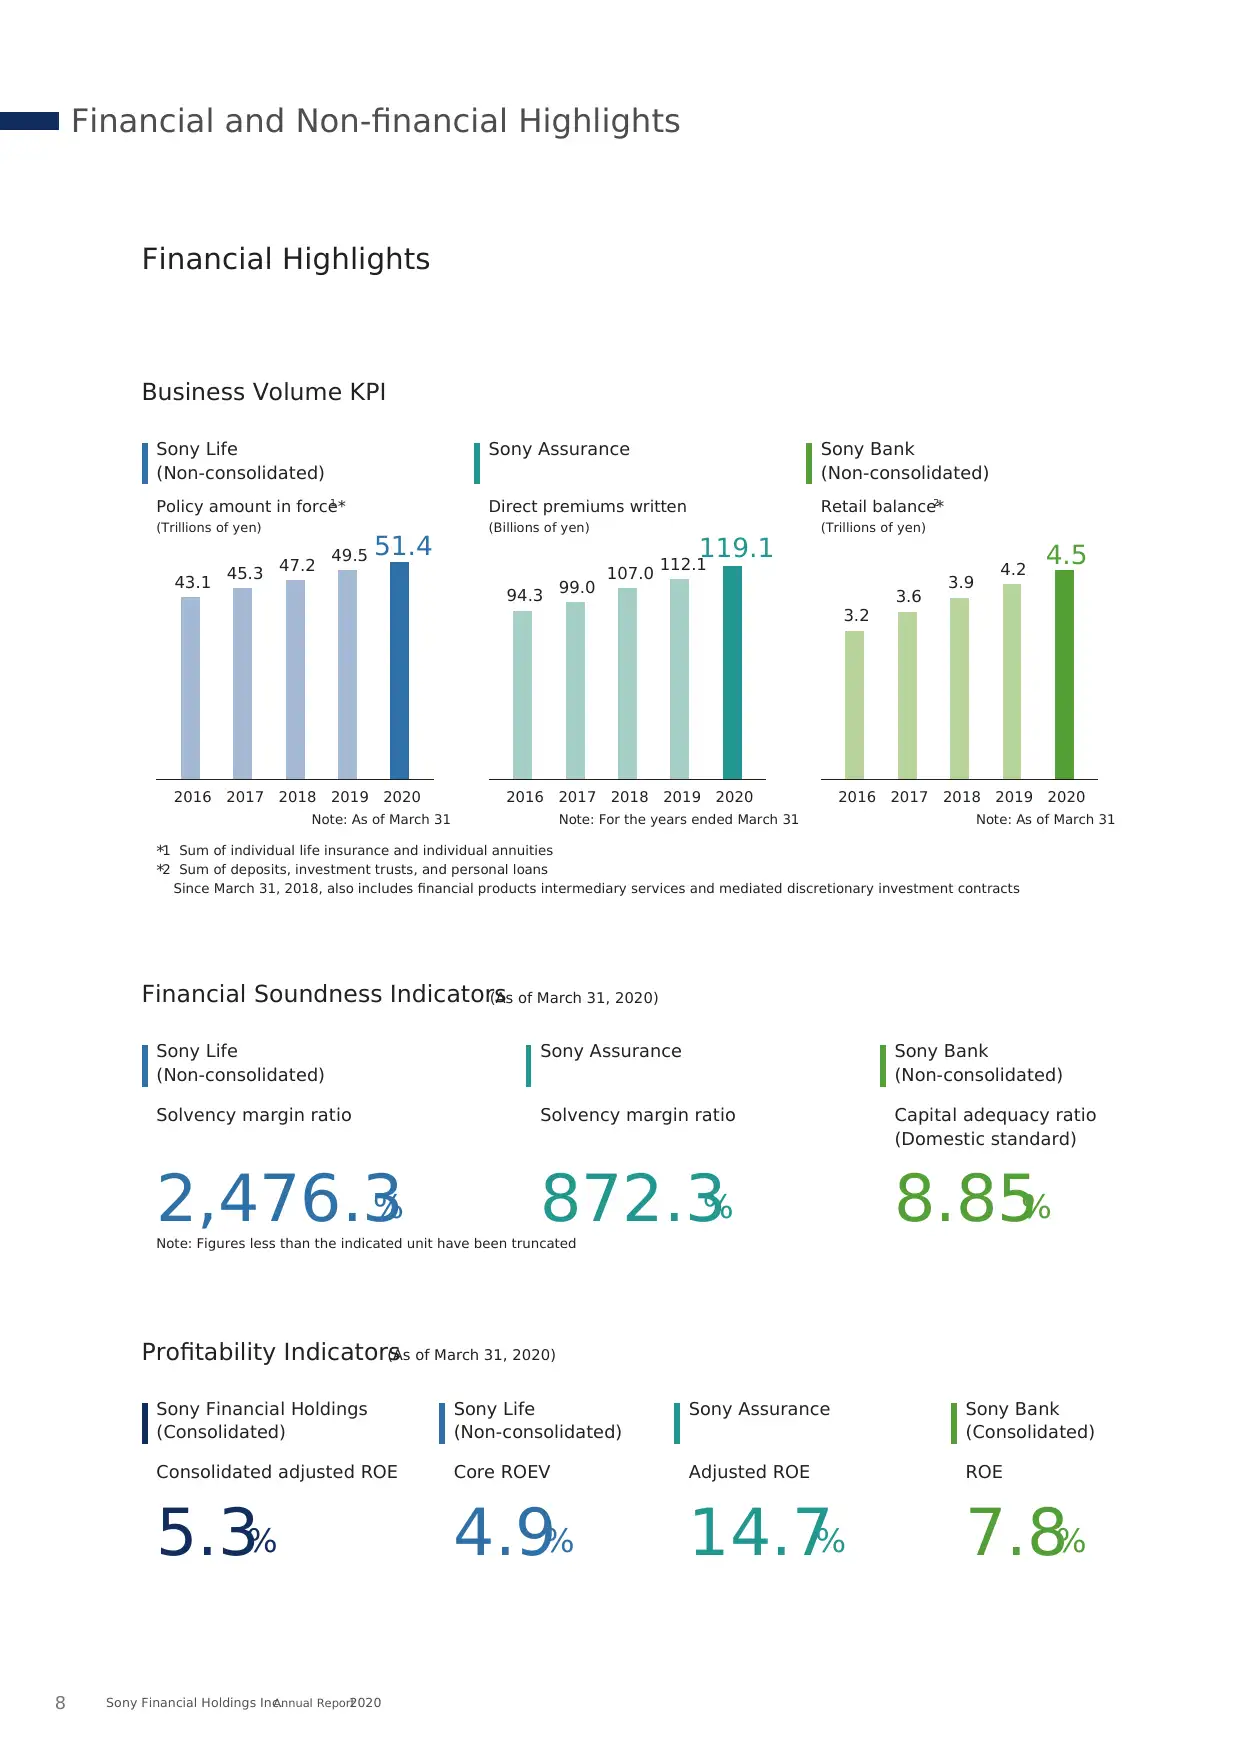
Solvency margin ratio
2,476.3%
Solvency margin ratio
872.3%
Capital adequacy ratio
(Domestic standard)
8.85%
Financial Soundness Indicators(As of March 31, 2020)
Sony Life
(Non-consolidated)
Sony Assurance Sony Bank
(Non-consolidated)
Profitability Indicators(As of March 31, 2020)
Consolidated adjusted ROE
5.3%
Sony Financial Holdings
(Consolidated)
Adjusted ROE
14.7%
Sony Assurance
ROE
7.8%
Sony Bank
(Consolidated)
Core ROEV
4.9%
Sony Life
(Non-consolidated)
Business Volume KPI
*1 Sum of individual life insurance and individual annuities
*2 Sum of deposits, investment trusts, and personal loans
Since March 31, 2018, also includes financial products intermediary services and mediated discretionary investment contracts
Note: Figures less than the indicated unit have been truncated
Financial Highlights
Sony Life
(Non-consolidated)
Sony Assurance Sony Bank
(Non-consolidated)
2016 2017 2018 2020
43.1 45.3 47.2
51.4
2019
49.5
2016 2017 2018 2020
94.3 99.0 107.0
119.1
2019
112.1
2016 2017 2018 2020
3.2
3.6 3.9
4.5
2019
4.2
Note: As of March 31 Note: As of March 31Note: For the years ended March 31
Policy amount in force*1
(Trillions of yen)
Direct premiums written
(Billions of yen)
Retail balance*2
(Trillions of yen)
Financial and Non-financial Highlights
Sony Financial Holdings Inc.Annual Report20208
Paraphrase This Document
Need a fresh take? Get an instant paraphrase of this document with our AI Paraphraser
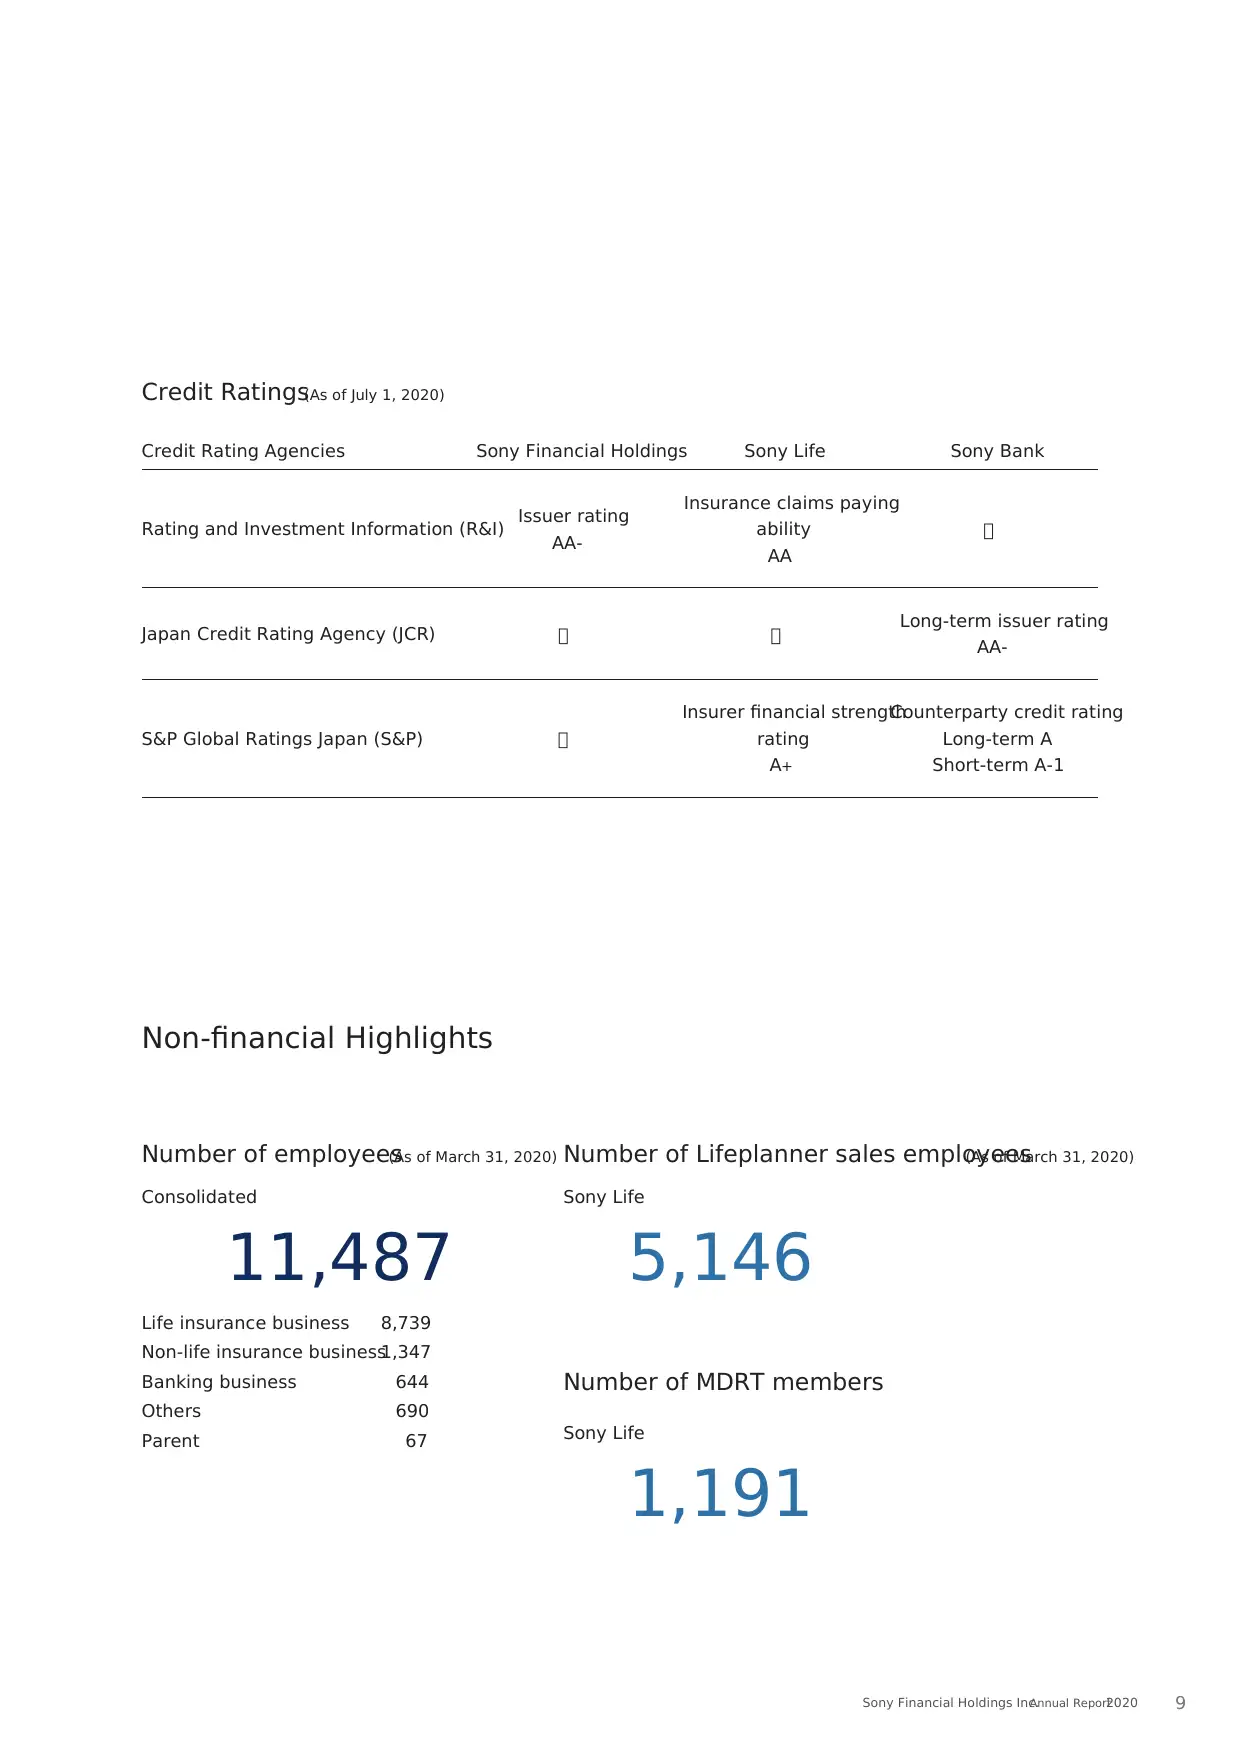
Credit Ratings(As of July 1, 2020)
Credit Rating Agencies Sony Financial Holdings Sony Life Sony Bank
Rating and Investment Information (R&I) Issuer rating
AA-
Insurance claims paying
ability
AA
ー
Japan Credit Rating Agency (JCR) ー ー Long-term issuer rating
AA-
S&P Global Ratings Japan (S&P) ー
Insurer financial strength
rating
A+
Counterparty credit rating
Long-term A
Short-term A-1
Number of employees(As of March 31, 2020)
Non-financial Highlights
Consolidated
11,487
Sony Life
5,146
Number of Lifeplanner sales employees(As of March 31, 2020)
Number of MDRT members
Sony Life
1,191
Life insurance business 8,739
Non-life insurance business1,347
Banking business 644
Others 690
Parent 67
Sony Financial Holdings Inc.Annual Report2020 9
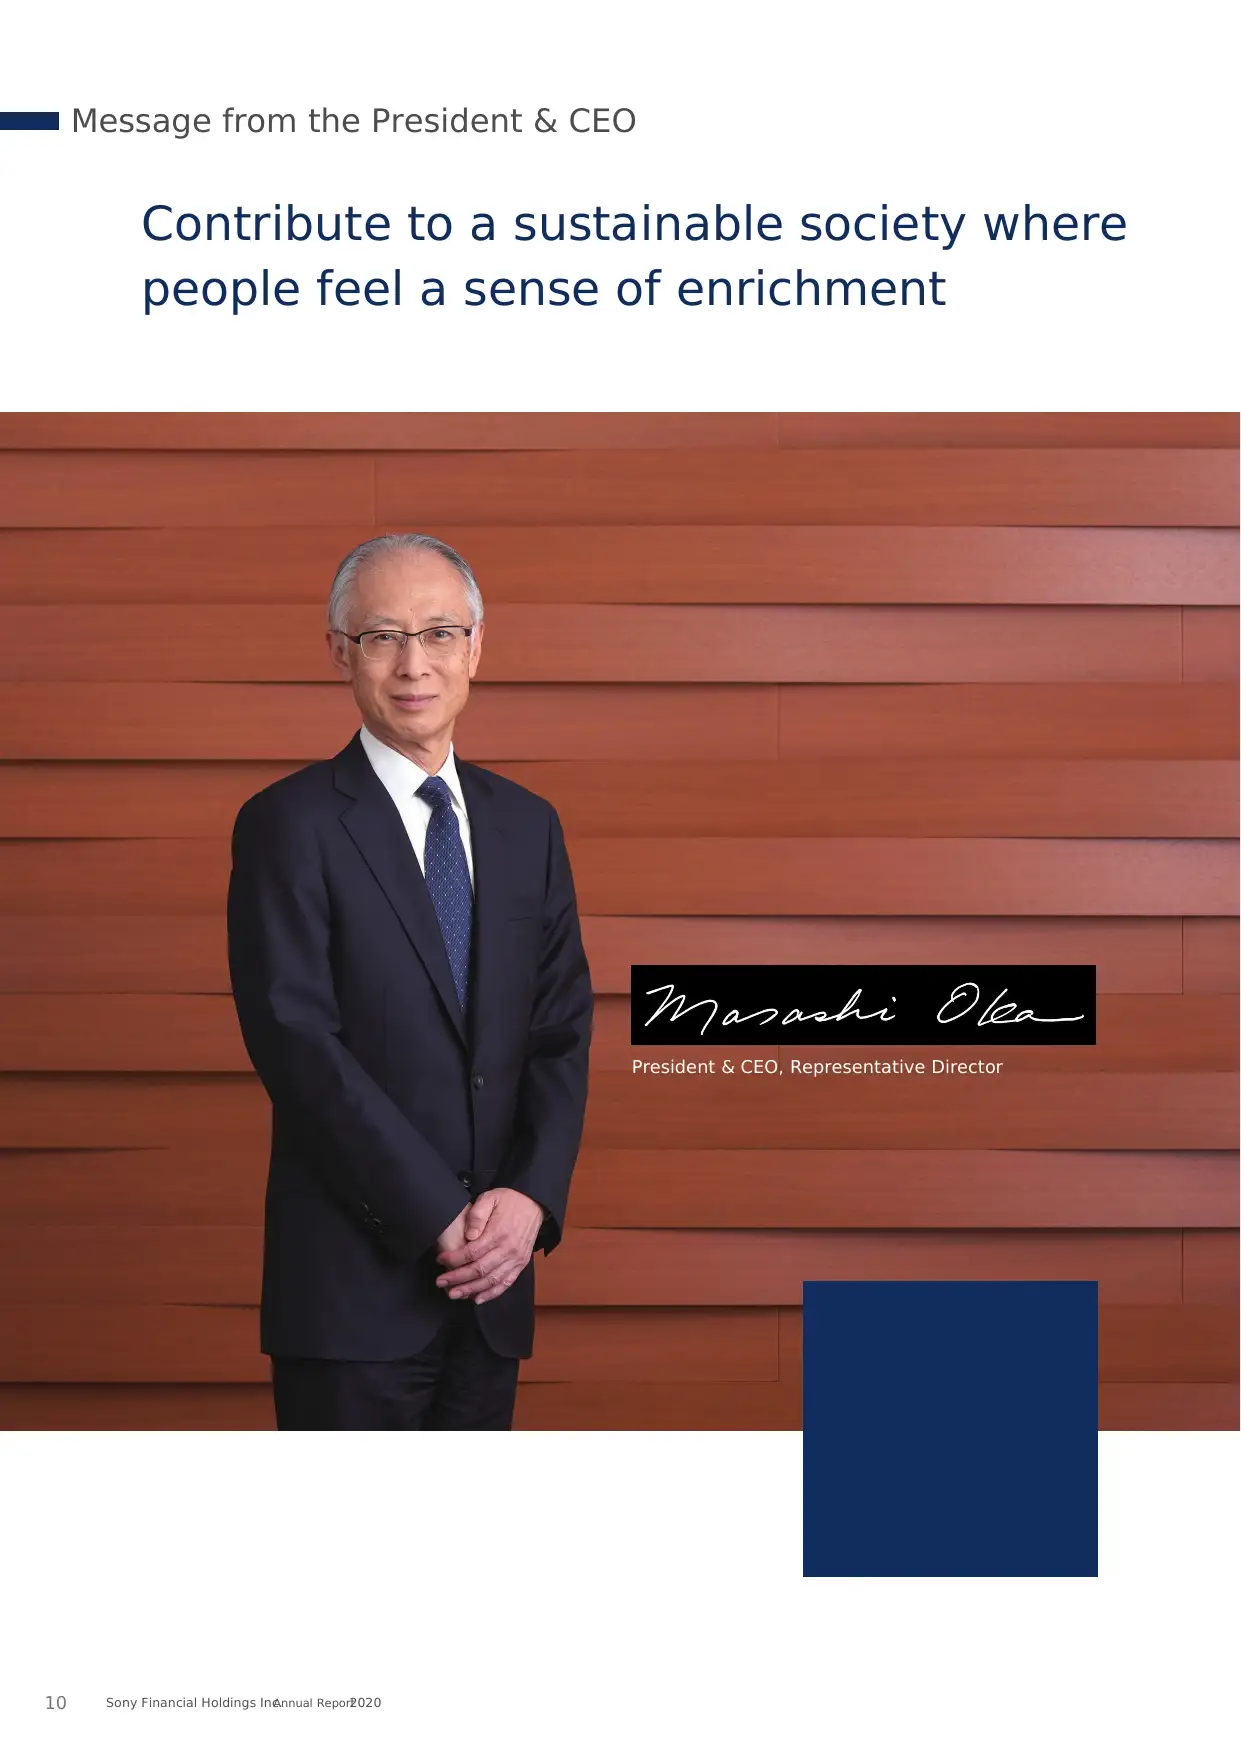
Contribute to a sustainable society where
people feel a sense of enrichment
President & CEO, Representative Director
Message from the President & CEO
Sony Financial Holdings Inc.Annual Report202010
people feel a sense of enrichment
President & CEO, Representative Director
Message from the President & CEO
Sony Financial Holdings Inc.Annual Report202010
⊘ This is a preview!⊘
Do you want full access?
Subscribe today to unlock all pages.
Trusted by 1+ million students worldwide
1 out of 100
Your All-in-One AI-Powered Toolkit for Academic Success.
+13062052269
info@desklib.com
Available 24*7 on WhatsApp / Email
![[object Object]](/_next/static/media/star-bottom.7253800d.svg)
Unlock your academic potential
Copyright © 2020–2026 A2Z Services. All Rights Reserved. Developed and managed by ZUCOL.